
All Solutions
Page 61: Practice Problems
textbf{underline{textit{Solution}}}
$$
The motion diagram $textbf{is used to represent the motion}$ of any object under observation, where the idea behind the motion diagram is that it represent the motion of the object using dots.
$textbf{underline{Time:}}$ where each dots represent the position of the object at different instant of times, and the time interval between each two consecutive dots is some fixed time, i.e. the first dot represent the position of the object at the beginning of the observation “i.e. $t=0$” and the next dot “the second one” represents the position of the object after some fixed time say 1 second, then third dot would represent the position of the object at $t=2$ second.
That if the time chosen time interval between each two consecutive dots is 1 second, if it was 2 second then the third dot would represent the position of the object at 4 second, in general if the time interval between two consecutive dots is 1$times t$ then the third dot would be at time 2$times t$ and so on.
$textbf{underline{Distance:}}$ moreover, as we said that each dot represent the position of the object then the dots are aligned along some direction say $x$-axis, where the distance between the dots represent the distance traveled by the object during the given time interval and such that each dot represent some given position along $x$-axis.
$textbf{underline{Velocity vector “arrow”:}}$ and as we know that the time interval between two dots is some given time interval say 1 second, and that the distance between the dots represent the distance the object moved during this time interval then we can draw a velocity vector which would have the same direction as the direction of motion, and whose length is proportional to the speed of the object “i.e. the distance between the dots as the time interval is fixed therefor when increasing the distance between the dots the speed increases and hence a greater velocity arrow would represent the speed of the object coming out from the dot”.
$textbf{In short,}$ we can represent the velocity vector of the object using arrows coming out from the dots in the direction of motion whose length are proportional to the distance between the dots “and the speed of the object”.
[ vec{a}= dfrac{v_f-v_i}{t_f-t_i}]
Where,
newenvironment{conditions}
{parvspace{abovedisplayskip}
noindent
begin{tabular}{>{$}c{${}}c<{{}$} @{} p{9.1 cm}}}
{end{tabular}parvspace{belowdisplayskip}}
begin{conditions}
v_i &: & Is the initial velocity of the object represented by the first arrow.\
v_f &: & Is the final velocity of the object represented by the second arrow.\
Delta t = t_f-t_i &: & Represent the time interval between the two dots.\
end{conditions}
Thus by taking the difference in the length of both velocity arrow of the two dots yields an arrow which represents the acceleration vector arrow which is inversely proportional to the time interval between the two dots, and since the time interval is fixed we can safely assume that the arrow represented by the difference in the length of the two velocity vector represents the acceleration vector.\
Where, if the initial velocity vector was greater than the final velocity vector then the difference in the length between both vectors would be negative, which implies that the direction of the acceleration is opposite to the direction of motion, and hence in case of negative length difference we just reverse the acceleration arrow.\
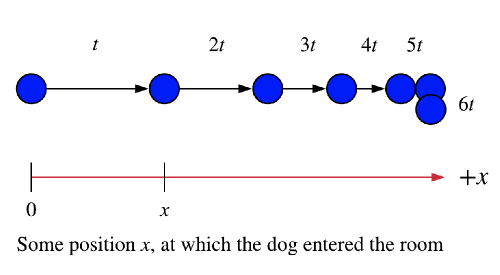
Since, it is only given that the dog entered the room running, we don’t know at what exact time the dog room nor we know what was his initial speed, the given information simply says that the dog had some initial speed while entering the room.
And since, it is given that the dog stopped running while seeing the cat, it means that the dog is not keeping his speed uniform anymore, moreover the dog does not come at rest momentary due to the dog is momentum it take sometime for the dog to come at rest, and so it keeps decelerating till the dog reaches a zero velocity.
Hence the whole scenario could be represent by motion-diagram as follows:
* While the dog entered the room with some initial speed and at some instant of time and position, we could represent the motion of the dog by 2 dots, where the first dot represent the beginning scenario, and the second dot is apart from the first dot at some arbitrary distance and the time interval between the dots is arbitrary as well, as we don’t have an exact information to state neither the position or time, we only need to state that the dog had some initial speed, two dots separated by distance we will clarify this information just fine.
* Since, it is understood that the dog is decelerating after seeing the cat, therefor we could represent the given scenario as dots coming closer a apart, and as the distance between the dots is getting smaller “which represent the distance the dog traveled during the given time interval” than naturally its velocity is getting smaller, and hence the velocity vector coming from each dot is getting shorter.
* After reaching a zero velocity, the dog remains at the same position, therefor the dots is concentric as the time goes by.
And, thus the given scenario could be represented using the following motion-diagram
$$
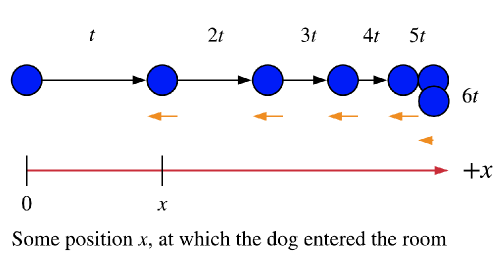
Delta v = v_f – v_i
$$
And since the initial velocity is always greater than the final velocity as the dog is decelerating therefor, the difference between both arrow length should yield a negative value.
The negative sign simply indicates that the resulting is arrow is in the opposite direction of both vectors, and normally as the dog is decelerating then the acceleration vector should be in a direction opposite to the direction of the motion.
$textbf{And as it is given that the dog is decelerating uniformly}$ therefor, the length of the deceleration vector is the same everywhere, until it reaches a zero velocity where it is not decelerating any more hence having a zero acceleration vector.
Therefor, the motion-diagram with acceleration vector is as in the following diagram where the acceleration vector is represented by orange arrows
$textbf{underline{textit{note:}}}$ As, we don’t know the time interval between the dots we can exactly tell the numerical value of the acceleration, the arrow is length is proportional to the numerical value.
* See motion-diagram
* The acceleration vector can be calculated by taking the difference between the velocity vectors from the two consecutive dots, as the time interval between the dots is known and the distance between the dots is known we can find the acceleration given the following equation
$$
a = dfrac{v_f-v_i}{t}
$$
Where, the velocities is calculated knowing the distance between the two dots and the time interval between the dots, and then by knowing the difference between the two velocities and using the above equation, where $t$ represents the time interval between the two dots we can find the acceleration vector, See the second motion-diagram.
textbf{underline{textit{Solution}}}
$$
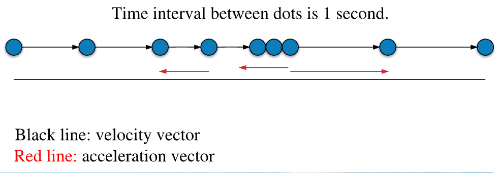
In this time intervals that velocity is constant, representing that using a motion diagram would be equidistant dots such that the time interval between two successive dots is 1 second, and the distance between the 2 dots represent the magnitude “length of the vector” of the speed.
Such that for example in the time interval from:
$textbf{underline{textit{[0,2] seconds:}}}$ we would have a dot that represents the beginning of the motion “i.e. time is $t=0$”, a dot for $t=1$ s and a dot for $t=2$ s, and the distance between two successive dots is equal because the speed is the same from [0,1] and [1,2] s.
$textbf{underline{textit{[3,5] seconds:}}}$, we would have also a 3 equidistant dots but with a separating distance that is much less than that of the dots representing the velocity in the time interval [0,2] as the speed is smaller in value.
$textbf{underline{textit{[6,7] seconds:}}}$ we have two dots with no separating distance because the velocity is zero.
In short, the distance separating the dots is proportional to the speed of the object under observation.
$textbf{underline{textit{[1,2] seconds:}}}$ the line representing the velocity of the object have a negative slope, which means that the velocity is decelerating, as the slope of the line represents the acceleration of the object, and moreover we expect if we draw a motion diagram that the dots gets closer to each other as the speed is decreasing. The $textbf{same}$ for the time interval [5,6] seconds.
$textbf{underline{textit{[7,8] seconds:}}}$ we find that the slope of the line is positive which means that the object is accelerating, thus we expect that the dots gets farther a part as time goes by until is stop accelerating at $t=8$ s.
Where the slope of the line is zero which means that the object under observation is neither accelerating nor decelerating, and after that moment the separation between the dots is then equal with a separation which is proportional to the speed of the object “the separation at this time interval would be the greatest of all the dots because the speed at this time interval is the greatest in the whole time interval of the journey”.
textbf{underline{textit{Solution}}}
$$
item Knowing that the slope of the line representing the motion of an object under study in a velocity-time graph yields the acceleration of this object, thus to find the interval of time where the velocity of the train is constant thus we need to find the time interval during which the representing line have a zero slope “i.e. a horizontal line”.\
Examining the given graph carefully we find that the velocity-time is represented by a horizontal line in the time interval [5,15] seconds, thus the train have a constant speed in this time interval.\
item The acceleration is positive when the slope of the representing line is positive, the only interval where the line representing the motion of the train have a positive value is in the time interval [0,5] seconds.\
item The train’s acceleration is negative when the slope of the representing line in the velocity-time graph is negative, the time intervals where the slope of the representing line is negative is in the time interval [15,20] seconds and [20,40] seconds.\
However, we notice that the magnitude of the velocity decreases much faster in the time interval [15,20] seconds where the magnitude of the speed decreases more and in a shorter period of time, thus this interval have the most negative acceleration.\
textbf{underline{textit{Or}}} simply since the slope of the line in the time interval [15,20] seconds is more negative than the slope of the line in the interval [20,40] seconds, thus the time interval where the train have the most negative is [15,20] seconds.
item In the time interval [5,15] seconds.
item In the time interval [0,5] seconds.
item In the time interval [15,20] seconds.
textbf{underline{textit{Solution}}}
$$
{parvspace{abovedisplayskip}
noindent
begin{tabular}{>{$}l{${}}c<{{}$} @{} l}}
{end{tabular}parvspace{belowdisplayskip}}
textbf{underline{textit{Knowns:}}} The average acceleration of a moving object can be calculated using the following equation
[ a= dfrac{v_f – v_i}{t}tag{1}]
Where,
begin{conditions}
v_f&:& Is the final velocity of the moving object.\
v_i&: & Is the initial velocity of the moving object.\
t & :& The time duration of acceleration.
end{conditions}
Using equation (1), we can find the average acceleration knowing the change in the speed of the object and the duration during which the speed changed.\
textbf{underline{textit{In the time interval [0,5] seconds:}}} the train was initially at rest and the final speed is 10 m/s, and the time duration during which the change occurred is 5 seconds, and since the speed have increased thus we expect that the acceleration have a positive value.\
textbf{underline{textit{In time interval [15,20] seconds:}}} the train is initial speed is 10 m/s and the final speed is 4 m/s, and the time duration is 5 seconds, and as the speed have decreased thus we expect that the acceleration is negative.\
textbf{underline{textit{In time interval [0,40] seconds:}}} the initial speed of the train is at rest and a its final speed is zero, and the time duration during which the change occurs is 40 seconds, its obvious that during the whole interval the average acceleration is zero as there is no change occurred to the speed of the train.\
enumerate[bfseries (a)]
item ~\
The average acceleration during the time interval [0,5] seconds is
begin{align*}
a &= dfrac{10-0}{5}\
&= fbox{$2 ~ rm{m/s}^2$}\
end{align*}
item ~\
The average acceleration during the time interval [15,20] seconds is
begin{align*}
a &= dfrac{4-10}{5}\
&= fbox{$-1.2 ~ rm{m/s}^2$}\
end{align*}
item ~\
The average acceleration during the time interval [0,40] seconds is
begin{align*}
a &= dfrac{0-0}{40}\
&= fbox{zero}\
end{align*}
item 2 m/s$^2$.
item -1.2 m/s$^2$.
item Zero.
textbf{underline{textit{Solution}}}
$$
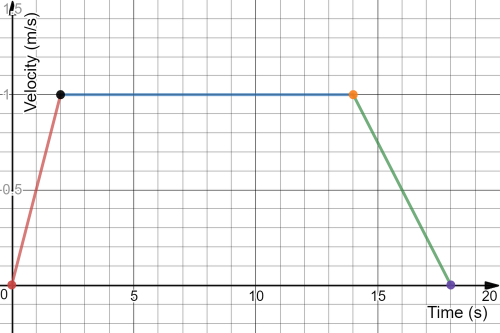
And since it is given that the elevator accelerates from rest with an accelerati
on 0.5 m/s$^2$ for 2 seconds, thus the line representing this motion in the velocity time graph will be a straight line passing between the 2 points (0,0) and (2,1) “note that the slope of the straight line using this 2 points is 0.5” where the final speed of the elevator after 2 seconds is 1 m/s where the speed is calculated from the following equation
$$
v_f = v_i + at tag{1}
$$
Then after 2 seconds it is given that the elevator starts to have a constant speed of 1 m/s for 12 seconds, the line representing such motion will be a horizontal line where the elevator is neither accelerating nor decelerating therefor the slope of the line representing such motion will have a zero slope, and hence the line representing this motion will be a horizontal straight line connecting the 2 points (2,1) and (14,1).
After 14 seconds it is given that the elevator starts to decelerate with a constant of acceleration of 0.25 m/s$^2$ for 4 seconds, using equation (1) and knowing that the initial velocity is 1 m/s and the duration of acceleration is 4 seconds, we find that the final velocity is zero, thus the line representing this motion would be the straight line passing between (14,1) and (18,0) “note that the slope of the straight line using this 2 points is 0.25”.
From the question, we know that the initial velocity of the car is 4 $text{ $dfrac{m}{s}$}$ whereas the final velocity is 36 $text{ $dfrac{m}{s}$}$ and the time taken for this increase in velocity is 4 seconds.
Acceleration is the change in velocity per unit time. So the formula from which we can calculate the acceleration will be :
a = $dfrac{ Delta v}{Delta t}$
$mathbf{where;}$
a = acceleration
$Delta$ v = change in velocity ( Final Velocity – Initial Velocity )
$Delta$ t = time taken ( Final time – Initial time)
1) Using the formula stated in cell 2.
a = $dfrac{ Delta v}{ Delta t}$
2) Substituting the values in the formula :
a = $dfrac{(36 – 4)}{4} \ \$
$$
boxed{a = 8.0 dfrac{m}{s^2} }
$$
boxed{a = 8.0 dfrac{m}{s^2} }
$$
textbf{underline{textit{Solution}}}
$$
{parvspace{abovedisplayskip}
noindent
begin{tabular}{>{$}l{${}}c<{{}$} @{} l}}
{end{tabular}parvspace{belowdisplayskip}}
textbf{underline{textit{Knowns:}}} The average acceleration of a moving object can be calculated using the following equation
[ a= dfrac{v_f – v_i}{t}tag{1}]
Where,
begin{conditions}
v_f & : & Is the final velocity of the moving object.\
v_i & : & Is the initial velocity of the moving object.\
t& : & Time duration of the acceleration.
end{conditions}
Using equation (1), we can find the average acceleration knowing the change in the speed of the object and the duration during which the car accelerated.\
Where the initial speed of the car is 4 m/s and the final speed of the car is 36 m/s, and the duration of acceleration is 4 seconds, and since the speed is increasing then we expect for the acceleration to be positive.
The average acceleration during the time interval [0,4] seconds is
$$
begin{align*}
a &= dfrac{36-4}{4}\
&= fbox{$8 ~ rm{m/s}^2$}\
end{align*}
$$
$a=dfrac{v_{f}-v_{i}}{t}$
$a=dfrac{ 15 – 36}{ 3}$
=-7 $m/s^2$
– The initial speed of the car $v_{text{i}}=36 , frac{text{m}}{text{s}}$
– The final speed of the car $v_{text{f}}=15 , frac{text{m}}{text{s}}$
– The time interval of movement $Delta t=3.0text{ s}$
**Required:**
– The average acceleration over the given time interval.
We know that the average acceleration of a moving object can be expressed via the initial and final velocities and the elapsed time interval as:
$$
begin{split}
overline{a} &= frac{v_{text{f}} – v_{text{i}}}{t_{text{f}} – t_{text{i}}}\
&= frac{v_{text{f}}-v_{text{i}}}{Delta t}
tag{1}
end{split}
$$
Where we introduced the time interval $Delta t$.
$$
begin{align*}
overline{a} &= frac{15 , frac{text{m}}{text{s}} – 36 , frac{text{m}}{text{s}}}{3.0text{ s}}\
&= boxed{-7.0 , frac{text{m}}{text{s}^2}}
end{align*}
$$
Where we rounded the final expression to $2$ significant digits since that reflects the precision of the least precise piece of the given data.
a = dfrac{v_{f} – v_{i}}{t_{f}-t_{i}}
$$
a = dfrac{4.5m/s – (-3m/s)}{2.5s-0}
$$
– The initial speed of the car $v_{text{i}}=-3.0 , frac{text{m}}{text{s}}$ (note the negative sign, since the car initially moves downhill, and the positive direction was chosen to point uphill)
– The final speed of the car $v_{text{f}}=4.5 , frac{text{m}}{text{s}}$ (positive since since the car finally moves uphill)
– The time interval of movement $Delta t=2.5text{ s}$.
**Required:**
– The average acceleration over the given time interval.
We know that the average acceleration of a moving object can be expressed via the initial and final velocities and the elapsed time interval as:
$$
begin{split}
overline{a} &= frac{v_{text{f}} – v_{text{i}}}{t_{text{f}} – t_{text{i}}}\
&= frac{v_{text{f}} – v_{text{i}}}{Delta t}
tag{1}
end{split}
$$
Where we introduced the time interval $Delta t$.
$$
begin{align*}
overline{a} &= frac{4.5 , frac{text{m}}{text{s}} – left(-3.0 , frac{text{m}}{text{s}} right)}{2.5text{ s}}\
&= boxed{3.0 , frac{text{m}}{text{s}^2}}
end{align*}
$$
Where we rounded the final expression to $2$ significant digits since that reflects the precision of the least precise piece of the given data.
textbf{underline{textit{Solution}}}
$$
[v_f = v_i + at ]
Rearranging the equation in terms of the acceleration constant, we get
[a = dfrac{v_f-v_i}{t}tag{1} ]
Where,
newenvironment{conditions}
{parvspace{abovedisplayskip}
noindent
begin{tabular}{>{$}c{${}}c<{{}$} @{} p{9.1 cm}}}
{end{tabular}parvspace{belowdisplayskip}}
begin{conditions}
a &: & The constant of deceleration.\
v_f & :& The final velocity of the car.\
v_i & :& The initial velocity of the car.\
t &: & The duration of deceleration.\
end{conditions}
And it is given that the initial velocity is 25 m/s, and the final velocity is zero, and the duration of deceleration is 3.0 seconds, thus knowing all the parameters of equation (1) we can use it to find the deceleration constant.\
~
$textbf{(a):}$ Substituting the known in equation (1), we calculate the deceleration constant as follows
$$
begin{align*}
a &= dfrac{0-25}{3.0}\
&= fbox{$-8.33 ~ rm{m/s}^2$}
end{align*}
$$
And since in the above division process, the least number of significant figures is 2, therefor the final result should have only 2 significant figure, and hence the final result is -8.3 m/s$^2$.
$textbf{(b):}$ If the bust took twice the time with all the other parameters being the same (the final and initial velocity), then we have,
$$
t = 6.0 ~ mathrm{s}
$$
Hence, substituting in equation (1) we have,
$$
begin{align*}
a &= dfrac{0-25}{6.0} \
&= fbox{( -4.16667 ~ mathrm{m cdot s^{-2}} ) }
end{align*}
$$
This means that the deceleration constant in this case would be half that of part (a). And, again the number of the significant figures in the final answer should only have 2 significant figures, there the final answer is thus $-4.2 ~ mathrm{m cdot s^{-2}}$ .
$textbf{(b):}$ The deceleration constant would be equal to $-4.2 ~ mathrm{m cdot s^{-2}}$ , i.e. half that of part (a).
$a=dfrac{v_{f}-v_{i}}{t}$
$a=dfrac{ 0 – 25}{ 3}$
=-8.33 $m/s^2$
$a=dfrac{v_{f}-v_{i}}{t}$
$a=dfrac{ 0 – 25}{6}$
=-4.17$m/s^2$
$$
begin{align*}
t &= 10.0 , mathrm{s} \
v_o &= 3.50 , mathrm{frac{m}{s}} \
v_f &= 0.75 , mathrm{frac{m}{s}}
end{align*}
$$
$$
begin{equation}
vec{a}_{ave} = frac{ Delta{vec{v}}}{Delta{t}} = frac{vec{v}_f-vec{v}_o}{t}
end{equation}
$$
$$
begin{align*}
vec{a}_{ave} &= frac{vec{v}_f – vec{v}_o}{Delta{t}}\
&= frac{0.75 , mathrm{frac{m}{s}}-3.5 , mathrm{frac{m}{s}}}{10.0, mathrm{s}}\
&= boxed{-0.275 , mathrm{frac{m}{s^2}}}
end{align*}
$$
vec{a}_{ave} = -0.275 , mathrm{frac{m}{s^2}}
$$
a = dfrac{v_{f} – v_{i}}{t_{f}-t_{i}}
$$
a = dfrac{.75m/s – 3.5m/s}{10s-0}
$$
a = dfrac{v_{f} – v_{i}}{t_{f}-t_{i}}
$$
a = dfrac{.5cm/y – 1cm/y}{1y-0}
$$
– The initial speed of the continental drift $v_{text{i}}=1 , frac{text{cm}}{text{y}}$
– The final speed of the continental drift $v_{text{f}}=0.5 , frac{text{cm}}{text{y}}$
– The time interval of the deceleration $Delta t=1text{y}$
**Required:**
– The average acceleration over the given time interval.
We know that the average acceleration of a moving object can be expressed via the initial and final velocities and the elapsed time interval as:
$$
begin{split}
overline{a} &= frac{v_{text{f}} – v_{text{i}}}{t_{text{f}} – t_{text{i}}}\
&= frac{v_{text{f}} – v_{text{i}}}{Delta t}
tag{1}
end{split}
$$
Where we introduced the time interval $Delta t$.
$$
begin{align*}
overline{a} &= frac{0.5 , frac{text{cm}}{text{y}} – 1 , frac{text{cm}}{text{y}}}{1text{y}}\
&= boxed{- 0.5 , frac{text{cm}}{text{y}^2}}
end{align*}
$$
