
All Solutions
Page 52: Assessment
textbf{underline{textit{Solution}}}
$$
Moreover, the time interval between two consecutive dots are made to have some specific value of choice, where we can make the time interval between two consecutive dots to be 1 second for example, and also we can draw the distance between the dots using any scale of choice so we can represent the distance moved by the object in a given time interval.\
For example if we draw the dots such that 1 cm on paper scales to 10 m, thus drawing two consecutive dots separated by 1 cm and whose time interval is 1 second means that the object moved 10 m in 1 second, thus we can define the position of a given object during a given instant of time using a motion diagram.\
Moreover, as we know the distance between the dots represent the distance and knowing the time interval between the dots, we can calculate the velocity of the object at a given instant, where
[ v= dfrac{d}{t}]
Where,
newenvironment{conditions}
{parvspace{abovedisplayskip}
noindent
begin{tabular}{>{$}c{${}}c<{{}$} @{} p{10 cm}}}
{end{tabular}parvspace{belowdisplayskip}}
begin{conditions}
v& :& The velocity of the object. at a given dot “instant of time''.\
d &: & The distance separated between the dots “the distance the object moved''.\
t& :& The time duration of the motion “the time interval between the dots''.\end{conditions}
[ a = dfrac{v_f – v_i}{t}]
Where,
newenvironment{conditions}
{parvspace{abovedisplayskip}
noindent
begin{tabular}{>{$}c{${}}c<{{}$} @{} p{10 cm}}}
{end{tabular}parvspace{belowdisplayskip}}
begin{conditions}
a&: & The acceleration of the object at a given time interval.\
v_f & :& The final velocity of the object.\
v_i &: & The initial velocity of the object.\
t & :& the duration during which the velocity of the object changed.\
end{conditions}
Thus, basically representing the motion of some object using the motion diagram actually helps solving some problems concerns the motion of the object, such as finding the velocity and acceleration, but mainly it is one way to represent a given physical problem to help visualize and solve the given problem.
The position is a vector pointing from the origin to the object it describes.
Though it changes as time passes if the object moves, it in no way needs movement to be defined. It is defined for a stationary object as well.
Distance is a scalar quantity describing the length of a line joining two points in space.
Though it changes as time passes if the relevant objects move, it in no way needs movement to be defined. It is defined for stationary objects as well.
Displacement is a vector pointing from the initial position, to the final position of an object it describes.
Since it describes how an object changes its position as time passes, it needs movement to be defined.
It is actually zero for stationary objects.
If two lines intersect, that means that the bodies they describe have both coordinates the same. That is, they are located at the same point in the same moment of time.
This means that if two lines intersect, that corresponds to one skater passing by the other one.
If two lines appear to converge, an intersection will happen at some point, and it will correspond to one skater passing by the other.
textbf{underline{textit{Solution}}}
$$
item If we examine the given graph, we find that the position is represented on the $y$-axis and the time is represented on the $x$-axis.\
And since the slope is given by
[ m=dfrac{y_2-y_1}{x_1-x_2}]
Thus, the slope of the line “representing the motion of the rabbit” is the speed of the rabbit, and if the speed of the rabbit is doubled then the slope will be doubled, thus the straight line representing the rabbit is motion will be steeper.\
item If the rabbit ran in the opposite direction with the same speed, then the line representing the motion of the rabbit would have a slope with the same magnitude and a negative sign, and the position would be represented on the negative $y$-axis, as follows
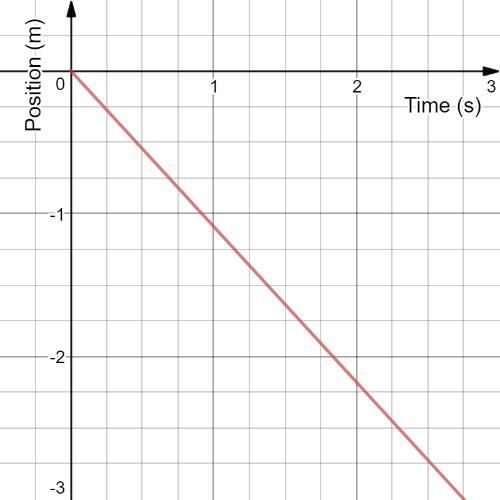
item As the speed is doubled, the slope of the straight line in position-time graph is doubled.
item The graph would have a slope with the same magnitude and negative sign, and the position would be represented on the -ve $y$-axis
– The speed of the bike $v=4.0 , frac{text{m}}{text{s}}$
– The time interval of movement $Delta t=5.0text{ s}$
**Required:**
– The total distance traveled.
We know that the speed of a moving object can be expressed via the distance traveled and the elapsed time interval as:
$$
v = frac{d}{Delta t}
tag{1}
$$
$$
d = v cdot Delta t
tag{2}
$$
$$
begin{align*}
d &= 4.0 , frac{text{m}}{cancel{text{s}}} cdot 5cancel{text{ s}}\
&= boxed{20text{ m}}
end{align*}
$$
d = vt
$$
d = left( 3.00 times 10^{8} m/sright)left( 8.3 minright)left( dfrac{60 s}{1 min}right) = 1.5 times 10^{11} m
$$
– The speed of light $c=3.0 times 10^{8} , frac{text{m}}{text{s}}$
– The time interval of movement $Delta t=8.3text{ min}$
**Required:**
– The total distance traveled.
We know that the speed of a moving object can be expressed via the distance traveled and the elapsed time interval as:
$$
v = frac{d}{Delta t}
tag{1}
$$
The same is true for light $(v=c)$.
$$
d = c cdot Delta t
tag{2}
$$
$$
begin{align*}
Delta t &= 8.3text{ min}\
&= 8.3cancel{text{ min}} cdot 60 , frac{text{s}}{cancel{text{min}}}\
&= boxed{490text{ s}}
end{align*}
$$
$$
begin{align*}
d &= left(3.0 times 10^{8} , frac{text{m}}{cancel{text{s}}} right) cdot left(490cancel{text{ s}} right)\
&= boxed{1.5 times 10^{11}text{ m}}
end{align*}
$$
d = vt
$$
d = left( 55 km/hright)left(0.75 s right)left(dfrac{1000 m}{1 km} right)left( dfrac{1 h}{3600 s}right) = 11 m
$$
– The speed of the car $v=55 , frac{text{km}}{text{h}}$
– The time interval of movement $Delta t=0.75text{ s}$
**Required:**
– The total distance traveled.
We know that the speed of a moving object can be expressed via the distance traveled and the elapsed time interval as:
$$
v = frac{d}{Delta t}
tag{1}
$$
$$
d = v cdot Delta t
tag{2}
$$
$$
begin{align*}
v &= 55 , frac{text{km}}{text{h}}\
&= 55 cdot left(frac{1000text{ m}}{3600text{ s}} right)\
&= boxed{15.28 , frac{text{m}}{text{s}}}
end{align*}
$$
Where we used the fact that $1text{ km}=1000text{ m}$ and $1text{ h}=3600text{ s}$.
$$
begin{align*}
d &= 15.28 , frac{text{m}}{cancel{text{s}}} cdot 0.75cancel{text{ s}}\
&= boxed{11.5text{ m}}
end{align*}
$$
From above equation $t=dfrac{d}{v}$
$t=dfrac{(4.3km)(dfrac{1000m}{1km})}{4.0m/s}$
$t=1075s simeq18min$
textit{color{#c34632} $ 18 $ $min $}
$$
textbf{underline{textit{Solution}}}
$$
Knowing the speed by which each driver travels and the distance traveled we can find how long did it take for each driver to reach its final destination.
Where the total distance traveled by each car is given to be 50 km, and the speed of each car is 95 and 90 km/hr.
And the time of the journey can be calculated using the following equation
$$
t= v/d tag{1}
$$
Thus, we can find the time of the journey of each car using equation (1) and by subtracting we can find how long did the first driver to reach the final destination would have to wait for the other driver.
Thus the time of journey for each car using equation (1) and knowing the speed of each car and the traveled distance is as follows
begin{align*}
intertext{The time of journey of the car going with speed of 95 km/hr}
t_{95} &= 50/95 \
&=0.526 ~ rm{hr}\
&= 31.579 ~ rm{min}
intertext{And, the time of the journey of the car going with speed of 90 km/hr is}
t_{90}&= 50/90\
&= 0.556 ~ rm{hr}\
&= 33.33 ~ rm{min}\
end{align*}
And knowing the time took by each car to reach its final destination we can find the time difference by which the first car have to wait, where the time difference is
begin{align*}
Delta t &= t_{90} – t_{95}\
&= 33.33 – 31.58 \
&= fbox{$1.75 ~ rm{min}$}\
end{align*}
Thus, the first car to arrive have to wait for 1.75 minutes or for 105 seconds before the second car arrives.\
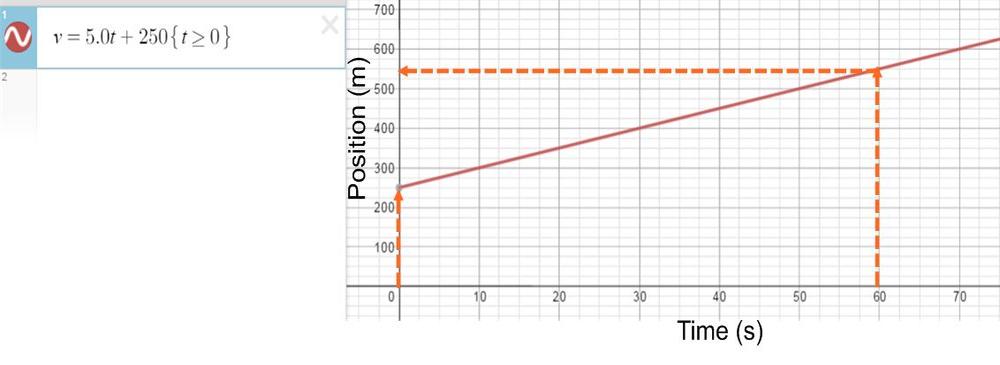
(c) $550m-250m=300m$
textbf{underline{textit{Solution}}}
$$
And checking the given diagram carefully we notice that the points are equidistant which means that the chicken is moving with a constant pace having a uniform speed.\
And we would take the beginning side of the road is the point of origin and moving a distance $Delta x$ every 0.1 seconds such that the following textbf{table} describes the particle diagram
begin{flushleft}
begin{tabular}{|| c ||c | c | c | c | c | c | c | c |}
hline hline
Position $Delta x$ & 0 &1 $Delta x$ & 2 $Delta x$ & 3 $Delta x$ & 4 $Delta x$ & 5 $Delta x$ & 6 $Delta x$ & 7 $Delta x$ \
hline
Time (s)& 0&0.1 & 0.2 &0.3&0.4&0.5&0.6&0.7\
hline hline
end{tabular}
newline
vspace*{1 cm}
newline
begin{tabular}{||c||c| c | c| c| c| c|c|}
hline hline
Position $Delta x$ & 8 $Delta x$ & 9 $Delta x$ & 10 $Delta x$ & 11 $Delta x$ & 12 $Delta x$ & 13 $Delta x$ & 14 $Delta x$ \
hline
Time (s)&0.8& 0.9 & 1.0 &1.1&1.2&1.3&1.4 \
hline hline
end{tabular}
newline
vspace*{1 cm}
newline
begin{tabular}{||c|| c| c| c| c|c|}
hline hline
Position $Delta x$ & 15 $Delta x$ &16$Delta$ & 17$Delta x$ & 18$Delta x$ & 19$Delta x$\
hline
Time (s) &1.5 &1.6& 1.7& 1.8&1.9\
hline hline
end{tabular}
end{flushleft}
$$
y=mx+c
$$
And since the straight line passing through the origin thus the $y$-intercept is $c=0$, and the slope of this line using any 2 points on the given line is given by
$$
m = dfrac{y_2 – y_1}{x_2 -x_1}=dfrac{Delta x}{0.1} = 10 Delta x
$$
Therefor the equation of this straight line is
$$
y = left(10Delta x right) x
$$
$textbf{underline{textit{note:}}}$ we used $Delta x$ as a unit length “the distance between the two consecutive points in the particle diagram”, as the distance between the two points is not given.
the graphs intersect in the interval [1h,1.12h]
$$begin{align*}
v_A&=75 mathrm{km/h}\
v_B&=85 mathrm{km/h} \
t&=2 mathrm{h} \
x&=120 mathrm{km}
end{align*}$$
**Unkonwn values:**
$$begin{align*}
x_{A (2 mathrm{h})}&=? \
x_{B (2 mathrm{h})}&=? \
t_{A (x=120 mathrm{km})}&=? \
t_{B (x=120 mathrm{km})}&=?
end{align*}$$
$$begin{align*}
v&=dfrac{x}{t} rightarrow x=vcdot t\
x_{A (t=2 mathrm{h})}&=v_A cdot t \
&=75 mathrm{km/h} cdot 2mathrm{h} \
&=150 mathrm{km}\
\
x_{B (t=2 mathrm{h})}&=v_A cdot t \
&=85 mathrm{km/h} cdot 2mathrm{h} \
&=170 mathrm{km}
end{align*}$$
Calculating the time it takes an individual car to pass a gas station is simply calculating the time it takes to travel $120 mathrm{km}$:
$$begin{align*}
t&=dfrac{x}{v} \
t_{A (x=120 mathrm{km})}&=dfrac{x}{v_A} \
&=dfrac{120 mathrm{km}}{75 mathrm{km/h}} \
&=1.6 mathrm{h}=1 mathrm{h} 36 mathrm{min} \
\
t_{B (x=120 mathrm{km})}&=dfrac{x}{v_A} \
&=dfrac{120 mathrm{km}}{85 mathrm{km/h}} \
&=1.4 mathrm{h}=1 mathrm{h} 24 mathrm{min}
end{align*}$$

It is important to note that cars drive at a constant speed which means that the $x-t$ graph will be linear.
**Conclusion.**
$$begin{align*}
x_{A (t=2 mathrm{h})}&=150 mathrm{km} \
x_{B(t=2 mathrm{h})}&=170 mathrm{km} \
t_{A (x=120 mathrm{km})}&=1.6 mathrm{h} \
t_{B (x=120 mathrm{km})}&=1.4 mathrm{h}
end{align*}$$
$$
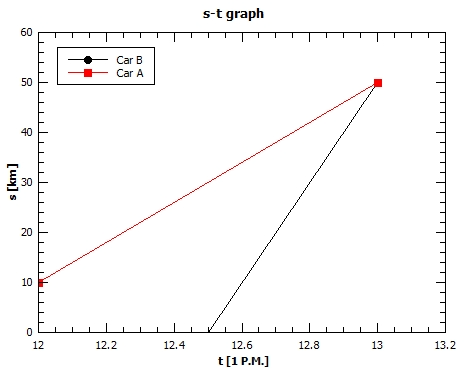
begin{align*}
s_1&= 50 mathrm {km} tag{school to beach} \
s_2&= s_1 – 10 mathrm{km} = 40 mathrm{km} tag{store to beach} \
t_A&= 12:00 mathrm{P.M.} tag{departure time of A} \
t_B&= 12:30 mathrm{P.M.} tag{departure time of B} \
v_A&=40 mathrm{km/h} \
v_B&= 100 mathrm{km/h}
end{align*}
$$
Unknown:
$$
begin{align*}
t’_A&=? tag{time of arrival of A} \
t’_B&=? tag{time of arrival of B} \
Delta t&=? tag{travel time}
end{align*}
$$
$$
begin{align*}
Delta t&=t+t’
end{align*}
$$
Travel time is thus obtained by dividing the path by the speed:
$$
begin{align*}
Delta t&=dfrac{s}{v} \
Delta t_A&=dfrac{s_2}{v_A} \
&=dfrac{40 mathrm{km}}{40 mathrm{km/h}} \
&=1 mathrm{h} \
\
Delta t_B&=dfrac{s_a}{v_B} \
&=dfrac{50 mathrm{km}}{100 mathrm{km/h}} \
&=0.5 mathrm{h}=30 mathrm{min} \
\
t’_A&=t_A+Delta t_A \
&=12:00 mathrm{P.M} + 1 mathrm{h} \
&=13:00 mathrm{P.M.} \
\
t’_B&=t_B+Delta t_B \
&=12:30 mathrm{P.M} + 30 mathrm{min} \
&=13:00 mathrm{P.M.} \
end{align*}
$$
textbf{underline{textit{Solution}}}
$$
As we are to plot a position-time graph where we are the position is plotted on $y$-axis and the time on $x$-axis thus the slope is given $m=dfrac{Delta y}{Delta x}=dfrac{text{Distance traveled}}{text{Time interval}}$
Which represents the speed of the car thus the slope of the line is equal to the speed of car.
Hence for car a A a line is drawn to represent the motion of the car, Since it is given that the car starts at position 48 km from the origin and with a speed of 36 km/s, therefor we draw a line where it starts from point 48 on the $y$-axis and the slope of the drawn line will be 36 km/s.
For Car B since it is given that car starts it is journey after 0.5 hr and with a speed of 48 km/s, hence a line would be drawn to start from point 0.5 on the $x$-axis and the slope of the drawn line will be 48 km/s.
The following $textbf{graph}$ represents the motion of car A and B.
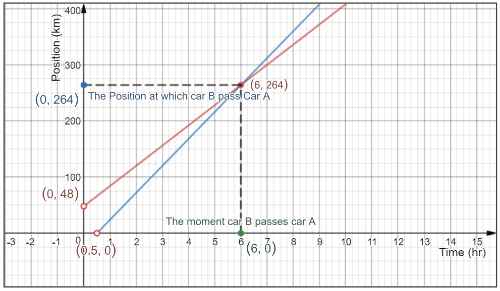
The point of intersection is co-ordination is $left( 6,264right)$ which means the car B will out run car A after 6 hrs and at a position 264 km, at this point the car A would have traveled a distance 216 km from the beginning of its journey “reference point 48 km”. \
Thus, the answer for the questions from the graph will be:
begin{enumerate}[bfseries (a)]
item 6 hours.
item 264 km.
item 216 km.
end{enumerate}
textbf{underline{textit{note:}}} All the points are obtained from the given graph.
The general equation for any straight line is given by
$y = mx+c$
Where, $m$ represents the slope “speed” of the car and $c$ is the $y$-intercept of the line.
For car A, the line have a slope of 36 km/s and starts from point $left( 0,48right)$ on the $y$-axis, therefor the equation for the straight line that represents the motion of car A is
$$
y_A = 36 x_A + 48
$$
It is more tricky to find the equation of straight line for car B, if we written the equation in terms of car B is position and time then we would get something like this,
$$
y_B = 48 x_Btag{2}
$$
This equation simply means that we have different $x$-axis origins for both cars, and we can’t have 2 different co-ordinates thus we need to express the equation of car B in terms of $x_A$ and as car A had a head start of 0.5 hr thus the equation of car B is
$$
y_b = 48 left(x_A -0.5 right) tag{3}
$$
For car B to pass car A it means that although car A had a head start of 48 km, but as the car B is faster than car A then there is a moment where car B would pass car, at this specific point “textbf{underline{Both car are at the same position}}” which means that both $y_A$ and $y_B$ are equal.\
Thus, we have
begin{align*}
y_A &= y_B \
intertext{Substituting by equation (1) and equation (3), solving we for $x_A$ we get}
36 x_A + 48 &= 48left(x_A-0.5 right) \
36 x_A + 48 &= 48 x_A -24\
12 x_A &= 72\
x_A &= 6 hrs.
end{align*}
Thus car B passes car A when the time was 6 hrs, substituting by the value of $x_A$ in equation (1) or (5) we can find the position at which the car was after 6 hrs, substituting gives 264 km, thus we have the same answers obtained graphically as before.
item 6 hrs.
item 264 km
item 216 km.
textbf{underline{textit{Solution}}}
$$
item ~\ From the position-time graph:
textbf{underline{textit{Section I and II:}}} for time interval of nearly 7.5 seconds, Jim moved forward in the aisle cutting a distance of 6 meters, and he stopped for time interval approximately 17.5 seconds.\
textbf{underline{textit{Section III and IV:}}} after then he kept moving for more 12.5 seconds cutting a further distance of 6 m more in the aisle, and then he stopped again for nearly a 5 seconds.\
textbf{underline{textit{Section V and VI:}}} and then he moved back toward the initial position getting back to 3 m from the initial position in time interval of 9 seconds and stopped for 5 seconds.\
textbf{underline{textit{Section VII and VIII:}}} and then he moved into the aisle again to a position 6 m in time interval of 2 seconds stopped for 3 seconds.\
textbf{underline{textit{Section IX:}}} and then he went to the initial position at the beginning of the aisle in 5 seconds.
enumerate[bfseries (b)]
item ~From the graph:\
noindent
{color{white} rule{linewidth}{0.5mm} }
Jim had a position of 6 m at:
itemize
item time interval [7.5,25] seconds.
item time 43 seconds
item time interval [52.5, 56] seconds
item ~ From the graph:\
noindent
{color{white} rule{linewidth}{0.5mm} }
The first moment Jim reached the position of 12 m inside the aisle is 32.5 seconds after the beginning of his journey thus it took him 32.5 seconds.\
Between 37 seconds and 46 seconds “a 9 seconds interval” he cut a distance of 9 m, thus his average velocity is
[ dfrac{text{Change in position}}{text{Time interval}} = dfrac{-1}{1}=-1 ~ rm{m/s}]
Thus his average velocity during this time interval is -1 m/s or 1 m/s in the direction toward the beginning of the aisle.
item See description.
item at time interval [7.5,25] , 43 and time interval [52.5,56] seconds.
item -1 m/s or 1 m/s toward the beginning of the aisle.
textbf{underline{textit{Solution}}}
$$
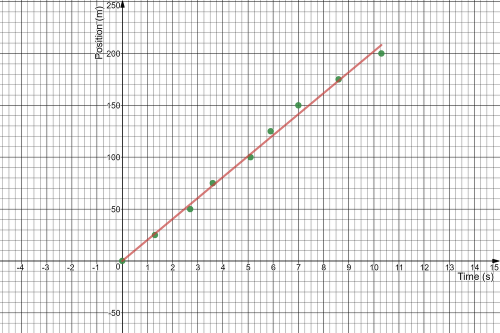
As we plot the position on $y$-axis and the time on $x$-axis we find that the slope of this line represents the speed of the car, where the slope of this line is given by the ratio between the change in the position “rise” and the change in the time “run” as follows
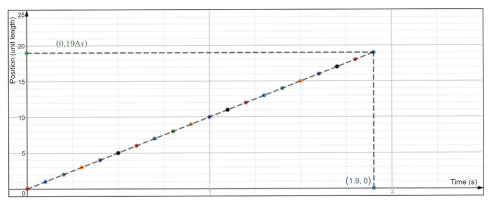
$m= dfrac{y_2 – y_1}{x_2 – x_1}tag{1}$ where $left(x_1,y_1 right)$ and $left(x_2,y_2 right)$ are points on the best fit line, by taking any 2 points on the best fit line and using equation (1) “if drawn by hand” or using graph calculator we find that the slope of this line is 20.20, thus the equation of this line is
$y=20.2 x$
Thus the speed of the car is $fbox{20.2 m/s}$.
textbf{underline{textit{Solution}}}
$$
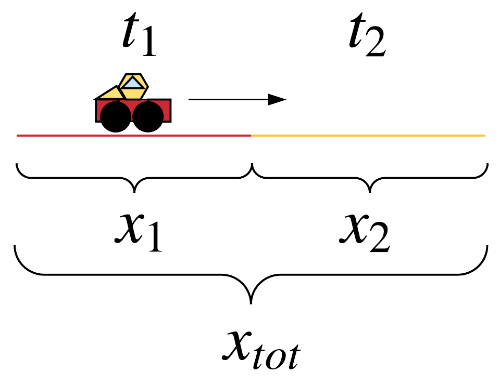
It is given that the car traveled an average of 48 km/hr in the first half of the total journey distance, and it is required to know what should the car speed in the second half of the journey distance in order to achieve an average speed of 90 km/hr.
The situation is described using the following $textbf{diagram}$, where $x_1=x_2$ and $t_1$ is the time interval the car took to cut the first half of the journey distance $x_1$ and $t_2$ is the time interval the car took to cut the second half of the journey distance $x_2$, where the total distance is $x_{tot} = x_1 + x_2$ and the total time interval is $t_{tot} = t_1 + t_2$
Since it is given that the car has an average speed of 48 during the first half of the journey, which means
$$
dfrac{x_1}{t_1}= 48 ~ rm{km/hr} tag{1}
$$
And it is required to find the speed by which the car should go in the second half of the journey, i.e.
$$
dfrac{x_2}{t_2} = ~ ??
$$
In order to maintain a total trip average speed of 90 km/hr,i.e.
$$
dfrac{x_{tot}}{t_{tot}}= dfrac{x_1+x_2}{t_1+t_2} =90 ~ rm{km/hr}tag{2}
$$
And since $x_1 = x_2$ thus equation (2) becomes
$$
dfrac{2x_1}{left( t_{1}+t_2right)} = 90 tag{3}
$$
And from equation (1), we get that
$x_1 = 48 t_1 tag{4}$
Substituting equation (4) in equation (3), we get
$$
begin{align*}
dfrac{96 t_1}{t_1 + t_2} &= 90\
96 t_1 &= 90t_1 + 90t_2\
t_2 &= dfrac{1}{15} ~ t_1
end{align*}
$$
Which basically means that the car should cut the remaining distance 15 times faster than what it took to cut through the first half, i.e.
$$
begin{align*}
dfrac{x_2}{t_2}&= dfrac{x_1}{t_2}\
&=15 ~ dfrac{x_1}{t_1}\
&= 15times 48\
&= fbox{$720 ~ rm{km/hr}$} \
end{align*}
$$
For a car this speed is not reasonable !!
textbf{underline{textit{solution}}}
$$
$$
m = dfrac{y_2-y_1}{x_2-x_1} tag{1}
$$
Using equation (1) to find the slope of the horizontal line, we will find that the slope of such lines is zero which means that the speed of such objects is zero, thus it is normal to find such lines on a position-time graph.
For a Vertical line in a position-time graph, it would means that the object would have a different position at the same moment. which would be very unreasonable to our daily life observation.
In terms of slope calculation using the limit as x approaches zero from the right in equation (1), where
$$
m =lim_{Delta x to 0^{+}} dfrac{Delta y}{Delta x} = infty
$$
Which means, such objects that would have a vertical line is an object having an infinite speed which is not possible, as the maximum universal speed is the speed of the light.
$textbf{underline{textit{note:}}}$ We took the limit of the slope as $Delta x$ approaches zero is because we can’t simply say that $1/0$ is infinity it is undefined in the sense that there is no unique value of $x$ that would give such result, i.e. we wouldn’t be able to differentiate between the followings
$$
dfrac{1}{1-1} = dfrac{1}{2-2} =… =dfrac{1}{x-x}=dfrac{1}{0}
$$
Moreover, we have to define whether $Delta x$ approaches zero from the right or the left, i.e. whether “it is a negative and approaching zero” or whether “it a positive and approaching a zero”, as the first is $-infty$ and the later is $+infty$.
of thousands of miles
B.) 9270 milliseconds = 9.27 seconds
D.) 12.3 ks= 12,300 Seconds
– $t_{text{a}}=58text{ ns}$
– $t_{text{b}}=0.046text{ Gs}$
– $t_{text{c}}=9270text{ ms}$
– $t_{text{d}}=12.3text{ ks}$
Using $1text{ ns}=1 times 10^{-9}text{ s}$ we get:
$$
begin{align*}
t_{text{a}} &= 58text{ ns}\
&= 58 times 10^{-9}text{ s}\
&= boxed{5.8 times 10^{-8}text{ s}}
end{align*}
$$
Using $1text{ Gs}=1 times 10^{9}text{ s}$ we get:
$$
begin{align*}
t_{text{b}} &= 0.046text{ Gs}\
&= 0.046 times 10^{9}text{ s}\
&= boxed{46 times 10^{6}text{ s}}
end{align*}
$$
Using $1text{ ms}=1 times 10^{-3}text{ s}$ we get:
$$
begin{align*}
t_{text{c}} &= 9270text{ ms}\
&= 9270 times 10^{-3}text{ s}\
&= boxed{9.27text{ s}}
end{align*}
$$
Using $1text{ ks}=1 times 10^{3}text{ s}$ we get:
$$
begin{align*}
t_{text{d}} &= 12.3text{ ks}\
&= 12.3 times 10^{3}text{ s}\
&= boxed{12,300text{ s}}
end{align*}
$$
$t_{text{b}}=46 times 10^{6}text{ s}$
$t_{text{c}}=9.27text{ s}$
$t_{text{d}}=12,300text{ s}$
To add or subtract measurements, first perform the operation, then
round off the result to correspond to the least-precise value involved.
Here, it is one tenth (second value, 2.1)
Answer: 7.4 mm
To multiply or divide measurements, perform the calculation and then round to the same number of significant digits as the least-precise measurement.
(b)
3.65 has three significant digits, so
$49.6 m^2$
(c)
83.2 has three significant digits, so
70.4 kg
$49.6 m^2$
70.4 kg
