All Solutions
Section 6-1: Periodic Functions and Their Properties
$$
{ f(x) in bold{R};|;2leq f(x)leq 10}
$$
Therefore, the equation of axis is
$y=dfrac{10+2}{2}$
$$
y=6
$$
$$
y=dfrac{f(x)_{max}+f(x)_{min}}{2}
$$
$A=dfrac{10-2}{2}$
$$
A=4
$$
$$
A=dfrac{f(x)_{max}-f(x)_{min}}{2}
$$
$period=1.95-0.95=1$ s
$$
{ d in bold{R};|0;leq d;leq 1.5}
$$
period = $1$ s
$t = dfrac{5; cycles}{1; s ;per; cycle}=5$ s
$t=dfrac{k}{period}$.
$f(x)_{min}=0$
$y=dfrac{1.5+0}{2}$
$y=0.75$ cm
$$
y=dfrac{f(x)_{max}+f(x)_{min}}{2}
$$
$A=dfrac{1.5-0}{2}$
$A=0.75$ cm
$$
A=dfrac{f(x)_{max}-f(x)_{min}}{2}
$$
b.) $d_{max}=1.5$ cm
c.) ${ d in bold{R};|;0;leq d;leq 1.5}$
d.) $t=5$ s
e.) $y=0.75;cm$
f.) $A=0.75;cm$
constant interval.
constant interval.
constant interval.
constant interval.
constant interval.
constant interval.
constant interval since the teeth are evenly spaced.
constant interval since we assume that he his jumping at a constant and consistent pattern
constant interval since the cost vary from individual to individual.
constant interval since the graph will constantly be increasing at a steady rate and doesn’t go back to an equilibrium position.
constant interval since the balls bounce height will decrease with each subsequent bounce.
constant interval since it rotates at a constant speed.
constant interval due to the y-values repeating in a pattern.
constant interval due to the y-values repeating in a pattern.
constant interval since the y-values to not repeat in a pattern.
constant interval due to the y-values repeating in a pattern.
(b) Periodic
(c) Not Periodic
(d) Not Periodic
$$
{ d in bold{R};|;4leq dleq10 }
$$
.
$t=6+8n$ where $n = 0,1,2,3..$
To do this, we need to find the number of complete cycles that has elapsed at 62 minutes, and restart the pattern from there.
$period=8-0=8$ s
$f(x)_{min}=1$
$h=dfrac{7+1}{2}$
$h=4$ m
$$
y=dfrac{f(x)_{max}+f(x)_{min}}{2}
$$
$A=dfrac{7-1}{2}$
$A=3$ m
$$
A=dfrac{f(x)_{max}-f(x)_{min}}{2}
$$
$$
{ h in bold{R};|1;leq h;leq 7}
$$
$x = 4+8n$ where $n=0,1,2,3..$
b.) $h=4$ m
c.) A = 3m
d.) ${ h in bold{R};|1;leq h;leq 7}$
e.) 32 s
f.) $x = 4+8n$ where $n=0,1,2,3..$
g.) 4 m
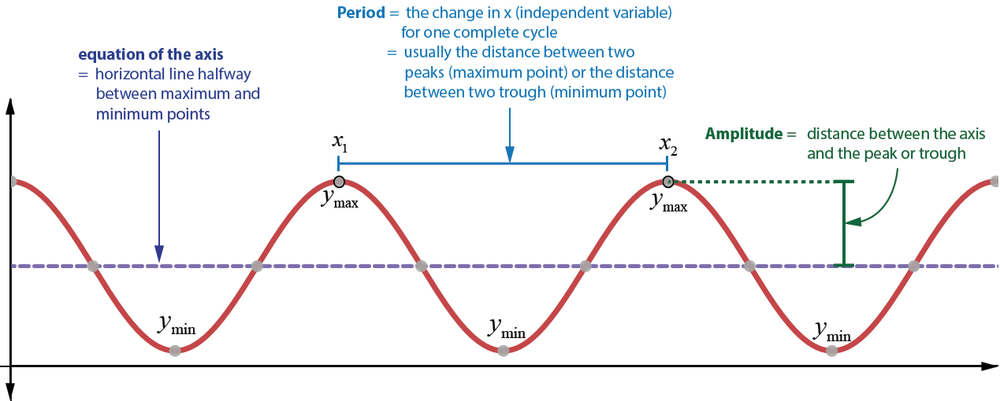
{mathbf{Useful}}{text{ }}{mathbf{Definitions}} hfill \
{text{equation of the axis: }},,y = frac{{{y_{max }} + {y_{min }}}}{2} hfill \
{text{amplitude: }}A = {text{ }}frac{{left| {{y_{max }} – {y_{min }}} right|}}{2} hfill \
{text{period}} : T= left| {{x_2} – {x_1}} right| hfill \
end{gathered} ]

{mathbf{Useful}}{text{ }}{mathbf{Definitions}} hfill \
{text{equation of the axis: }},,y = frac{{{y_{max }} + {y_{min }}}}{2} hfill \
{text{amplitude: }}A = {text{ }}frac{{left| {{y_{max }} – {y_{min }}} right|}}{2} hfill \
{text{period}} : T= left| {{x_2} – {x_1}} right| hfill \
end{gathered} ]

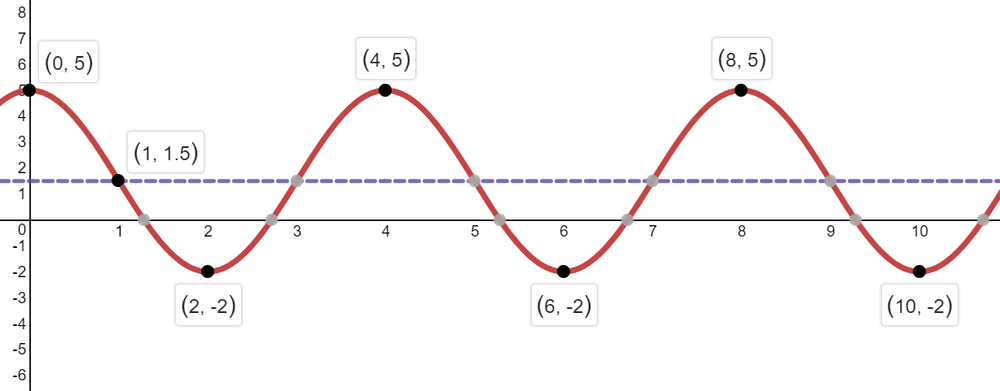
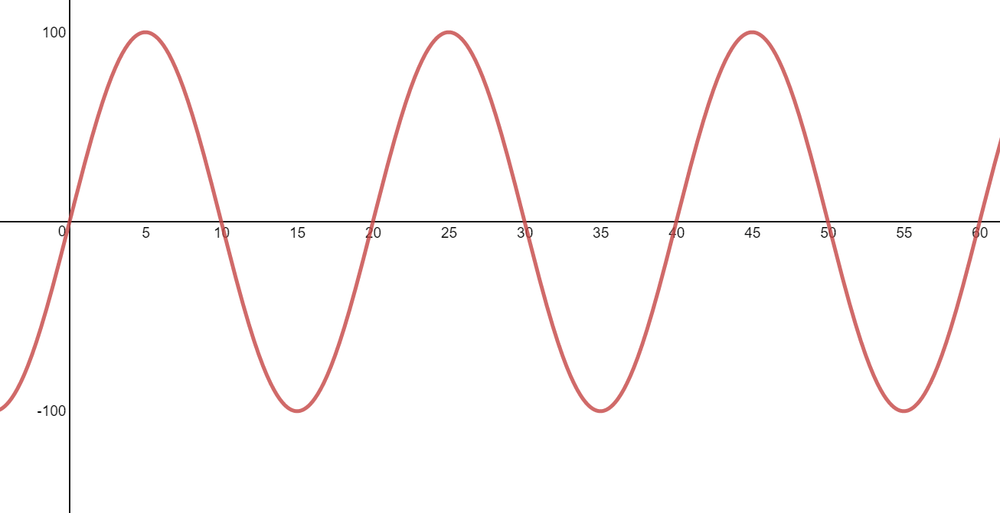
The amplitude is $A=dfrac{5-(-2)}{2}=3.5$
The equation of axis is $y=dfrac{5+(-2)}{2}=dfrac{3}{2}$
Therefore, the graph must be something like this.
{mathbf{Useful}}{text{ }}{mathbf{Definitions}} hfill \
{text{equation of the axis: }},,y = frac{{{y_{max }} + {y_{min }}}}{2} hfill \
{text{amplitude: }}A = {text{ }}frac{{left| {{y_{max }} – {y_{min }}} right|}}{2} hfill \
{text{period}} : T= left| {{x_2} – {x_1}} right| hfill \
end{gathered} ]

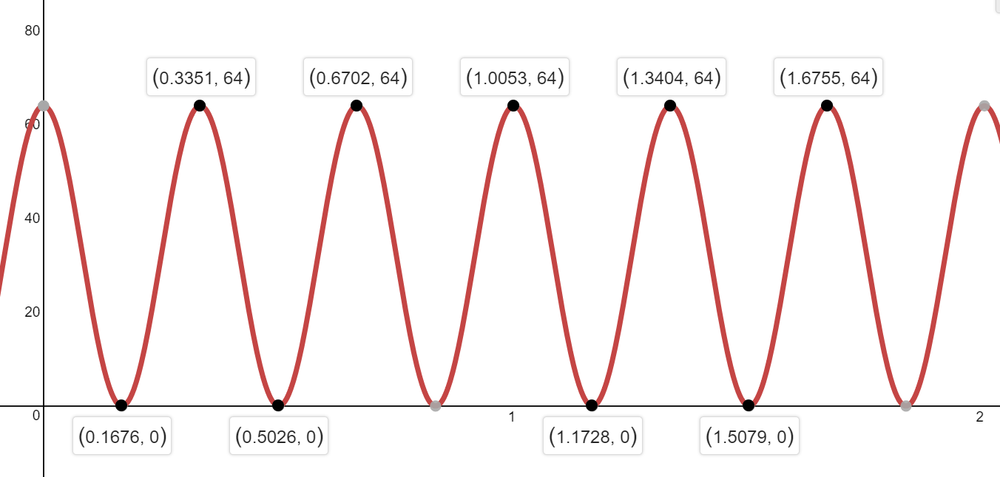
{text{wheel diameter = 64 cm}} hfill \
{text{speed = 21}}{text{.6 km/h}} hfill \
hfill \
{text{To be able to graph the height above the ground}} hfill \
{text{with respect to time, we must know the period }}T, hfill \
{text{minimum height and maximum height}}{text{. }} hfill \
{text{The minimum height is zero (at the ground) while}} hfill \
{text{the maximum height is the diameter of the wheel (64 cm)}}{text{.}} hfill \
hfill \
{text{To determine the period, we must know how long it takes}} hfill \
{text{to complete one cycle}}{text{. One cycle corresponds to }} hfill \
{text{one complete revolution}}{text{. The distance travelled per}} hfill \
{text{revolution is just the circumference of the wheel }} hfill \
hfill \
C = pi d = pi cdot 64{text{ cm}} = 201.06{text{ cm per cycle}} hfill \
hfill \
{text{The period is the time for one complete cycle}}{text{.}} hfill \
{text{Remember that }} hfill \
{text{distance = speed}} times {text{time}} hfill \
Rightarrow {text{ period = time per cycle = }}frac{{{text{distance per cycle}}}}{{{text{speed}}}} hfill \
hfill \
{text{We shall convert the speed to cm/s to make}} hfill \
{text{the units consistent}} hfill \
{text{21}}{text{.6}}frac{{{text{km}}}}{{text{h}}} cdot left( {frac{{1000{text{ m}}}}{{1{text{ km}}}}} right) cdot left( {frac{{100{text{ cm}}}}{{1{text{ m}}}}} right)left( {frac{{1{text{ h}}}}{{3600{text{ s}}}}} right) = 600{text{ cm/s}} hfill \
hfill \
{text{We can know calculate the period as}} hfill \
{text{ time per cycle = }}frac{{{text{ }}201.06{text{ cm }}}}{{600{text{ cm/s}}}} = 0.335{text{1}};{text{s}} hfill \
{text{With}} hfill \
T = 0.3351 hfill \
{y_{min }} = 0 hfill \
{y_{max }} = 64{text{ cm}} hfill \
{text{The graph for 2 seconds interval can be sketched as follows}} hfill \
hfill \
hfill \
hfill \
hfill \
hfill \
hfill \
end{gathered} ]
{mathbf{Useful}}{text{ }}{mathbf{Definitions}} hfill \
{text{equation of the axis: }},,y = frac{{{y_{max }} + {y_{min }}}}{2} hfill \
{text{amplitude: }}A = {text{ }}frac{{left| {{y_{max }} – {y_{min }}} right|}}{2} hfill \
{text{period}} : T= left| {{x_2} – {x_1}} right| hfill \
end{gathered} ]
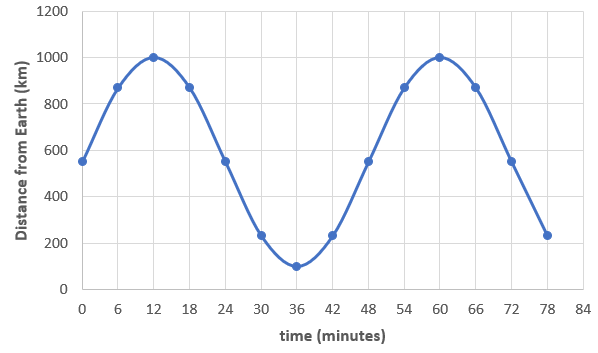
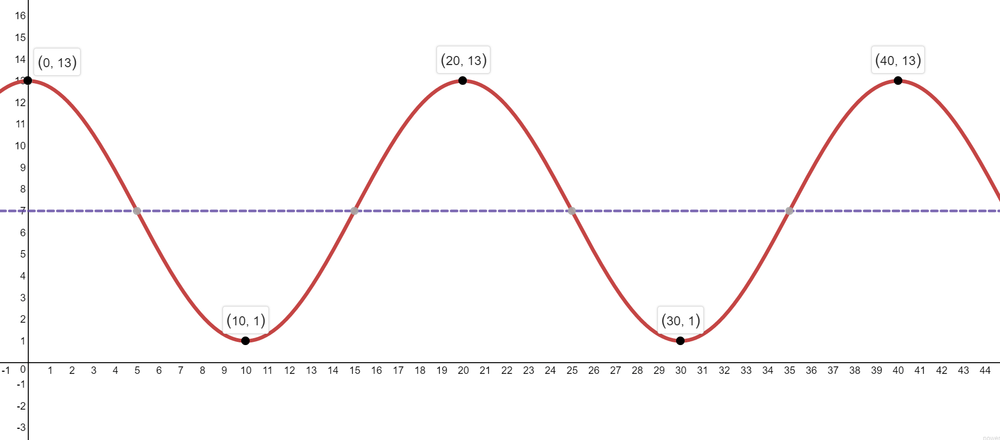
period: $T=60-12=48$
The period represents the time for one complete revolution of the spacecraft around the Earth.
$t=12+48n,;;$ where $n=0,1,2,3…$
Therefore, the domain is
${tin bf{R}$ $| ;;0leq tleq 288}$
b) periodic graph
c) period = 48 min
d) roughly 900 km
e) $t=12+48n$ where $n=0,1,2,3…$
f) ${tin bf{R}$ $| ;;0leq tleq 288}$
{mathbf{Useful}}{text{ }}{mathbf{Definitions}} hfill \
{text{equation of the axis: }},,y = frac{{{y_{max }} + {y_{min }}}}{2} hfill \
{text{amplitude: }}A = {text{ }}frac{{left| {{y_{max }} – {y_{min }}} right|}}{2} hfill \
{text{period}} = left| {{x_2} – {x_1}} right| hfill \
end{gathered} ]

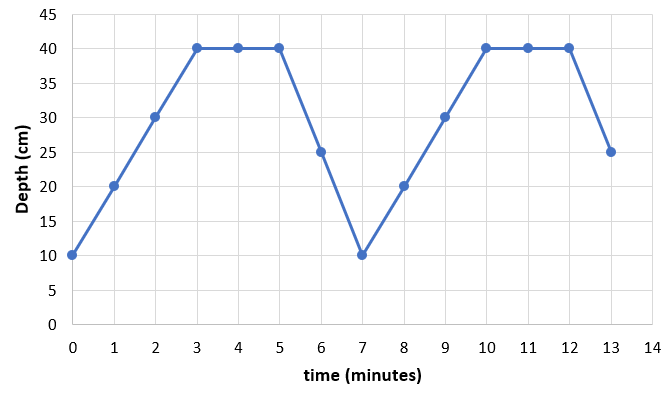
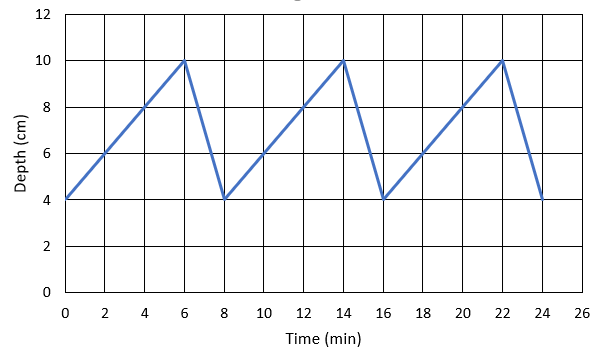
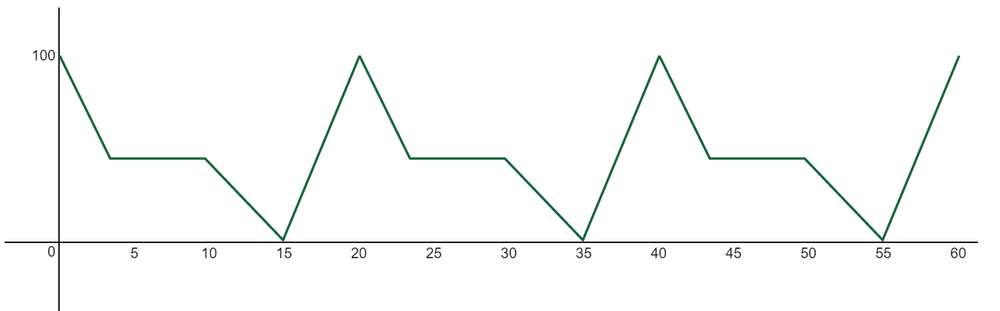
$y_{min}=10$ , $y_{max}=40$
For obtaining the period, since there are several peaks, we shall consider the trough. The distance between two trough (minimum point) is 7 minutes. Thus, the period is 7 minutes.
The equation of the axis is $y=dfrac{10+40}{2}implies y=25$
The amplitude is $A=dfrac{|40-10|}{2}=15$
$$
r=dfrac{40-10}{3-0}=10 text{cm/min}
$$
$r=dfrac{10-40}{7-5}=-15 text{cm/min}$
The negative sign indicates that the depth is decreasing, so the actual rate is simply $15$ cm/min.
b) periodic
c) $T=7$ , $y=25$ , $A=15$
d) 10 cm/min
e) 15 cm/min
f) No
Here are some examples of periodic functions.
Also, any vertical line touches the graph only once.
The plot can be sketched as follows.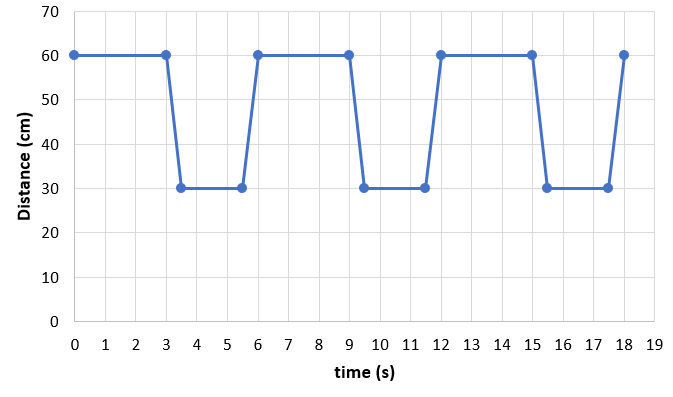
${dinbf{R;}$ $|;;30leq dleq 60}$
Since Denis repeats this 3 times, the maximum $t$ is $6times 3=18$ s, Therefore
$$
{ tin bold{R};|;0leq tleq 18}
$$
b) 6 seconds
c) range: ${dinbf{R;}$ $|;;30leq dleq 60}$
domain: ${ tin bold{R};|;0leq tleq 18}$
