All Solutions
Page 398: Check Your Understanding
{text{For a sinusoidal function, remember the following }} hfill \
hfill \
y = Acos left[ {kleft( {x – d} right)} right] + c{text{ }} hfill \
{text{or }} hfill \
y = Asin left[ {kleft( {x – d} right)} right] + c{text{ }} hfill \
hfill \
{text{amplitude = }}|A| = dfrac{|y_{text{max}}-y_{text{min}}|}{2}hfill \
{text{period = }}T=frac{{{{360}^ circ }}}{|k|} hfill \
{text{equation of axis:}}{text{ }},,,y = c = dfrac{y_{text{max}}+y_{text{min}}}{2} hfill \
hfill \
{text{Generally, if the maximum point is translated $d$ units to the right of the}}hfill \\
{text{$y$-axis, the equation is $y=Acos[k(x-d)^circ]+c$}}hfill \\
{text{If the minimum point is translated $d$ units to the right of the}}hfill \\
{text{$y$-axis, the equation is $y=-Acos[k(x-d)^circ]+c$}}hfill \\
{text{Note that multiple possible sinusoidal functions can describe a graph or data}}hfill \
end{gathered} ]
period = $2 implies k =dfrac{360}{2}=180$ s
amplitude : $A=dfrac{|2-1|}{2}=0.5$
axis : $c=dfrac{2+1}{2}=1.5$
Therefore, the equation describing the graph is
$$
f(t)=0.5cos[180(t-0.5)]+1.5
$$
b) The amplitude is 0.5 which represents the length of the cable where the load is attached to swing.
c) The period is 180 s which represents the time it takes for one complete swing (back and forth)
d) The equation is $f(t)=0.5cos[180(t-0.5)]+1.5$
e) Based on the graph, the domain (set of all possible values of $t$) and range (set of all possible values of $f(t)$) are
domain: ${ t in bold{R};|;0leq t leq 4 }$
range: ${ f(t) in bold{R};|;1leq f(t) leq 2}$
f) We can evaluate $f(3.2)$ as $y=0.5cos[180(3.2-0.5)]+1.5=1.2$ m
b) $A=0.5$
c) $180$ s
d) $f(t)=0.5cos[180(t-0.5)]+1.5$
e) domain: ${ t in bold{R};|;0leq t leq 4 }$ ; range: ${ f(t) in bold{R};|;1leq f(t) leq 2}$
f) $1.2$ m
{text{For a sinusoidal function, remember the following }} hfill \
hfill \
y = Acos left[ {kleft( {x – d} right)} right] + c{text{ }} hfill \
{text{or }} hfill \
y = Asin left[ {kleft( {x – d} right)} right] + c{text{ }} hfill \
hfill \
{text{amplitude = }}|A| = dfrac{|y_{text{max}}-y_{text{min}}|}{2}hfill \
{text{period = }}T=frac{{{{360}^ circ }}}{|k|} hfill \
{text{equation of axis:}}{text{ }},,,y = c = dfrac{y_{text{max}}+y_{text{min}}}{2} hfill \
hfill \
{text{Generally, if the maximum point is translated $d$ units to the right of the}}hfill \\
{text{$y$-axis, the equation is $y=Acos[k(x-d)^circ]+c$}}hfill \\
{text{If the minimum point is translated $d$ units to the right of the}}hfill \\
{text{$y$-axis, the equation is $y=-Acos[k(x-d)^circ]+c$}}hfill \\
{text{Note that multiple possible sinusoidal functions can describe a graph or data}}hfill \
end{gathered} ]
This represents the distance of the center of windmill from the ground.
b) amplitude: $A=dfrac{|y_{max}-y_{min}|}{2}=dfrac{17-3}{2}=7$
This represents the radius of the windmill.
c) period: $T=20$ s $implies k=dfrac{360}{20}=18$
The period (20 s) is the time it takes for one complete revolution of the windmill.
d) seven cycles take $7times 20=140$ s, thus,
domain: ${ t in bold{R};|; 0leq tleq 140}$
possible values of $f(t)$ is from $y_{min}$ to $y_{max}$, thus,
range: ${ f(t) in bold{R};|;3 leq f(t) leq 17}$
e) From the given graph, the minimum point is exactly at the $y$-axis, thus we shall use the form
$y=-Acos(kx)+c$
$f(t)=-7cos(18t)^circ+10$
f) If the wind speed is decreased, the windmill will turn slowly, thus it takes more time for one complete revolution. Thus, the period will increase resulting in horizontal stretching of the graph. The amplitude and axis will not be affected.
b) $A=7$
c) $T=18$
d) domain: ${ t in bold{R};|; 0leq tleq 140}$ ; range: ${ f(t) in bold{R};|;3 leq f(t) leq 17}$
e) $f(t)=-7cos(18t)^circ+10$
f) horizontal stretching
{text{For a sinusoidal function, remember the following }} hfill \
hfill \
y = Acos left[ {kleft( {x – d} right)} right] + c{text{ }} hfill \
{text{or }} hfill \
y = Asin left[ {kleft( {x – d} right)} right] + c{text{ }} hfill \
hfill \
{text{amplitude = }}|A| = dfrac{|y_{text{max}}-y_{text{min}}|}{2}hfill \
{text{period = }}T=frac{{{{360}^ circ }}}{|k|} hfill \
{text{equation of axis:}}{text{ }},,,y = c = dfrac{y_{text{max}}+y_{text{min}}}{2} hfill \
hfill \
{text{Generally, if the maximum point is translated $d$ units to the right of the}}hfill \\
{text{$y$-axis, the equation is $y=Acos[k(x-d)^circ]+c$}}hfill \\
{text{If the minimum point is translated $d$ units to the right of the}}hfill \\
{text{$y$-axis, the equation is $y=-Acos[k(x-d)^circ]+c$}}hfill \\
{text{Note that multiple possible sinusoidal functions can describe a graph or data}}hfill \
end{gathered} ]
$y_{text{max}}=12$ and $y_{text{min}}=4$
Maximum occurs at $t=1$ and minimum occurs at $t=3$, thus we expect it goes back to maximum at $t=5$.
The period is therefore, $5-1=4$ s which implies $k=dfrac{360}{4}=90$
The equation of axis is: $y=c=dfrac{12+4}{2}=8$
The amplitude is $A=dfrac{|12-4|}{2}=4$
The maximum is translated $1$ unit from the $y$-axis, thus we shall use cosine with $A>0$ and $d=1$
The equation describing Chantelle’s distance from the vertical beam $y$ as a function of time $t$ is
$$
y=4cos[90(t-1)^circ]+8
$$
y=4cos[90(t-1)^circ]+8
$$
{text{For a sinusoidal function, remember the following }} hfill \
hfill \
y = Acos left[ {kleft( {x – d} right)} right] + c{text{ }} hfill \
{text{or }} hfill \
y = Asin left[ {kleft( {x – d} right)} right] + c{text{ }} hfill \
hfill \
{text{amplitude = }}|A| = dfrac{|y_{text{max}}-y_{text{min}}|}{2}hfill \
{text{period = }}T=frac{{{{360}^ circ }}}{|k|} hfill \
{text{equation of axis:}}{text{ }},,,y = c = dfrac{y_{text{max}}+y_{text{min}}}{2} hfill \
hfill \
{text{Generally, if the maximum point is translated $d$ units to the right of the}}hfill \\
{text{$y$-axis, the equation is $y=Acos[k(x-d)^circ]+c$}}hfill \\
{text{If the minimum point is translated $d$ units to the right of the}}hfill \\
{text{$y$-axis, the equation is $y=-Acos[k(x-d)^circ]+c$}}hfill \\
{text{Note that multiple possible sinusoidal functions can describe a graph or data}}hfill \
end{gathered} ]
Range is the set of values from $T_{min}$ to $T_{max}$
interior: ${ T in bold{R};|;15leq T leq 20}$
exterior: ${ T in bold{R};|; -30 leq T leq -10}$
interior:
amplitude: $A=dfrac{|20-15|}{2}=2.5$
axis: $c=dfrac{20+15}{2}=17.5$
exterior:
amplitude: $A=dfrac{|-10-(-30)|}{2}=10$
axis: $c=dfrac{-10-30}{2}=-20$
Both functions has a minimum point that is located on the $y$-axis, thus, we shall use cosine function with $A<0$ and $d=0$ which can be written in the form $y=-Acos(kx)+c$
interior: $y=-2.5cos(15t)+17.5$
exterior: $y=-10cos(15t)-20$
b) interior: ${ T in bold{R};|;15leq T leq 20}$
exterior: ${ T in bold{R};|; -30 leq T leq -10}$
c) interior: $y=-2.5cos(15t)+17.5$
exterior: $y=-10cos(15t)-20$
{text{For a sinusoidal function, remember the following }} hfill \
hfill \
y = Acos left[ {kleft( {x – d} right)} right] + c{text{ }} hfill \
{text{or }} hfill \
y = Asin left[ {kleft( {x – d} right)} right] + c{text{ }} hfill \
hfill \
{text{amplitude = }}|A| = dfrac{|y_{text{max}}-y_{text{min}}|}{2}hfill \
{text{period = }}T=frac{{{{360}^ circ }}}{|k|} hfill \
{text{equation of axis:}}{text{ }},,,y = c = dfrac{y_{text{max}}+y_{text{min}}}{2} hfill \
hfill \
{text{Generally, if the maximum point is translated $d$ units to the right of the}}hfill \\
{text{$y$-axis, the equation is $y=Acos[k(x-d)^circ]+c$}}hfill \\
{text{If the minimum point is translated $d$ units to the right of the}}hfill \\
{text{$y$-axis, the equation is $y=-Acos[k(x-d)^circ]+c$}}hfill \\
{text{Note that multiple possible sinusoidal functions can describe a graph or data}}hfill \
end{gathered} ]
amplitude: $A=dfrac{|30-(-30)|}{2}=30$
axis: $c=dfrac{30+(-30)}{2}=0$
Since minimum occurs at $t=2$ and maximum at $t=12$, the half-cycle takes $12-2=10$ s, thus the period must be
$T=2(10)=20$ s $implies k=dfrac{360}{20}=18$
Maximum is $12$ units away from the $y$-axis, thus we shall use the form $y=Acos[k(x-d)]+c$ with $d=12$
$y=30cos[18(t-12)]^circ$
Another possible answer is using the fact that the minimum is 2 units from the $y$-axis leading to the form $y=-Acos[k(x-d)]+c$,
$$
y=-30cos[18(t-2)]^circ
$$
$$
y=21cos[18(t-12)]^circ
$$
b) $y=21cos[18(t-12)^circ]$
{text{For a sinusoidal function, remember the following }} hfill \
hfill \
y = Acos left[ {kleft( {x – d} right)} right] + c{text{ }} hfill \
{text{or }} hfill \
y = Asin left[ {kleft( {x – d} right)} right] + c{text{ }} hfill \
hfill \
{text{amplitude = }}|A| = dfrac{|y_{text{max}}-y_{text{min}}|}{2}hfill \
{text{period = }}T=frac{{{{360}^ circ }}}{|k|} hfill \
{text{equation of axis:}}{text{ }},,,y = c = dfrac{y_{text{max}}+y_{text{min}}}{2} hfill \
hfill \
{text{Generally, if the maximum point is translated $d$ units to the right of the}}hfill \\
{text{$y$-axis, the equation is $y=Acos[k(x-d)^circ]+c$}}hfill \\
{text{If the minimum point is translated $d$ units to the right of the}}hfill \\
{text{$y$-axis, the equation is $y=-Acos[k(x-d)^circ]+c$}}hfill \\
{text{Note that multiple possible sinusoidal functions can describe a graph or data}}hfill \
end{gathered} ]
amplitude: $A=dfrac{|2.1-1.5|}{2}=0.3$
axis: $c=dfrac{2+1.5}{2}=1.75$
Half-cycle takes 1.25 s, thus the period must be
$T=2(1.25)=2.5 implies k=dfrac{360}{2.5}=144$
The maximum is translated 1.25 $s$ from the $y$-axis, thus we shall use the form
$y=Acos[k(x-d)]+c$ with $d=1.25$
$y=0.3cos[144(t-1.25)^circ]+1.75$
Another possible answer is that the minimum is exactly at the $y$-axis, thus
$$
y=-0.3cos(144t)^circ+1.75
$$
c) When $t=4$, $y=-0.3cos(144times 4)^circ+1.75approx 2$ m
d) number of cycles is the total time divided by the period, thus it contains $dfrac{40}{2.5}=16$ cycles
e) If the period is $3$, $k=dfrac{360}{3}=120$
The equations become
$y=0.3cos[120(t-1.25)^circ]+1.75$
or alternatively,
$y=-0.3cos(120t)^circ+1.75$
which are equally valid
b) $A=0.3$
c) $2$ m
d) $16$ cycles
e) $y=0.3cos[120(t-1.25)^circ]+1.75$
{text{For a sinusoidal function, remember the following }} hfill \
hfill \
y = Acos left[ {kleft( {x – d} right)} right] + c{text{ }} hfill \
{text{or }} hfill \
y = Asin left[ {kleft( {x – d} right)} right] + c{text{ }} hfill \
hfill \
{text{amplitude = }}|A| = dfrac{|y_{text{max}}-y_{text{min}}|}{2}hfill \
{text{period = }}T=frac{{{{360}^ circ }}}{|k|} hfill \
{text{equation of axis:}}{text{ }},,,y = c = dfrac{y_{text{max}}+y_{text{min}}}{2} hfill \
hfill \
{text{Generally, if the maximum point is translated $d$ units to the right of the}}hfill \\
{text{$y$-axis, the equation is $y=Acos[k(x-d)^circ]+c$}}hfill \\
{text{If the minimum point is translated $d$ units to the right of the}}hfill \\
{text{$y$-axis, the equation is $y=-Acos[k(x-d)^circ]+c$}}hfill \\
{text{Note that multiple possible sinusoidal functions can describe a graph or data}}hfill \
end{gathered} ]
Since a half-cycle takes $dfrac{1}{120}s$ the period must be
$T=2times dfrac{1}{120}=dfrac{1}{60}$ s $implies k=dfrac{360}{1/60}=21600$
amplitude: $A=dfrac{|4.5-(-4.5)|}{2}=4.5$
axis: $c=dfrac{4.5+(-4.5)}{2}=0$
The maximum point is at the $y$-axis, thus we can use the form
$y=Acosleft[k(x)right]+c$
$y=4.5cosleft[21600left(tright)right]$
However, we need to express it in terms of sine function. To do this, we shall use the formula
$cos theta = sin(90^circ-theta)$
Therefore
$$
y=4.5sinleft[90^circ-21600left(tright)^circright]
$$
y=4.5sin(90^circ-21600t^circ)
$$
{text{For a sinusoidal function, remember the following }} hfill \
hfill \
y = Acos left[ {kleft( {x – d} right)} right] + c{text{ }} hfill \
{text{or }} hfill \
y = Asin left[ {kleft( {x – d} right)} right] + c{text{ }} hfill \
hfill \
{text{amplitude = }}|A| = dfrac{|y_{text{max}}-y_{text{min}}|}{2}hfill \
{text{period = }}T=frac{{{{360}^ circ }}}{|k|} hfill \
{text{equation of axis:}}{text{ }},,,y = c = dfrac{y_{text{max}}+y_{text{min}}}{2} hfill \
hfill \
{text{Generally, if the maximum point is translated $d$ units to the right of the}}hfill \\
{text{$y$-axis, the equation is $y=Acos[k(x-d)^circ]+c$}}hfill \\
{text{If the minimum point is translated $d$ units to the right of the}}hfill \\
{text{$y$-axis, the equation is $y=-Acos[k(x-d)^circ]+c$}}hfill \\
{text{Note that multiple possible sinusoidal functions can describe a graph or data}}hfill \
end{gathered} ]
Since a half-cycle takes $0.6-0.2=0.4$ s the period must be
$T=2times 0.4=0.8$ s $implies k=dfrac{360}{0.8}=450$
amplitude: $A=dfrac{|20-4|}{2}=8$
axis: $c=dfrac{20+4}{2}=12$
The maximum point is $0.2$ s to the right of $y$-axis, thus we can use the form
$y=Acosleft[k(x-d)right]+c$ with $d=0.2$
$y=8cosleft[450left(t-0.2right)^circright]+12$
domain: ${ t in bold{R};|; 0leq t< +infty}$
The range is the set of values from $y_{text{min}}$ to $y_{text{max}}$
range: ${ y in bold{R};|;4leq yleq 20}$
d) We shall evaluate $y$ when $t=1.3$ s
$y=8cos[450(1.3-0.2)^circ]+12=6.34$ cm
b) domain: ${ t in bold{R};|; 0leq t< +infty}$ ; range: ${ y in bold{R};|;4leq yleq 20}$
c) $y=12$
d) $6.34$ cm
{text{For a sinusoidal function, remember the following }} hfill \
hfill \
y = Acos left[ {kleft( {x – d} right)} right] + c{text{ }} hfill \
{text{or }} hfill \
y = Asin left[ {kleft( {x – d} right)} right] + c{text{ }} hfill \
hfill \
{text{amplitude = }}|A| = dfrac{|y_{text{max}}-y_{text{min}}|}{2}hfill \
{text{period = }}T=frac{{{{360}^ circ }}}{|k|} hfill \
{text{equation of axis:}}{text{ }},,,y = c = dfrac{y_{text{max}}+y_{text{min}}}{2} hfill \
hfill \
{text{Generally, if the maximum point is translated $d$ units to the right of the}}hfill \\
{text{$y$-axis, the equation is $y=Acos[k(x-d)^circ]+c$}}hfill \\
{text{If the minimum point is translated $d$ units to the right of the}}hfill \\
{text{$y$-axis, the equation is $y=-Acos[k(x-d)^circ]+c$}}hfill \\
{text{Note that multiple possible sinusoidal functions can describe a graph or data}}hfill \
end{gathered} ]
The period is the distance traveled by the wheel in one revolution, that is, the circumference of the outer circle.
$T=2pi times 40=80pi$ $implies k=dfrac{360}{80pi}=1.4324$
amplitude (radius of the inner circle): $A=30$
axis (height of the center of the wheel): $c=10+30=40$
The minimum point occurs exactly at $y$-axis (that is, $x$=0), therefore, we shall use the form
$y=-Acos(kx)+c$
$$
y=-30cos(1.4324x)^circ+40
$$
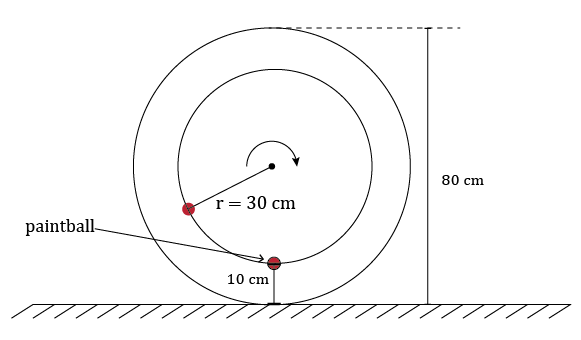
domain: ${ x in bold{R};|;0leq xleq 400pi}$
The range is the set of values from $y_{text{min}}$ to $y_{text{max}}$.
range: ${ y in bold{R};|;10 leq y leq 70}$
$y=-30cos(1.4324times 120^circ)+40=69.7$ cm
b) domain: ${ x in bold{R};|;0leq xleq 400pi}$ ; range: ${ y in bold{R};|;10 leq y leq 70}$
c) $69.7$ cm
{text{For a sinusoidal function, remember the following }} hfill \
hfill \
y = Acos left[ {kleft( {x – d} right)} right] + c{text{ }} hfill \
{text{or }} hfill \
y = Asin left[ {kleft( {x – d} right)} right] + c{text{ }} hfill \
hfill \
{text{amplitude = }}|A| = dfrac{|y_{text{max}}-y_{text{min}}|}{2}hfill \
{text{period = }}T=frac{{{{360}^ circ }}}{|k|} hfill \
{text{equation of axis:}}{text{ }},,,y = c = dfrac{y_{text{max}}+y_{text{min}}}{2} hfill \
hfill \
{text{Generally, if the maximum point is translated $d$ units to the right of the}}hfill \\
{text{$y$-axis, the equation is $y=Acos[k(x-d)^circ]+c$}}hfill \\
{text{If the minimum point is translated $d$ units to the right of the}}hfill \\
{text{$y$-axis, the equation is $y=-Acos[k(x-d)^circ]+c$}}hfill \\
{text{Note that multiple possible sinusoidal functions can describe a graph or data}}hfill \
end{gathered} ]
(1) amplitude: the distance from center/resting position to the maximum or minimum value
(2) axis: the position of the center/resting position halfway between maximum or minimum value
(3) period: the time for completing one cycle
(4) starting position or the location of first maximum or minimum
{text{For a sinusoidal function, remember the following }} hfill \
hfill \
y = Acos left[ {kleft( {x – d} right)} right] + c{text{ }} hfill \
{text{or }} hfill \
y = Asin left[ {kleft( {x – d} right)} right] + c{text{ }} hfill \
hfill \
{text{amplitude = }}|A| = dfrac{|y_{text{max}}-y_{text{min}}|}{2}hfill \
{text{period = }}T=frac{{{{360}^ circ }}}{|k|} implies k=dfrac{360^circ}{T} hfill \
{text{equation of axis:}}{text{ }},,,y = c = dfrac{y_{text{max}}+y_{text{min}}}{2} hfill \
hfill \
{text{Generally, if the maximum point is translated $d$ units to the right of the}}hfill \\
{text{$y$-axis, the equation is $y=Acos[k(x-d)^circ]+c$}}hfill \\
{text{If the minimum point is translated $d$ units to the right of the}}hfill \\
{text{$y$-axis, the equation is $y=-Acos[k(x-d)^circ]+c$}}hfill \\
{text{Note that multiple possible sinusoidal functions can describe a graph or data}}hfill \
end{gathered} ]
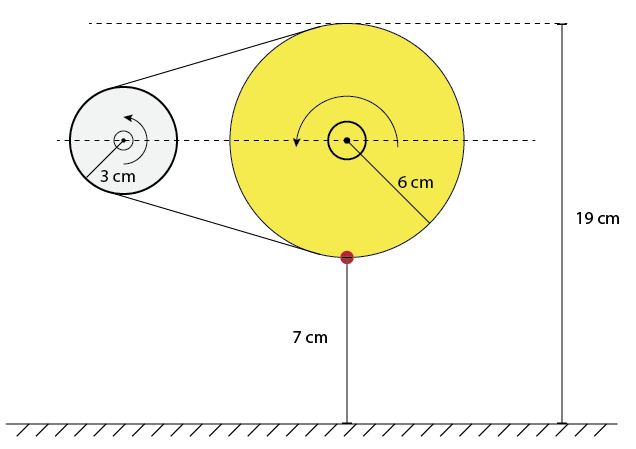
In pulley systems like this, we must remember that the linear speed at the edge of the wheel (circumference divided by period) must be the same. If $T_1$ is the time for the smaller wheel to complete one revolution, we can find the period for the bigger wheel as $T_2$ as
linear speed = $dfrac{2picdot 3}{T_1}=dfrac{2picdot 6}{T_2}implies T_2=2cdot T_1$
This means that when the bigger wheel completes one revolution, the smaller wheel completes 2 revolutions.
Therefore $k=dfrac{360}{720}=0.5$
From the figure, $y_{min}=7$ occurs initially (at $x$=0) and $y_{max}=7+6times 2= 19$. From these,
amplitude: $A=dfrac{|19-7|}{2}=6$
axis: $A=dfrac{19+7}{2}=13$
Since the minimum point occurs at $x=0$, we shall use the form $y=-Acos(kx)+c$
Therefore,
$$
y=-6cos(0.5x)^circ+13
$$
y=-6cos(0.5x)^circ+13
$$
{text{For a sinusoidal function, remember the following }} hfill \
hfill \
y = Acos left[ {kleft( {x – d} right)} right] + c{text{ }} hfill \
{text{or }} hfill \
y = Asin left[ {kleft( {x – d} right)} right] + c{text{ }} hfill \
hfill \
{text{amplitude = }}|A| = dfrac{|y_{text{max}}-y_{text{min}}|}{2}hfill \
{text{period = }}T=frac{{{{360}^ circ }}}{|k|} hfill \
{text{equation of axis:}}{text{ }},,,y = c = dfrac{y_{text{max}}+y_{text{min}}}{2} hfill \
hfill \
{text{Generally, if the maximum point is translated $d$ units to the right of the}}hfill \\
{text{$y$-axis, the equation is $y=Acos[k(x-d)^circ]+c$}}hfill \\
{text{If the minimum point is translated $d$ units to the right of the}}hfill \\
{text{$y$-axis, the equation is $y=-Acos[k(x-d)^circ]+c$}}hfill \\
{text{Note that multiple possible sinusoidal functions can describe a graph or data}}hfill \
end{gathered} ]
$y_{text{min}}=-4$
$y_{text{max}}=2$
period = $360^circimplies k =dfrac{360}{360}=1$
minimum point occurs at $x=0$
Using these information,
amplitude: $A=dfrac{|2-(-4)|}{2}=3$
axis: $c=dfrac{2+(-4)}{2}=-1$
Since the minimum point is at the $y$-axis, we shall use the form $y=-Acos(kx)+c$
Therefore, the equation that can describe the graph is
$$
f(x)=-3cos(x)^circ-1
$$
c) If $f(x)=2$, from the graph, $x=180^circ+360^circ,;kinbold{I}implies text{option(i)}$
d) If $f(x)=-1$, from the graph, $x=90^circ+180^circ k,;kinbold{I}implies text{option(iv)}$
b) $f(20)approx -3.82$
c) option (i)
d) option (iv)
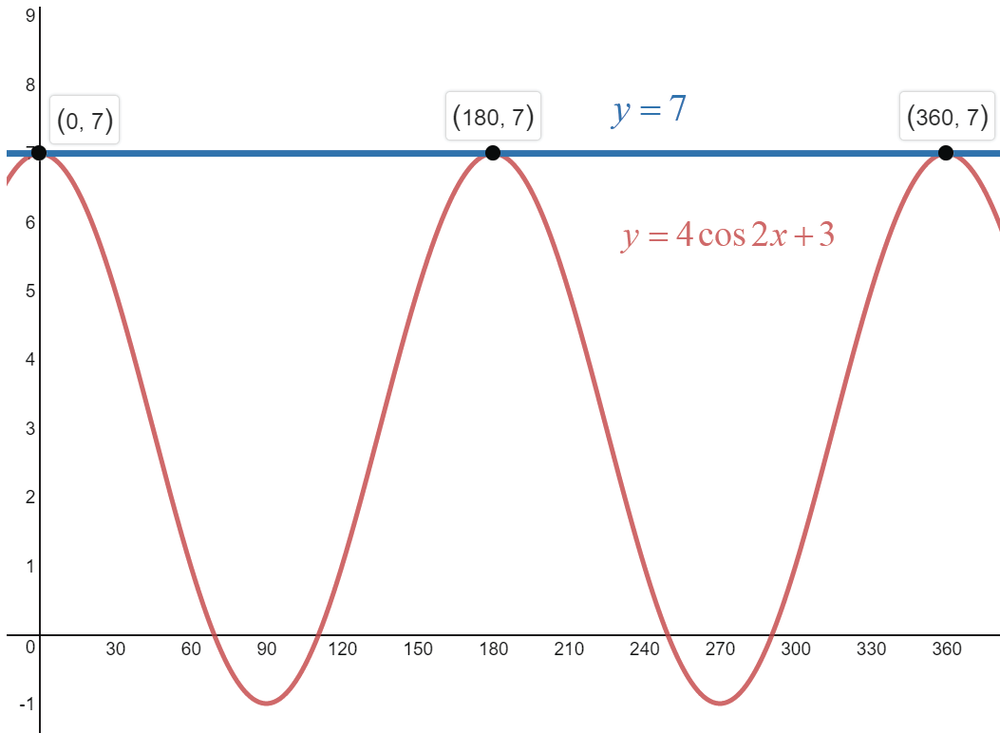
$$
x={ 0^circ,;180^circ,;360^circ}
$$
x={ 0^circ,;180^circ,;360^circ}
$$
