All Solutions
Page 376: Practice Questions
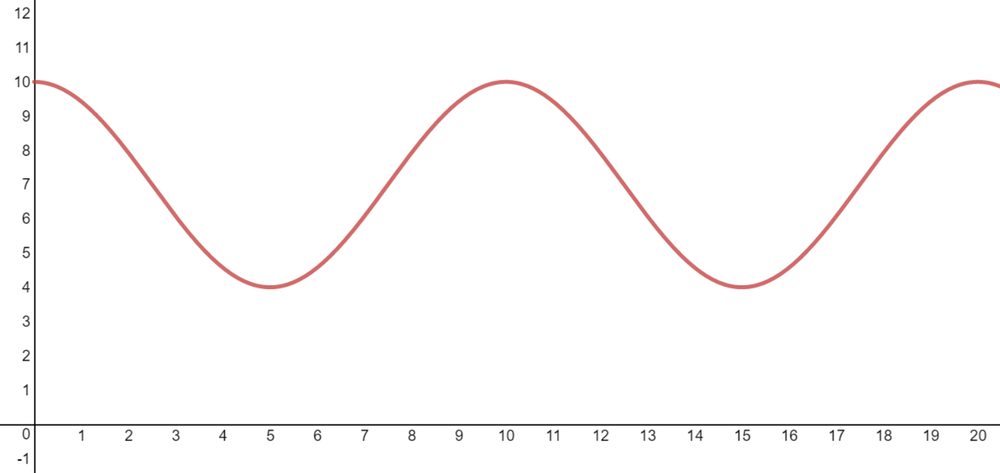
The equation of the axis must be $y=dfrac{4+10}{2}implies y=7$
and the amplitude is $A=dfrac{|10-4|}{2}=3$
Using this information, we can sketch the following.
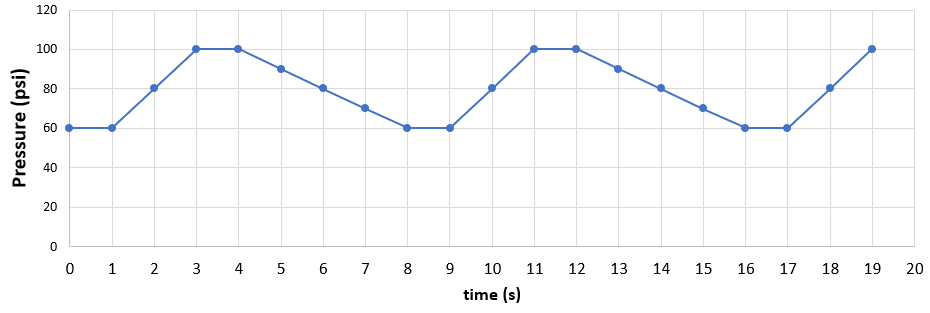
c) The period of the function is $8$ s.
d) From the graph $y_{min}=60$ and $y_{max}=100$. Thus, the equation of the axis is $y=dfrac{y_{min}+y_{max}}{2}=dfrac{60+100}{2}implies y=80$
e) The amplitude is $A=dfrac{|y_{max}-y_{min}|}{2}=dfrac{|100-60|}{2}implies A=20$
f) The rate of pressure increase is the slope of the line from $t=1$ to $t=3$ which is $dfrac{100-60}{3-1}=20$ psi/s
g) The rate of pressure decrease is the slope of the line from $t=4$ to $t=8$ which is $dfrac{60-100}{8-4}=-10$ psi/s. The negative indicates that the pressure is decreasing so the magnitude is just $10$ psi/s
h) The container is never empty on the time interval given since the minimum pressure is 60 psi which is above the normal atmospheric pressure (14.7 psi).
b) repeats at regular intervals
c) 8 s
d) $y=80$
e) $A=20$
f) $20$ psi/s
g) $10$ psi/s
h) No
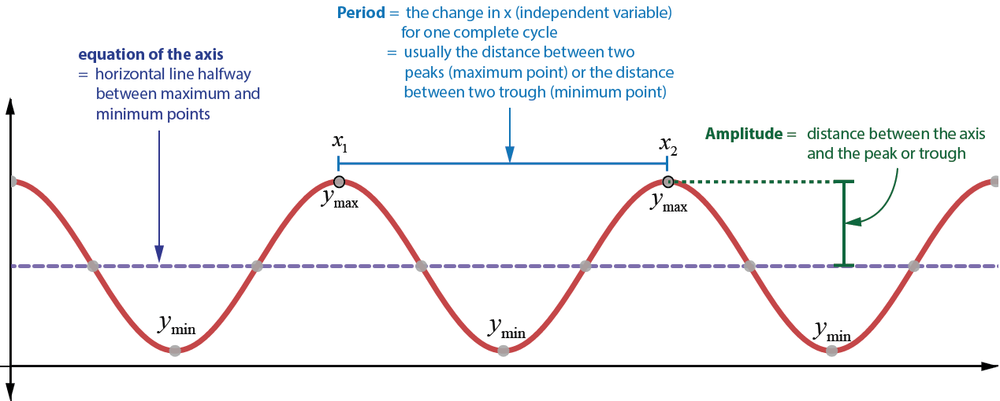
{mathbf{Useful}}{text{ }}{mathbf{Definitions}} hfill \
{text{equation of the axis: }},,y = frac{{{y_{max }} + {y_{min }}}}{2} hfill \
{text{amplitude: }}A = {text{ }}frac{{left| {{y_{max }} – {y_{min }}} right|}}{2} hfill \
{text{period}} = left| {{x_2} – {x_1}} right| hfill \
hfill \
{text{For a sinusoidal function}} hfill \
hfill \
y = Acos left( {kx} right) + B{text{ or }}y = Asin left( {kx} right) + B hfill \
hfill \
{text{amplitude = }}A hfill \
{text{period = }}frac{{{{360}^ circ }}}{k} hfill \
{text{equation of axis:}}{text{ }},,,y = B hfill \
end{gathered} ]

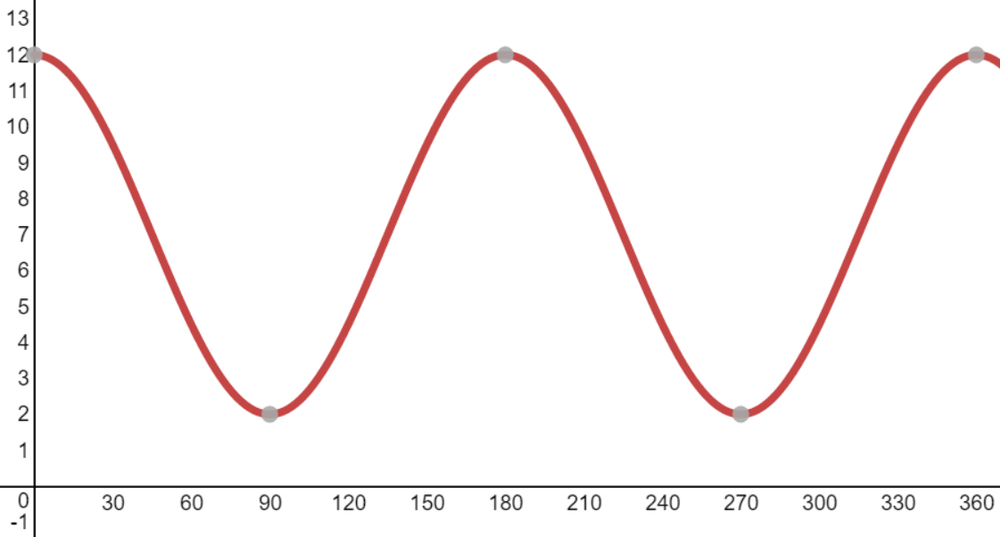
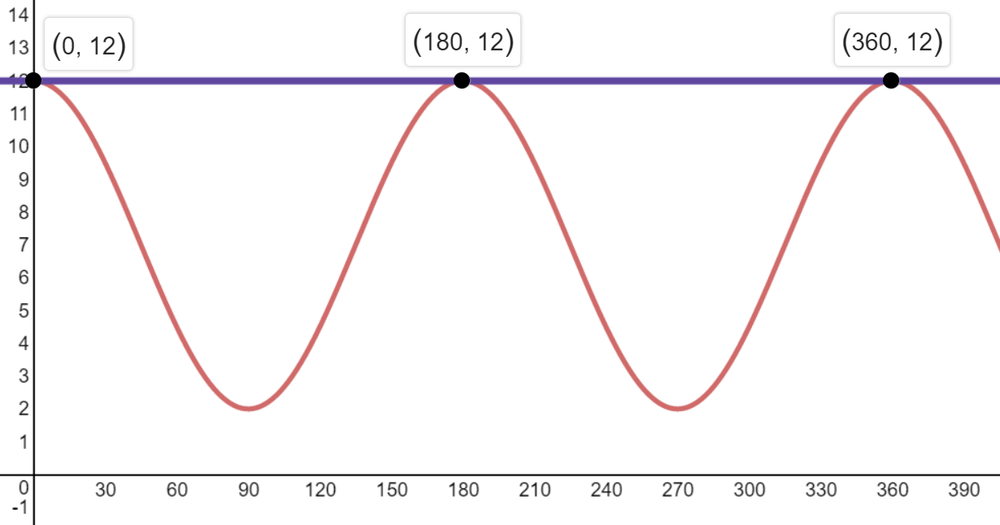
period = $dfrac{360^circ}{2}=180^circ$
equation of axis : $y=7$
amplitude : $A=5$
range: ${ g(x) in bold{R};|;2leq g(x)leq 12}$
The graph can be sketched following the given specifications.
c) $g(125)=5cos(2cdot 125)+7approx 5.2899$
period = $180^circ$
equation of axis : $y=7$
amplitude : $A=5$
range: ${ g(x) in bold{R};|;2leq g(x)leq 12}$
b) see explanation inside
c) $g(125)approx 5.2899$
d) $x={0,180,360}$
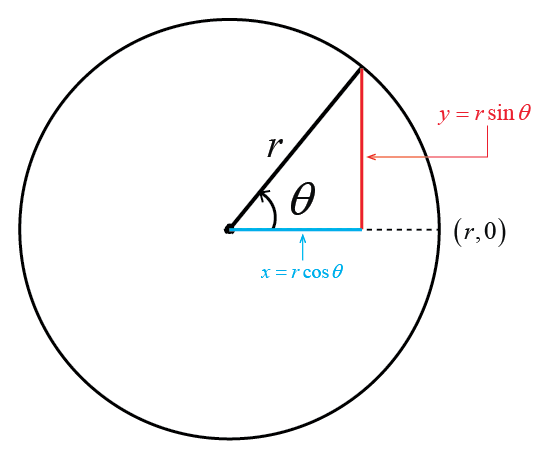
$x=7cos 64^circapprox 3.0686$
$y=7sin 64^circapprox 6.2916$
Thus, the new point is (3.07,6.29)
{mathbf{Useful}}{text{ }}{mathbf{Definitions}} hfill \
{text{equation of the axis: }},,y = frac{{{y_{max }} + {y_{min }}}}{2} hfill \
{text{amplitude: }}A = {text{ }}frac{{left| {{y_{max }} – {y_{min }}} right|}}{2} hfill \
{text{period}} = left| {{x_2} – {x_1}} right| hfill \
hfill \
{text{For a sinusoidal function}} hfill \
hfill \
y = Acos left( {kx} right) + B{text{ or }}y = Asin left( {kx} right) + B hfill \
hfill \
{text{amplitude = }}A hfill \
{text{period = }}frac{{{{360}^ circ }}}{k} hfill \
{text{equation of axis:}}{text{ }},,,y = B hfill \
end{gathered} ]

$bold{b)}$ The equation of the axis is the midline between the highest and minimum point which we can read from the graph as $y=30$. It represents the vertical distance of the center of the wheel.
$bold{c)}$ The amplitude of Mark 1 is $A=dfrac{60-0}{2}=30$ cm while that of Mark 2 is $dfrac{50-10}{2}=20$ cm. It represents the distance of the mark from the center of the wheel.
$bold{d)}$ The range is from the minimum point to maximum point which can be written as
For mark 1: ${ h(t) in bold{R};|;0leq h(t) leq 60}$
For mark 2: ${ h(t) in bold{R};|;10leq h(t) leq 50}$
$bold{e)}$ The speed of each mark is the circumference $(2pi times A)$ divided by the period.
mark 1: $v=dfrac{2picdot 30}{0.25}=753.98$ cm/s
mark 2: $v=dfrac{2picdot 20}{0.25}=502.65$ cm/s
$bold{f)}$ A third mark closer to the center is expected to have lower amplitude than Mark 2 but the same period and axis as Mark 1 and Mark 2.
b) $y=30$ cm
c) mark 1: A = 30 cm ; mark 2: A = 20 cm
d) mark 1: ${ h(t) in bold{R};|;0leq h(t) leq 60}$, mark 2: ${ h(t) in bold{R};|;10leq h(t) leq 50}$
e) mark 1: $753.98$ cm/s , mark 2: $502.65$ cm/s
f) lower amplitude but the same axis and period
{mathbf{Useful}}{text{ }}{mathbf{Definitions}} hfill \
{text{equation of the axis: }},,y = frac{{{y_{max }} + {y_{min }}}}{2} hfill \
{text{amplitude: }}A = {text{ }}frac{{left| {{y_{max }} – {y_{min }}} right|}}{2} hfill \
{text{period}} = left| {{x_2} – {x_1}} right| hfill \
hfill \
{text{For a sinusoidal function}} hfill \
hfill \
y = Acos left( {kx} right) + B{text{ or }}y = Asin left( {kx} right) + B hfill \
hfill \
{text{amplitude = }}A hfill \
{text{period = }}frac{{{{360}^ circ }}}{k} hfill \
{text{equation of axis:}}{text{ }},,,y = B hfill \
end{gathered} ]
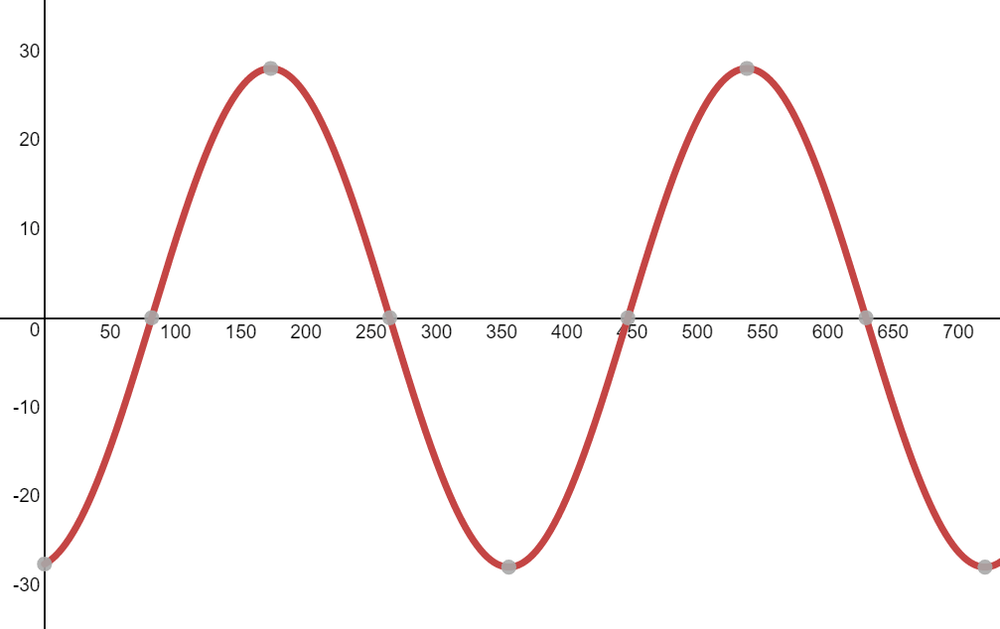
$bold{b)}$ The period of the function is $T=dfrac{360^circ}{(360/365)}=365$
It represents the number of days in a year in which the cycle goes through.
$bold{c)}$ The equation of the axis (midline between maximum and minimum point) is $y=0$. It represents the position of $0^circ$ with respect to due west.
$bold{d)}$ From the given function, the amplitude is $A=28$
$bold{e)}$ The range of the function is the set of $P(d)$ values from minimum to maximum point.
${ P(d) in bold{R};|;-28leq P(d) leq 28}$
$bold{f)}$ February 15 corresponds to the 46th day of the year, thus we shall evaluate $P(46)$
$$
P(46)=28cdot sinleft(dfrac{360}{365}(46)-81right)^circ=-16.3^circ
$$
b) 365
c) $y=0$
d) $A=28$
e) ${ P(d) in bold{R};|;-28leq P(d) leq 28}$
f) $-16.3^circ$
