All Solutions
Page 370: Check Your Understanding
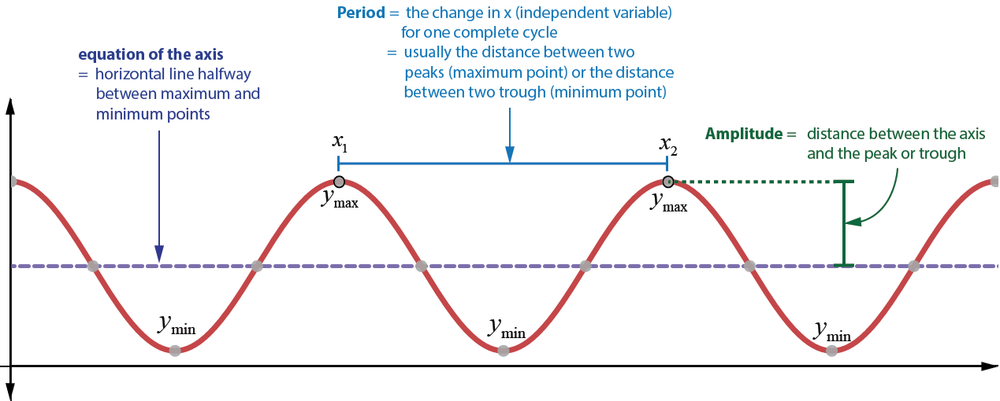
{mathbf{Useful}}{text{ }}{mathbf{Definitions}} hfill \
{text{equation of the axis: }},,y = frac{{{y_{max }} + {y_{min }}}}{2} hfill \
{text{amplitude: }}A = {text{ }}frac{{left| {{y_{max }} – {y_{min }}} right|}}{2} hfill \
{text{period}} = left| {{x_2} – {x_1}} right| hfill \
end{gathered} ]

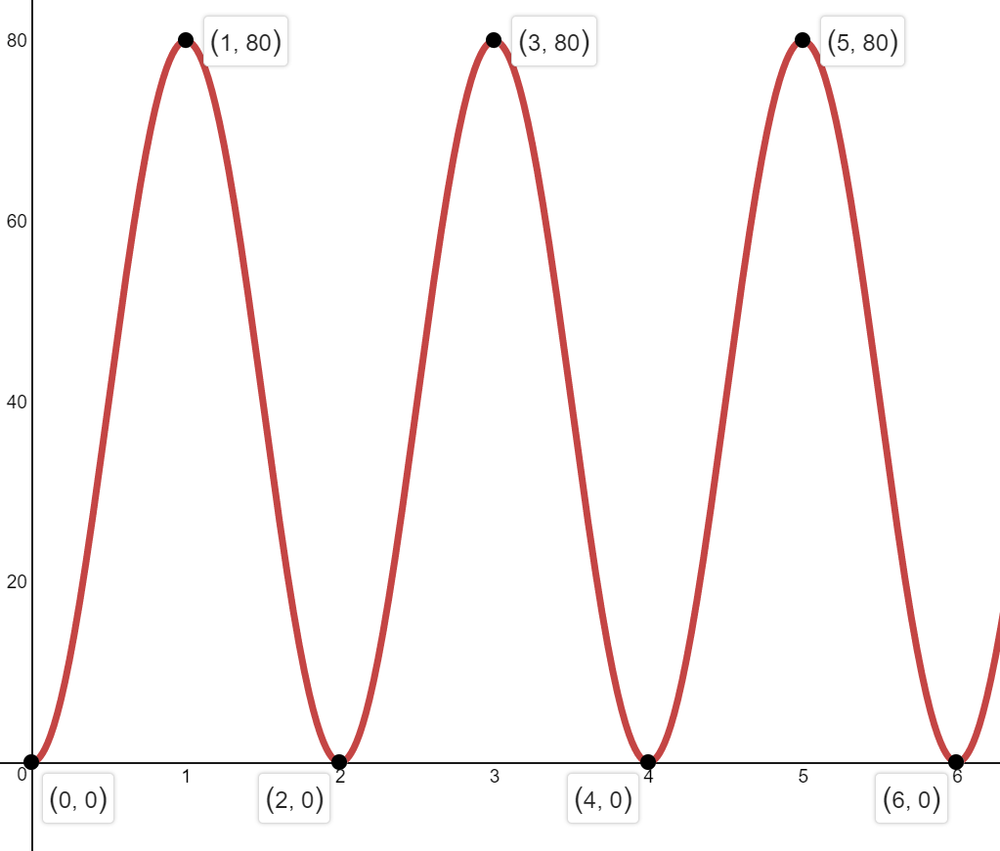
Therefore, it is $y=dfrac{14+2}{2}implies y=8$
The position at the axis represents the resting position of the swing.
b) The amplitude is $A=dfrac{|14-2|}{2}=6$.
The amplitude represents the maximum achievable distance from the resting position.
c) The period is $7-3=4$ s. It means it takes 4 s to complete one cycle.
d) The minimum distance between Olivia and motion detector is $2$ m.
e) No. At $t=7s$, the distance is decreasing, implying that Olivia is moving towards the detector where you can collide with her.
f) Olivia’s motion is not yet stabilized as soon as she started swinging because she will have to move away from the resting position by herself at the start (not through the swing motion). Thus, it will not be sinusoidal. It would probably look like this.
b) $A=6$
c) $T=4$s
d) $2$m
e) No
f) not sinusoidal, see graph
{mathbf{Useful}}{text{ }}{mathbf{Definitions}} hfill \
{text{equation of the axis: }},,y = frac{{{y_{max }} + {y_{min }}}}{2} hfill \
{text{amplitude: }}A = {text{ }}frac{{left| {{y_{max }} – {y_{min }}} right|}}{2} hfill \
{text{period}} = left| {{x_2} – {x_1}} right| hfill \
end{gathered} ]

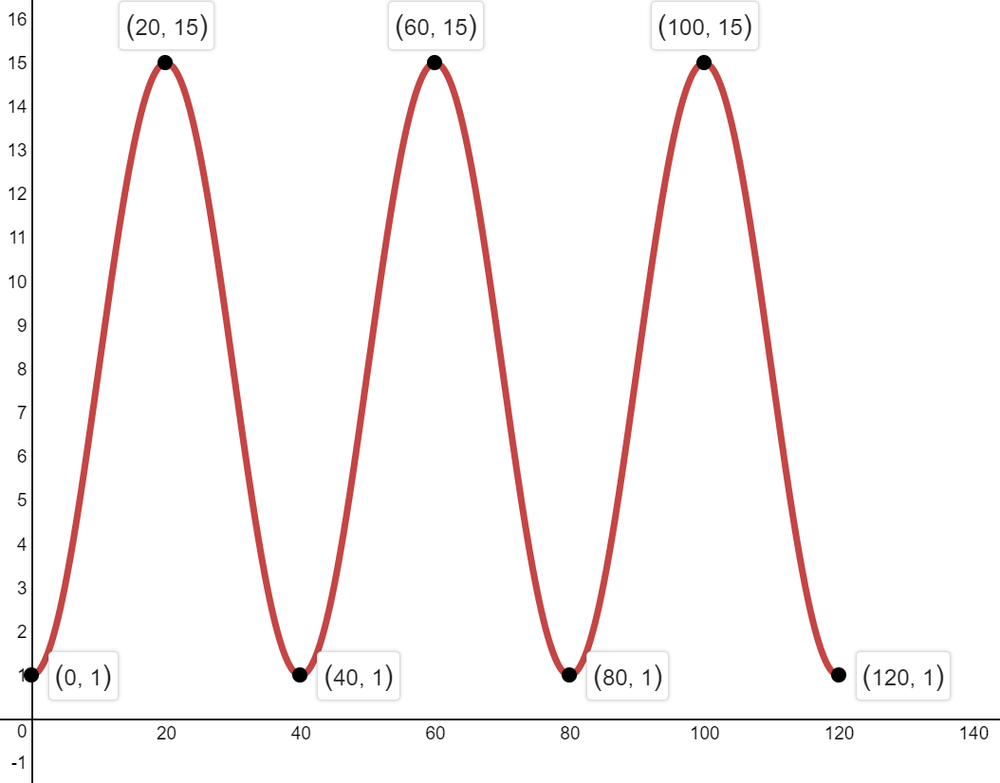
Paddle A: $y_{min}=-1$ , $y_{max}=5$
Paddle B: $y_{min}=-1$ , $y_{max}=7$
$bf{Amplitude}$
The amplitude of the graph represents the radius of the wheel. Thus,
radius of Paddle A = $dfrac{|5-(-1)|}{2}=3$ m
radius of Paddle B = $dfrac{|7-(-1)|}{2}=4$ m
$bf{Time;for;Complete;Revolution}$
The time taken to complete one revolution is the period of the graphs.
Paddle A has 4 cycles in 48 s, thus its period is $T=dfrac{48}{4}=12$ s. Paddle B has 3 cycles in 48s m, thus its period is $T=dfrac{48}{3}=16;s$
The height of the axle relative to the water is reflected on the equation of the axis.
Height of Axle A: $dfrac{5+(-1)}{2}=2$ m
Height of Axle B: $dfrac{7+(-1)}{2}=3$ m
$bf{Speed;of;wheel}$
The speed of the wheel is the circumference of the wheel divided by the time for one complete revolution.
Speed of Wheel A: $v=dfrac{2picdot 3;text{m}}{12;text{s}}=1.57;text{m/s}$
Speed of Wheel B: $v=dfrac{2picdot 4;text{m}}{16;text{s}}=1.57;text{m/s}$
defarraystretch{1.5}%
begin{tabular}{|l|l|l|}
hline
& Wheel A & Wheel B \ hline
radius & 3 m & 4 m \ hline
time for complete revolution & 12 s & 16 s \ hline
begin{tabular}[c]{@{}l@{}}height of axle\ relative to the waterend{tabular} & 2 m & 3 m \ hline
speed & 1.57 m/s & 1.57 m/s \ hline
end{tabular}
end{table}
$y=Asin (kx)+B$
$y=Acos(kx)+B$
amplitude = $A$
period = $dfrac{360^circ}{k}$
$y=2cos(3x)+3$
$y=4cos(3x)+3$
$y=5sin(3x)+3$
$y=0.25sin(3x)+3$
{mathbf{Useful}}{text{ }}{mathbf{Definitions}} hfill \
{text{equation of the axis: }},,y = frac{{{y_{max }} + {y_{min }}}}{2} hfill \
{text{amplitude: }}A = {text{ }}frac{{left| {{y_{max }} – {y_{min }}} right|}}{2} hfill \
{text{period}} = left| {{x_2} – {x_1}} right| hfill \
end{gathered} ]

b) The period of the function can be obtained from the change in time between two peaks which is $T=0.04-0=0.04$s
c) The amplitude of the function is $A=dfrac{|1-(-7)|}{2}=4$ in.
This represents the radius of the blade.
d) The speed of the tooth is the circumference of the blade divided by the period. Therefore,
speed $=dfrac{2picdot 4text{in}}{0.04;text{s}}=628$ in/s
b) $0.04$ s
c) $4$ in, radius
d) 628 in/s
{mathbf{Useful}}{text{ }}{mathbf{Definitions}} hfill \
{text{equation of the axis: }},,y = frac{{{y_{max }} + {y_{min }}}}{2} hfill \
{text{amplitude: }}A = {text{ }}frac{{left| {{y_{max }} – {y_{min }}} right|}}{2} hfill \
{text{period}} = left| {{x_2} – {x_1}} right| hfill \
end{gathered} ]

$0.04-0.0075=0.0325$ s
b) The equation of the axis is $y=dfrac{4.5+(-4.5)}{2}implies y=0$
c) The amplitude is $A=dfrac{4.5-(-4.5)}{2}implies A=4.5$
b) $y=0$
c) $A=4.5$
{mathbf{Useful}}{text{ }}{mathbf{Definitions}} hfill \
{text{equation of the axis: }},,y = frac{{{y_{max }} + {y_{min }}}}{2} hfill \
{text{amplitude: }}A = {text{ }}frac{{left| {{y_{max }} – {y_{min }}} right|}}{2} hfill \
{text{period}} = left| {{x_2} – {x_1}} right| hfill \
end{gathered} ]

radius of Ferris wheel is 7m $implies$ $A=7$
axle is 8m above the ground $implies$ equation of axis is $y=8$
rotates once every 40 s $implies$ $T=40;s$
radius of water wheel is 3m $implies$ $A=3$
center is at water level $implies$ equation of axis is $y=0$
rotates once every 15 s $implies$ $T=15;s$
radius of bicycle wheel is 40cm $implies$ $A=40$
center must be 40 cm above the ground $implies$ equation of axis is $y=40$
rotates once every 2 s $implies$ $T=2;s$
wave pool is 3 m deep $implies$ minimum height from the ground is 3m
waves 0.5 m in height $implies$ maximum height from the ground is $3.5$ m
amplitude $A=dfrac{3.5-3}{2}=0.25$
equation of axis is $y=dfrac{3.5+3}{2}=3.25$
wave occur at 7s intervals $implies T=7$
{mathbf{Useful}}{text{ }}{mathbf{Definitions}} hfill \
{text{equation of the axis: }},,y = frac{{{y_{max }} + {y_{min }}}}{2} hfill \
{text{amplitude: }}A = {text{ }}frac{{left| {{y_{max }} – {y_{min }}} right|}}{2} hfill \
{text{period}} = left| {{x_2} – {x_1}} right| hfill \
end{gathered} ]

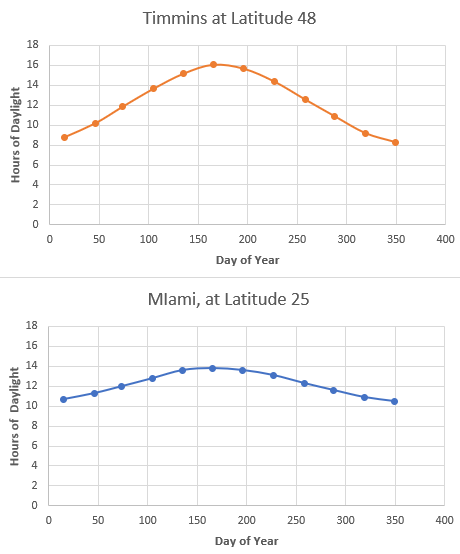
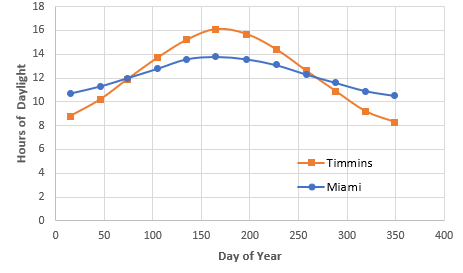
The amplitude for Timmins is $A=dfrac{16.1-8.3}{2}=3.9$ hours
while that for Miami is $A=dfrac{13.8-10.5}{2}=1.7$ hours
The equation of axis for Timmins is $y=dfrac{16.1+8.3}{2}implies y=12.2$
while that for Miami is $y=dfrac{13.8+10.5}{2}=12.15$
{mathbf{Useful}}{text{ }}{mathbf{Definitions}} hfill \
{text{equation of the axis: }},,y = frac{{{y_{max }} + {y_{min }}}}{2} hfill \
{text{amplitude: }}A = {text{ }}frac{{left| {{y_{max }} – {y_{min }}} right|}}{2} hfill \
{text{period}} = left| {{x_2} – {x_1}} right| hfill \
end{gathered} ]

Since the diameter of the car is $52$ cm, its radius is $52/2=26$ cm. The radius of the wheel represents the amplitude of the sinusoidal graph. The distance of the center of the wheel from the ground corresponds to the axis, which is also equal to the radius of the wheel, that is, 26 cm. The nail must be at the ground at the beginning, so the graph should start at the minimum point. The period of the graph must be the distance traveled in one revolution which is $52times pi$.
With these information, the graph can be sketched as follows.
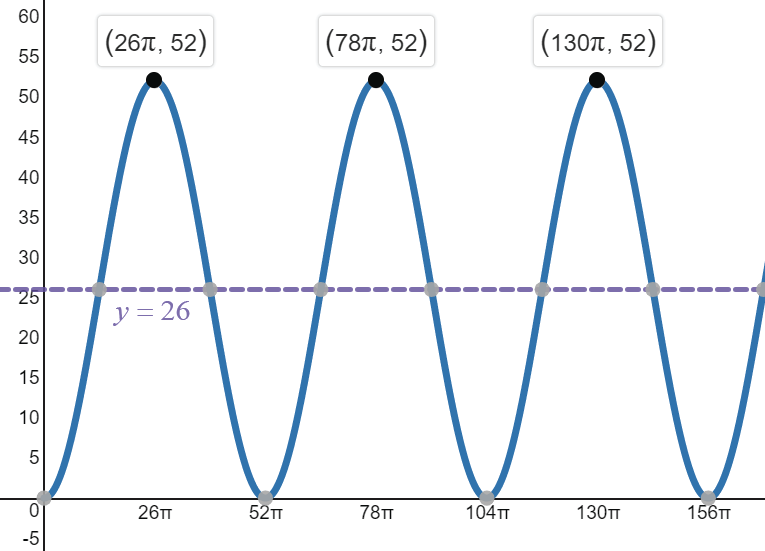
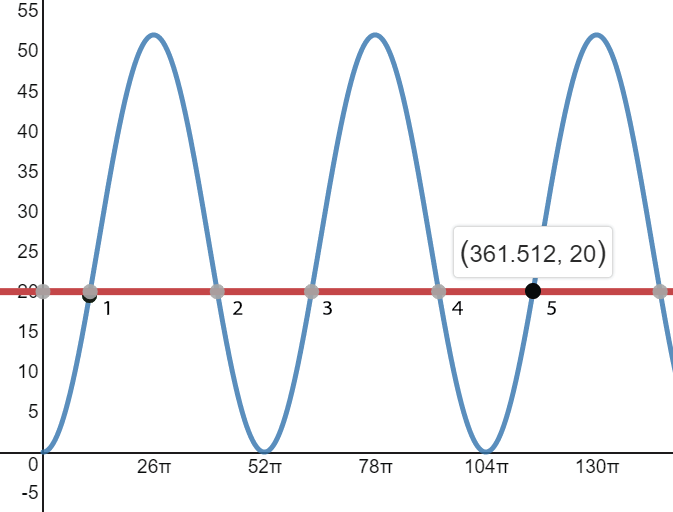
no. of revolutions = $dfrac{10,000}{52 times pi}=61.21$ revolutions
Now, we need to know what height does a 0.21 revolution correspond to. You know that one revolution is $360^circ$, so $0.21$ revolution is $0.21times 360^circ=75.6^circ$
You can visualize the problem by sketching a diagram as shown.
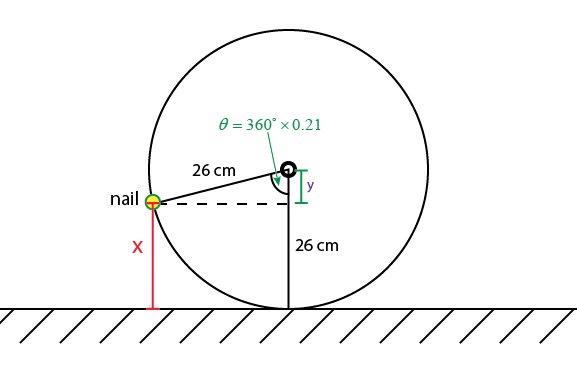
Remember that
$cos theta = dfrac{text{adjacent}}{text{hypotenuse}}$
y= $26cdot cos(360^circ cdot 0.21)=6.4659$ cm
$x=26 -6.4659=19.53$ cm
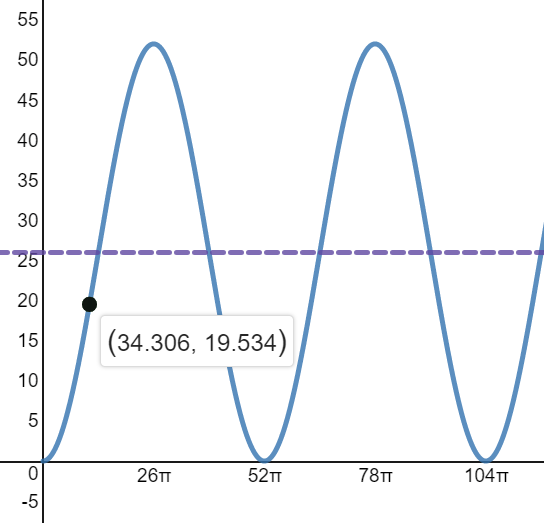
b) 19.53 cm
c) 361.5 cm
d) see explanation
{mathbf{Useful}}{text{ }}{mathbf{Definitions}} hfill \
{text{equation of the axis: }},,y = frac{{{y_{max }} + {y_{min }}}}{2} hfill \
{text{amplitude: }}A = {text{ }}frac{{left| {{y_{max }} – {y_{min }}} right|}}{2} hfill \
{text{period}} = left| {{x_2} – {x_1}} right| hfill \
end{gathered} ]

$y=Asin(kx)+B$,
amplitude = A
period = $dfrac{360}{k}$
equation of axis: $y=B$
Given that
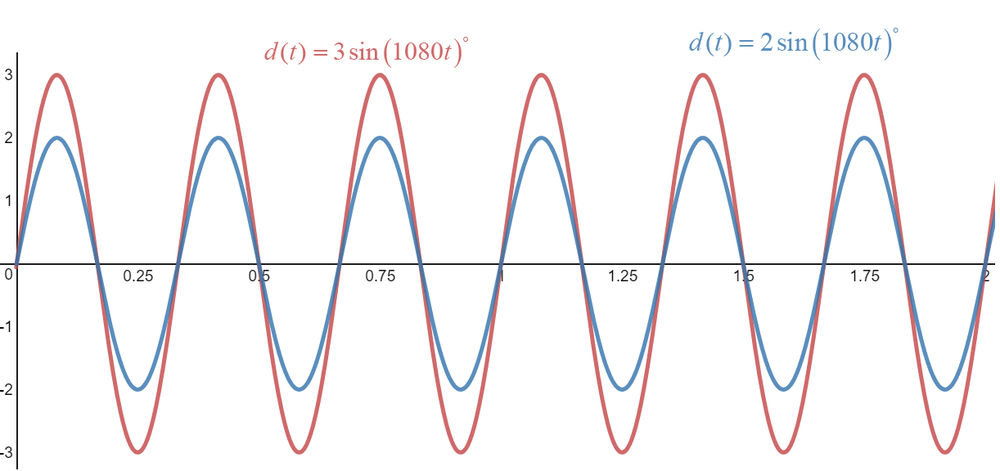
high speed: $d(t)=3sin(1080t)^circ$
low speed: $d(t)=2sin(1080t)^circ$
We can obtain the following.
defarraystretch{1.5}%
begin{tabular}{|l|l|l|}
hline
High Speed & High Speed & Low Speed \ hline
period & $frac{1}{3}$ s & $frac{1}{3}$ s \ hline
amplitude & 3 cm & 2 cm \ hline
equation of the axis & $y=0$ & $y=0$ \ hline
end{tabular}
end{table}
defarraystretch{1.5}%
begin{tabular}{|l|l|l|}
hline
High Speed & High Speed & Low Speed \ hline
period & $frac{1}{3}$ s & $frac{1}{3}$ s \ hline
amplitude & 3 cm & 2 cm \ hline
equation of the axis & $y=0$ & $y=0$ \ hline
end{tabular}
end{table}
{mathbf{Useful}}{text{ }}{mathbf{Definitions}} hfill \
{text{equation of the axis: }},,y = frac{{{y_{max }} + {y_{min }}}}{2} hfill \
{text{amplitude: }}A = {text{ }}frac{{left| {{y_{max }} – {y_{min }}} right|}}{2} hfill \
{text{period}} = left| {{x_2} – {x_1}} right| hfill \
hfill \
{text{For a sinusoidal function}} hfill \
hfill \
y = Acos left( {kx} right) + B{text{ or }}y = Asin left( {kx} right) + B hfill \
hfill \
{text{amplitude = }}A hfill \
{text{period = }}T=frac{{{{360}^ circ }}}{k} hfill \
{text{equation of axis:}}{text{ }},,,y = B hfill \
end{gathered} ]

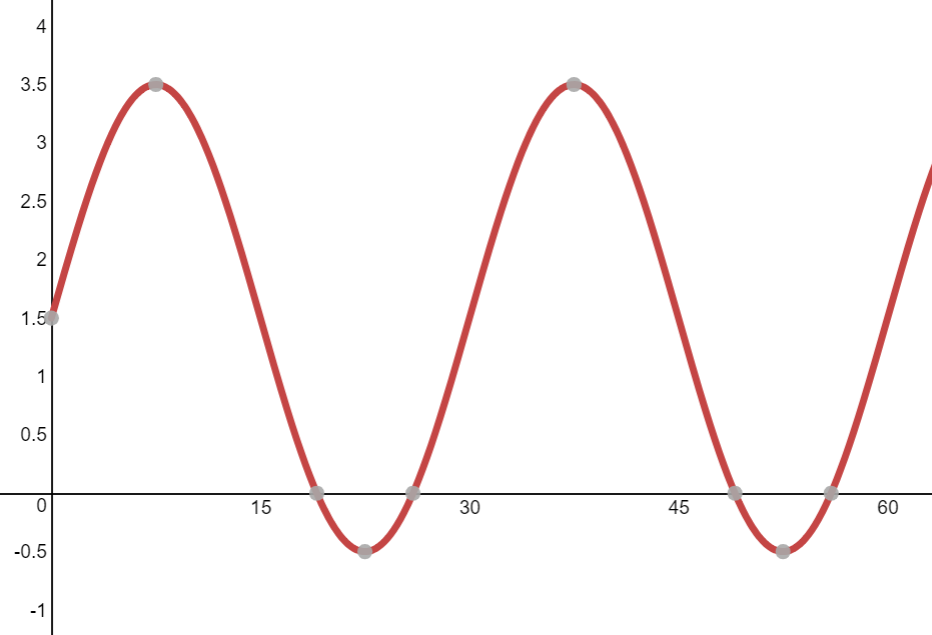
$T=dfrac{360}{12}=30$ seconds
c) The radius of the wheel correspond to the amplitude which is
$A=2$ m
d) The center of the wheel corresponds to the height of the axis which is
$h=1.5$ m
e) $h(10)=2sin(12cdot 10)+1.5=3.232$ m
This corresponds to the height of the basket at $t=10$ s
b) 30 s
c) 2 m
d) 1.5 m
e) 3.232 m, height of the basket at $t=10$ s
{mathbf{Useful}}{text{ }}{mathbf{Definitions}} hfill \
{text{equation of the axis: }},,y = frac{{{y_{max }} + {y_{min }}}}{2} hfill \
{text{amplitude: }}A = {text{ }}frac{{left| {{y_{max }} – {y_{min }}} right|}}{2} hfill \
{text{period}} = left| {{x_2} – {x_1}} right| hfill \
hfill \
{text{For a sinusoidal function}} hfill \
hfill \
y = Acos left( {kx} right) + B{text{ or }}y = Asin left( {kx} right) + B hfill \
hfill \
{text{amplitude = }}A hfill \
{text{period = }}T=frac{{{{360}^ circ }}}{k} hfill \
{text{equation of axis:}}{text{ }},,,y = B hfill \
end{gathered} ]

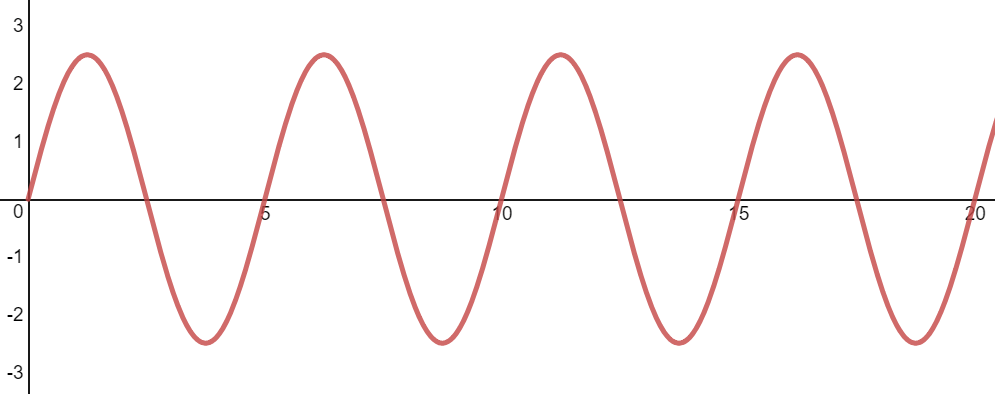
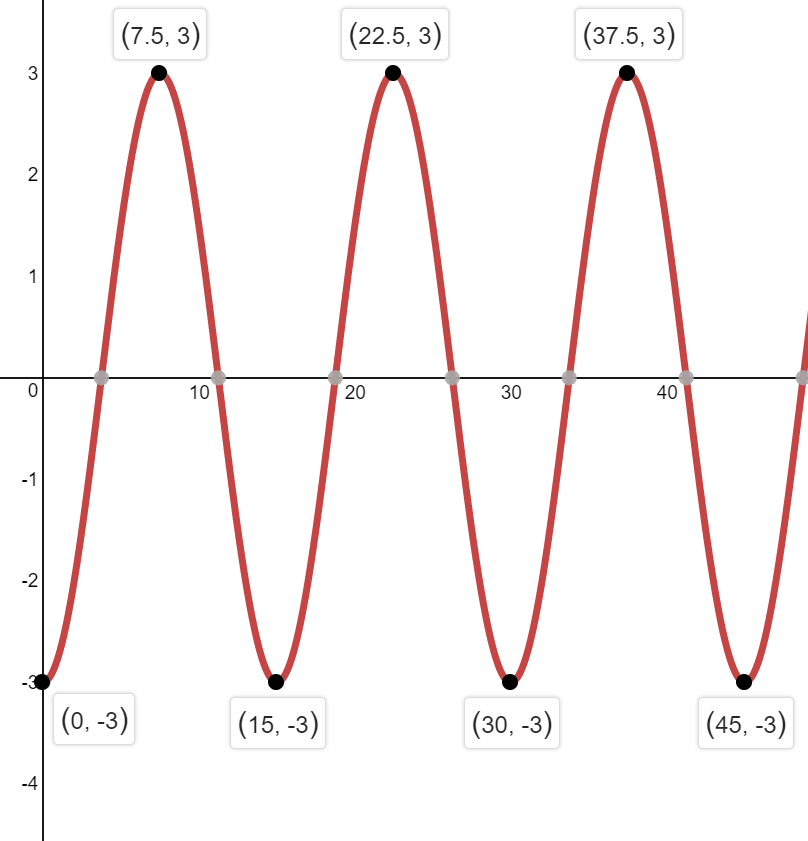
$T=dfrac{360}{72}=5$ s
c) The number of cycles in 1 min is
number of cycles = $dfrac{60text{s}}{5text{s per cycle}}= 12$ cycles
d) We can see this from the graph.
$|y_{max}-y_{min}|=|2.5-(-2.5)| = 5$ m
b) $5$ s
c) 12 cycles
d) 5 m
{mathbf{Useful}}{text{ }}{mathbf{Definitions}} hfill \
{text{equation of the axis: }},,y = frac{{{y_{max }} + {y_{min }}}}{2} hfill \
{text{amplitude: }}A = {text{ }}frac{{left| {{y_{max }} – {y_{min }}} right|}}{2} hfill \
{text{period}} = left| {{x_2} – {x_1}} right| hfill \
hfill \
{text{For a sinusoidal function}} hfill \
hfill \
y = Acos left( {kx} right) + B{text{ or }}y = Asin left( {kx} right) + B hfill \
hfill \
{text{amplitude = }}A hfill \
{text{period = }}T=frac{{{{360}^ circ }}}{k} hfill \
{text{equation of axis:}}{text{ }},,,y = B hfill \
end{gathered} ]

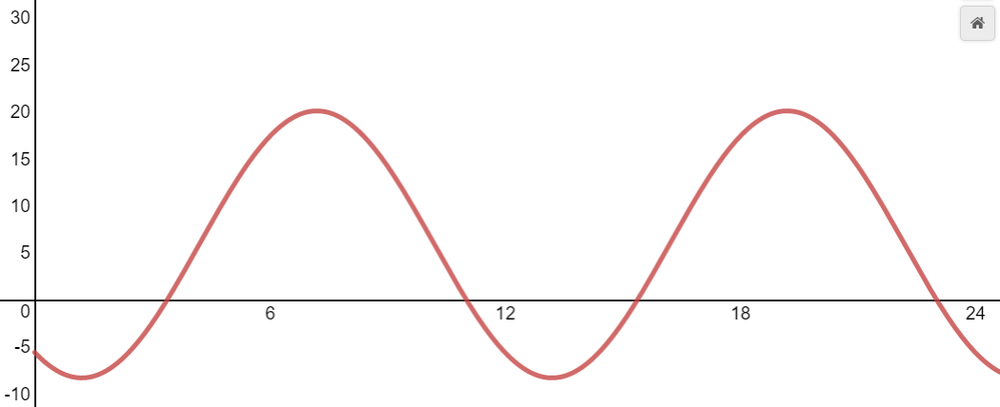
c) From the given function and the graph, $y_{min}=5.9-14.2=-8.3$ and $y_{max}=5.9+14.2=20.1$
Thus, the temperature in Kingston ranges from $-8.3^circ C$ to $20.1^circ C$.
d) The mean temperature is the temperature at the axis which is $5.9^circ C$.
e) $T(30)=14.2sin(30(30-4.2))^circ=17.39^circ C$
This is the temperature on 30$^{th}$ month which is around June.
b) one year cycle
c) $-8.3^circ C$ to $20.1^circ C$
d) $5.9^circ C$
e) $T(30)=17.39^circ C$
{mathbf{Useful}}{text{ }}{mathbf{Definitions}} hfill \
{text{equation of the axis: }},,y = frac{{{y_{max }} + {y_{min }}}}{2} hfill \
{text{amplitude: }}A = {text{ }}frac{{left| {{y_{max }} – {y_{min }}} right|}}{2} hfill \
{text{period}} = left| {{x_2} – {x_1}} right| hfill \
hfill \
end{gathered} ]
Ball A: $T=dfrac{24;text{s}}{3;text{cycles}}=8;s$ per cycle
Ball B: $T=dfrac{24;text{s}}{4;text{cycles}}=6;s$ per cycle
b) The equation of the axis is $d(t)=0$ which represents the position at resting point.
c) The amplitude is the distance from the resting point to peaks or trough.
Ball A: $A=4$
Ball B: $A=3$
The amplitude represents the maximum distance the ball travels from the resting position.
Ball A: ${ d(t) in bold{R};| -4leq d(t)leq 4}$
Ball B: ${ d(t) in bold{R};| -3leq d(t)leq 3}$
(1) amplitude
(2) equation of the axis
(3) period
(4) starting point
If $y_{min}$ and $y_{max}$ is given, you can calculate both the amplitude and the equation of the axis.
(2) equation of the axis
(3) period
(4) starting point
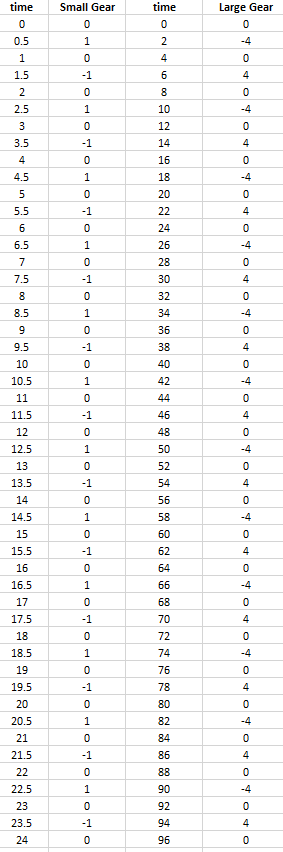
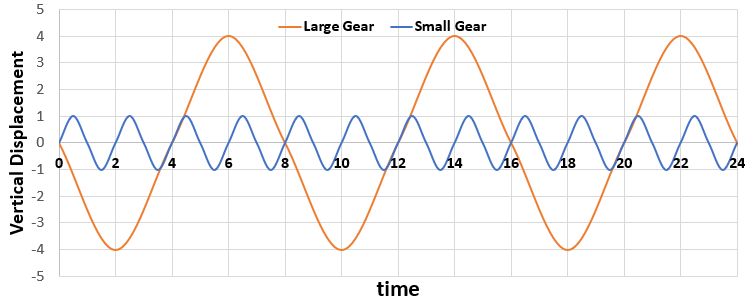
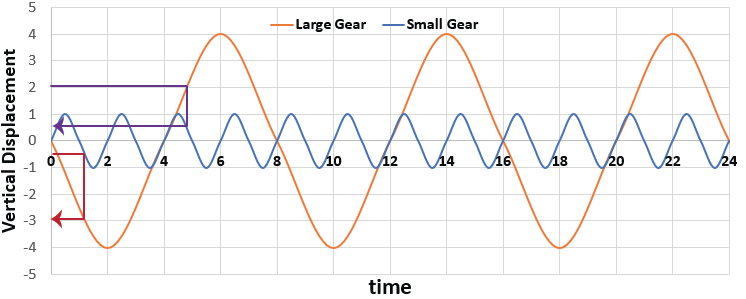
e) From the graph, when the large wheel has a displacement of $2$ m, the small wheel has displacement of $0.5$ m (shown in purple arrow).
b) 8 s
c) see table and graph
d) $-3$ m
e) $0.5$ m
f) $0$ m
