All Solutions
Page 40: Practice Questions
Range is $left{ 2,3,4,5right}$
The value 2 of the independent variable maps
to two different values 3 and 4 of the dependent variable
This relation is not a function.
Range is $left{ -1,1,3,4right}$
This relation is a function because each element of the domain corresponds with only one element in the range
Any vertical line drawn on the graph intersects the graph at only
one point. This is the graph of a function.
the graph intersects the graph at two points. This is not the graph of a function
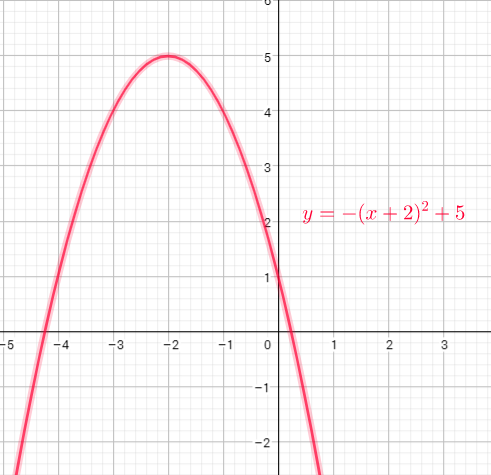
For example, if $x=4$, then $y=-(4-3)^{2}+5=-1^{2}+5=-1+5=4$
For example, if $x=13$, then $y=sqrt{13-4}=sqrt{9}=3$
b) function
c) function
d) not a function
e) function
f) function
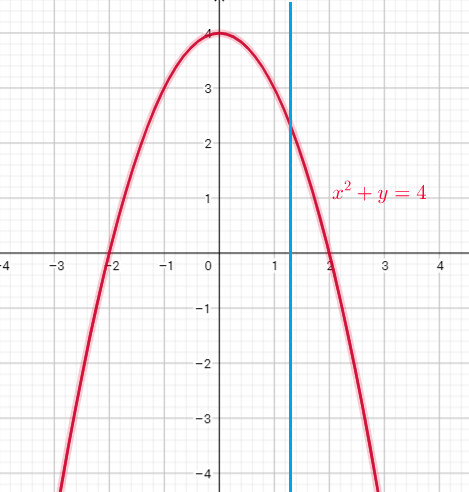
Substitute $x=0$ into equation $x^{2}+y=4$, now we get:
$0^{2}+y=4$
$0+y=4$
$y=4$
Substitute $x=-2$ into equation $x^{2}+y=4$, now we get:
$(-2)^{2}+y=4$
$4+y=4$
$y=4-4$
$y=0$
This is a function because for each value $x$ we get only one value of $y$.
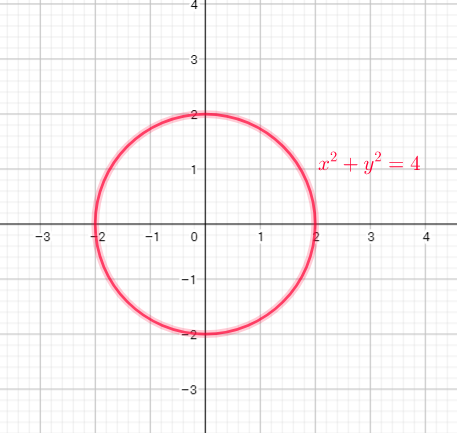
Substitute $x=0$ into equation $x^{2}+y^{2}=4$, now we get:
$0^{2}+y^{2}=4$
$y^{2}=4$
$y=pm sqrt{4}$
$y=pm2$
so, if $x=0$, then , $y=-2$ or $y=2$
Substitute $x=-2$ into equation $x^{2}+y^{2}=4$, now we get:
$(-2)^{2}+y^{2}=4$
$4+y^{2}=4$
$y^{2}=0$
$y=0$
This is a not a function because for $x=0$ we get two values of $y$
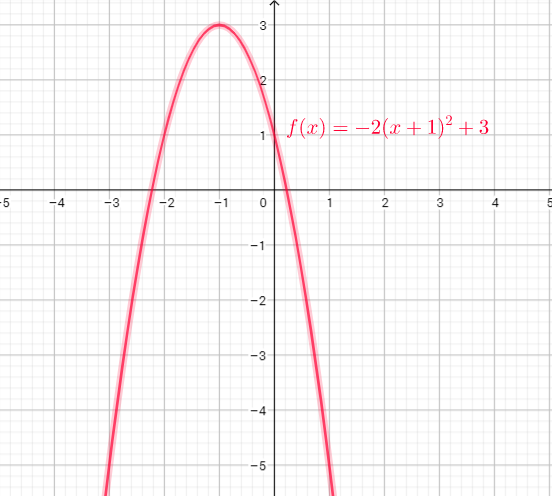
If $x=-3$, then
$f(-3)=-2(-3+1)^{2}+3=-2(-2)^{2}+3=-2cdot4+3=-8+3=-5$
That we can see from the graph: function passes through a point $(-3,-5)$
i) The first , we need determine $f(1)$ and $f(0)$
If $x=0$, then $f(0)=-2(0+1)^{2}+3=-2cdot1^{2}+3=-2+3=1$
If $x=1$, then $f(1)=-2(1+1)^{2}+3=-2cdot2^{2}+3=-8+3=-5$
Now, can determine:
$f(1)-f(0)=-5-1=-6$
ii) We need determine $f(2)$
If $x=2$, then $f(2)=-2(2+1)^{2}+3=-2cdot3^{2}+3=-18+3=-15$
Now can calculate:
$3cdot f(2)-5=3cdot(-15)-5=-45-5=-50$
iii) $f(2-x)=-2(2-x+1)^{2}+3=-2cdot(3-x)^{2}+3$
b) $-5$
c) $y$-coordinate on the graph corresponding to $x=-3$
d) i) $-6$ ii) $-50$ iii) $-2(3-x)^2+3$
Function is $f(x)=(20-5x)x$
$f(1)=(20-5cdot1)cdot1=(20-5)cdot1=15cdot1=15$
To find $f(-1)$ , plug in -1 wherever $x$ occures in the equation of $f(x)$ and simplify to get $f(-1)$
$f(-1)=(20-5cdot(-1))cdot(-1)=(20+5)cdot(-1)=25cdot(-1)=-25$
To find $f(7)$ , plug in 7 wherever $x$ occures in the equation of $f(x)$ and simplify to get $f(7)$
$f(7)=(20-5cdot7)cdot7=(20-35)cdot7=-15cdot7=-105$
Our quadratic function is $f(x)=(20-5x)x$ or $f(x)=-5x^{2}+20x$
There is $a=-5,$ and $b=20$. Now can calculate:
$dfrac{-b}{2a}=dfrac{-20}{2(-5)}=dfrac{-20}{-10}=2$
Now we need calculate $f(-dfrac{b}{2a})$:
$f(dfrac{-b}{2a})=f(2)=(20-5cdot2)cdot2=(20-10)cdot2=10cdot2=20$
Now can conclude: Quadratic function
$f(x)=(20-5x)x$ has maximum in the point $(2,20)$. That means, the maximum result possible is 20.
b) 15, $-25$, $-105$
c) 20
the set of y-values corresponding to these x-values
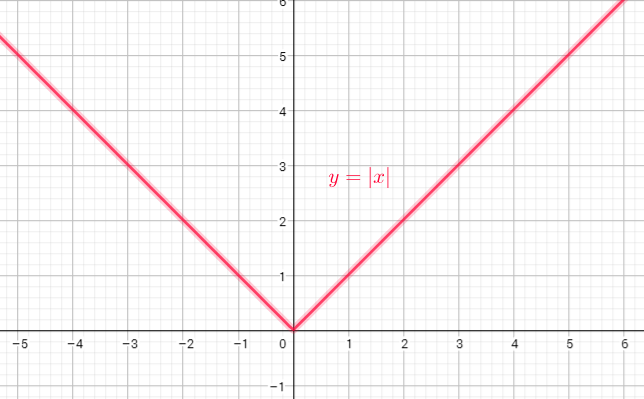
Domain =$left{xin R right}$
Range=$left{ yin R| ygeq0right}$
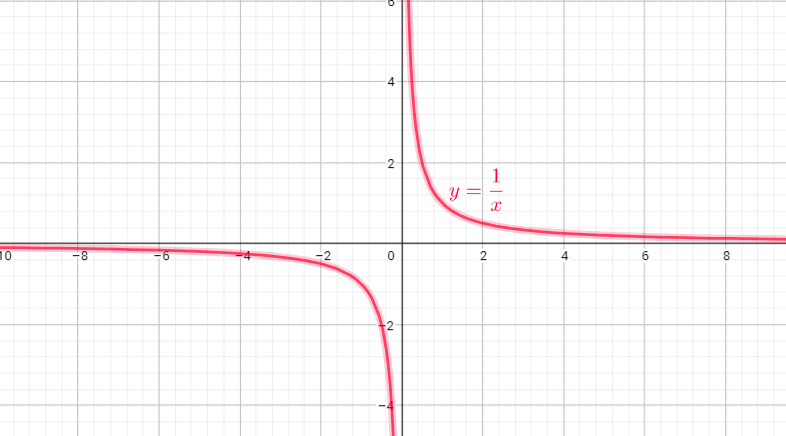
Domain =$left{xin R | xne 0right}$
Range=$left{ yin R| yne0 right}$
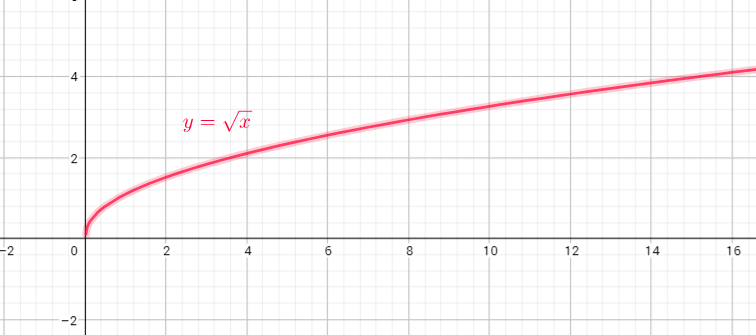
Domain=$left{ xin R| xgeq0right}$
Range=$left{ yin R| ygeq0right}$
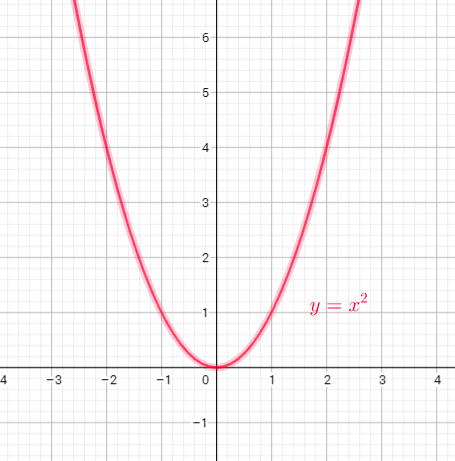
Domain=$left{ xin Rright}$
Range=$left{ yin R| ygeq0right}$
range = ${ yin bold{R};|;ygeq 0}$
b) domain = ${ xinbold{R};|;xneq 0}$
range = ${ yinbold{R};|;yneq 0}$
c) domain = ${ xinbold{R};|;xgeq 0}$
range = ${ yinbold{R};|;ygeq 0}$
d) domain = ${xinbold{R}}$
range = ${ yinbold{R};|;ygeq 0}$
the set of y-values corresponding to these x-values.
Domain=$left{ 1,2,4right}$
Range=$left{ 2,3,4,5right}$
Domain=$left{ -2,0,3,7right}$
Range=$left{-1,1,3,4 right}$
Domain=$left{ -4,-3,-2,-1,0,1,2,3,4,5right}$
Range=$left{ -4,-3,-2,-1,0,1,2,3,4,5right}$
Domain=$left{ xin R| xgeq-3right}$
Range=$left{yin Rright}$
Domain=$left{xin R right}$
Range=$left{ yin R| yleq5right}$
Domain=$left{ xin R| xgeq4right}$
Range=$left{yin R| ygeq0 right}$
b) domain = ${$ -2, 0, 3, 7 $}$ , range = ${$ $-1$, 1, 3, 4 $}$
c) domain = ${ -4$, $-3$, $-2$, $-1$, 0, 1, 2, 3, 4, 5 $}$
range = ${ -4$, $-3$, $-2$, $-1$, 0, 1, 2, 3, 4, 5 $}$
d) domain = ${ xinbold{R};|;xgeq -3}$ ,
range = ${yinbold{R}}$
e) domain = ${ xinbold{R}}$ , range = ${ yinbold{R};|;yleq 5}$
f) domain = ${ xinbold{R};|;xgeq 4}$, range = ${ yinbold{R};|;ygeq 0}$
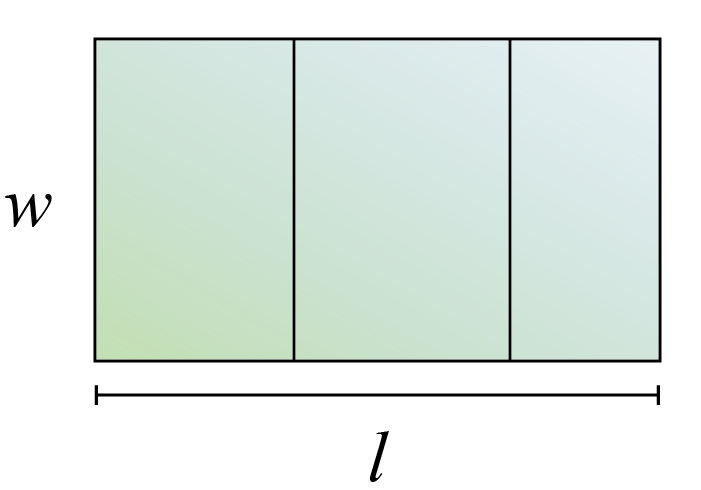
$4w+2l=600$
Express $l$ in terms of $w$
$l=dfrac{600-4w}{2}$
The area of a rectangle is $ltimes w$
$A=lw$
$A=left( dfrac{600-4w}{2}right)w$
$$
A=w(300-2w)
$$
We also know that both width $w$ and area $A$ must be more than zero. The upper limit can be obtained from the graph.
domain = ${ winbold{R};|;0<w<150}$
range = ${ Ainbold{R};|;0<Aleq 11,250}$
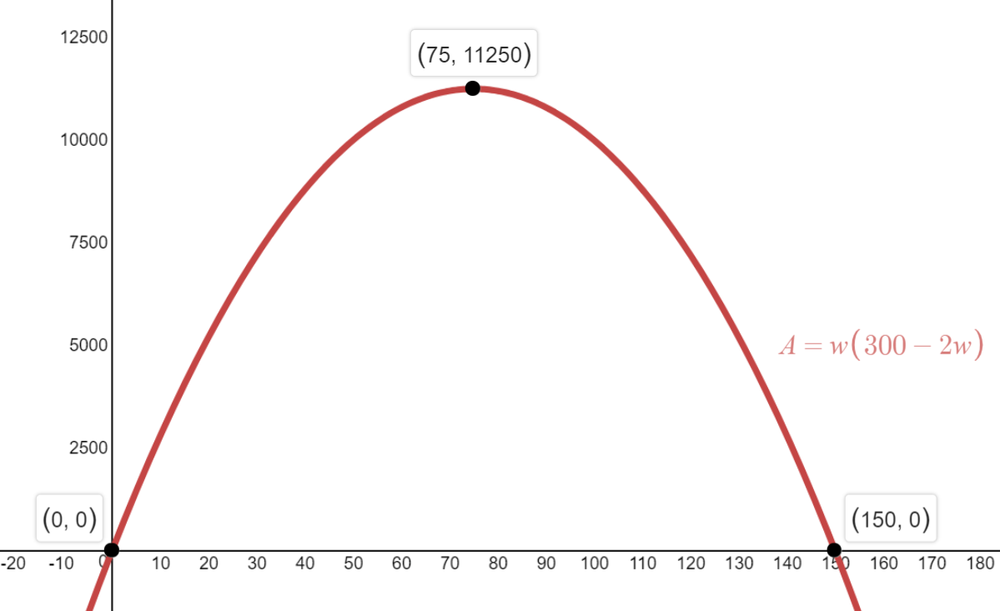
This corresponds to
$l=dfrac{600-4w}{2}=300-2w=(300-2times 75)=150$ m
b) domain = ${ winbold{R};|;0<w<150}$
range = ${ Ainbold{R};|;0<Aleq 11,250}$
c) $l=150$ m , $w=75$ m
Domain=$left{ xin Rright}$
Range=$left{ yin R| yleq5right}$
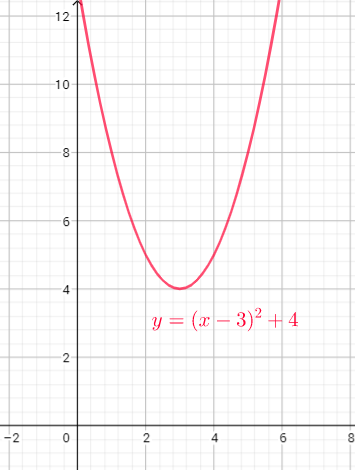
Domain=$left{xin R right}$
Range=$left{ yin R| ygeq4right}$
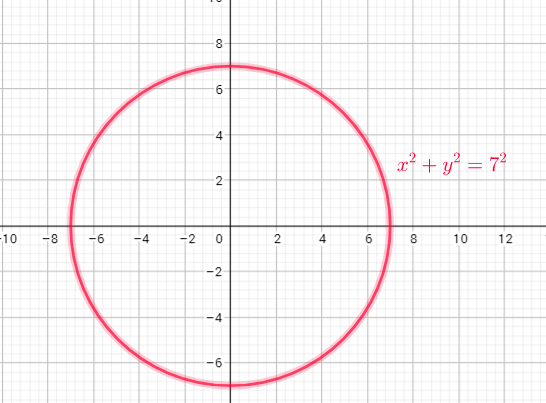
Range=$left{ yin R|-7leq yleq7 right}$
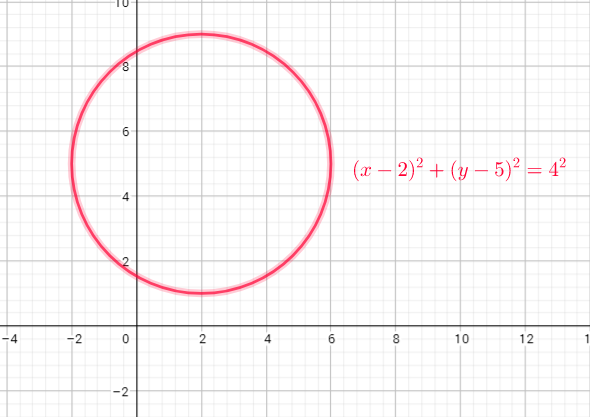
Range=$left{ yin R|1leq yleq9 right}$
b) domain = ${ xinbold{R}}$ , range = ${ yinbold{R};|;ygeq 4}$
c) domain = ${ xinbold{R};|;-7leq xleq 7}$
range = ${ yinbold{R};|;-7leq yleq 7}$
d) domain = ${ xinbold{R};|;-2leq xleq 6}$
range = ${ yinbold{R};|;1leq y leq 9}$
