
All Solutions
Page 70: Check Your Understanding
defarraystretch{1.5}%
begin{tabular}{|l|l|}
hline
Transformation & Description \ hline
$y=f(x)+c$ & begin{tabular}[c]{@{}l@{}}vertical translation of\ $c$ units upwardend{tabular} \ hline
$y=f(x+d)$ & begin{tabular}[c]{@{}l@{}}horizontal translation of $d$ units\ to the leftend{tabular} \ hline
$y=acdot f(x)$ & begin{tabular}[c]{@{}l@{}}vertical stretching by a factor of $a$end{tabular} \ hline
$y=f(kx)$ & begin{tabular}[c]{@{}l@{}}horizontal compression by $dfrac{1}{|k|}$end{tabular} \ hline
$y=-f(x)$ & begin{tabular}[c]{@{}l@{}}reflecting the function in\ the $x$-axisend{tabular} \ hline
$y=f(-x)$ & begin{tabular}[c]{@{}l@{}}reflecting the function in \ the $y$-axisend{tabular} \ hline
end{tabular}
end{table}
B: reflection in $y$-axis
C: horizontal compression by a factor of $dfrac{1}{3}$
D: horizontal translation 2 units to the right
E: vertical translation 4 units up
B: reflection in $y$-axis
C: horizontal compression by a factor of $dfrac{1}{3}$
D: horizontal translation 2 units to the right
E: vertical translation 4 units up
A-Multiplies the y-coordinates by 5
B-Multiplies the x-coordinates by -1
C-Divides the x-coordinates by 3
D-Add 2 to the x-coordinate
E=Add 4 to the y-coordinate
defarraystretch{1.5}%
begin{tabular}{|l|l|}
hline
Transformation & Description \ hline
$y=f(x)+c$ & begin{tabular}[c]{@{}l@{}}vertical translation of\ $c$ units upwardend{tabular} \ hline
$y=f(x+d)$ & begin{tabular}[c]{@{}l@{}}horizontal translation of $d$ units\ to the leftend{tabular} \ hline
$y=acdot f(x)$ & begin{tabular}[c]{@{}l@{}}vertical stretching by a factor of $a$end{tabular} \ hline
$y=f(kx)$ & begin{tabular}[c]{@{}l@{}}horizontal compression by $dfrac{1}{|k|}$end{tabular} \ hline
$y=-f(x)$ & begin{tabular}[c]{@{}l@{}}reflecting the function in\ the $x$-axisend{tabular} \ hline
$y=f(-x)$ & begin{tabular}[c]{@{}l@{}}reflecting the function in \ the $y$-axisend{tabular} \ hline
end{tabular}
end{table}
Multiply the $y$-coordinates by 5 $implies$ vertical stretching by factor 5 $implies$ A
Multiply the $x$-coordinates by $-1implies$ reflecting in $y$-axis $implies$ B
Add $4$ to $y$-coordinate : E
Add 2 to $x$-coordinate : D
Multiply the $y$-coordinates by 5 : A
Multiply the $x$-coordinates by : B
Add $4$ to $y$-coordinate : E
Add 2 to $x$-coordinate : D
2) we need divide the x-coordinate of point (1,1) on $f(x)$ by 3 to compress the graph horizontally by the factor $dfrac{1}{3}$ and then reflect in the y-axis so point is $(-dfrac{1}{3},1)$
3) we need divide the x-coordinate of point (1,1) on $f(x)$ by 3 to compress the graph horizontally by the factor $dfrac{1}{3}$, reflect in the y-axis and vertical stretch by a factor of 5, so point is $(-dfrac{1}{3},5)$
4) The graph $f(x)$ is is translated 2 units right, compressed horizontally by the factor $dfrac{1}{3}$ and reflected in the y-axis, then
graph is stretched vertically by the factor 5, and finally translated 4 units up, so point is $(dfrac{5}{3},9)$

defarraystretch{3.2}%
begin{tabular}{|c|c|c|c|c|}
hline
$f(x)$ & $f(3x)$ & $f(-3x)$ & $5f(-3x)$ & $5f{[}-3(x-2){]}+4$ \ hline
$(1,1)$ & $left(dfrac{1}{3},1right)$ & $left(-dfrac{1}{3},1right)$ & $left(-dfrac{1}{3},5right)$ & $left(1dfrac{2}{3}, 9right)$ \ hline
end{tabular}
end{table}
b) translation 2 units to the right and 3 units up
c) horizontal compression by factor $dfrac{1}{2}$ then translation 5 units down
d) reflection in $x$-axis, horizontal stretch by factor 2 and translation 2 units down
e) vertical compression by factor $dfrac{2}{3}$, translation 3 units to the left and 1 unit up
f) vertical stretch by factor 4, reflection in $y$-axis and translation 4 units down
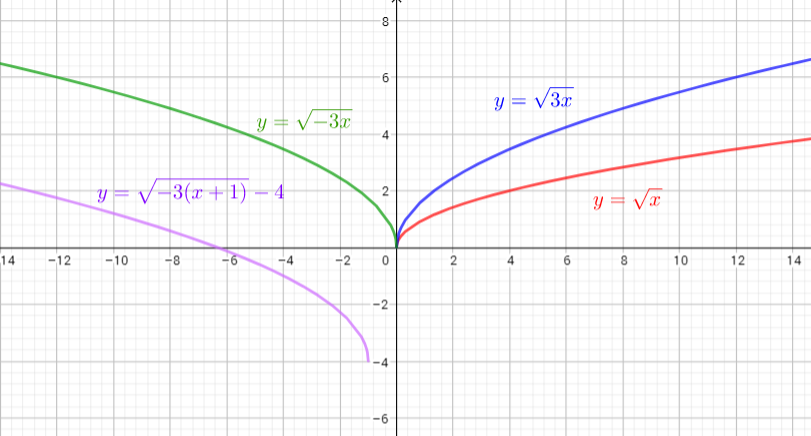
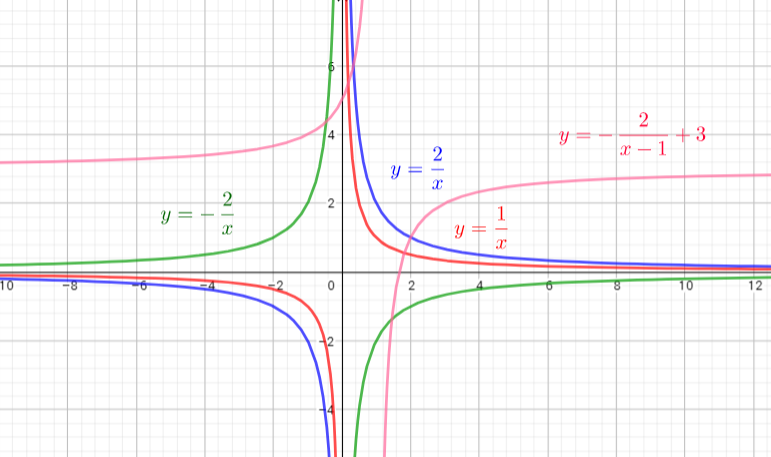
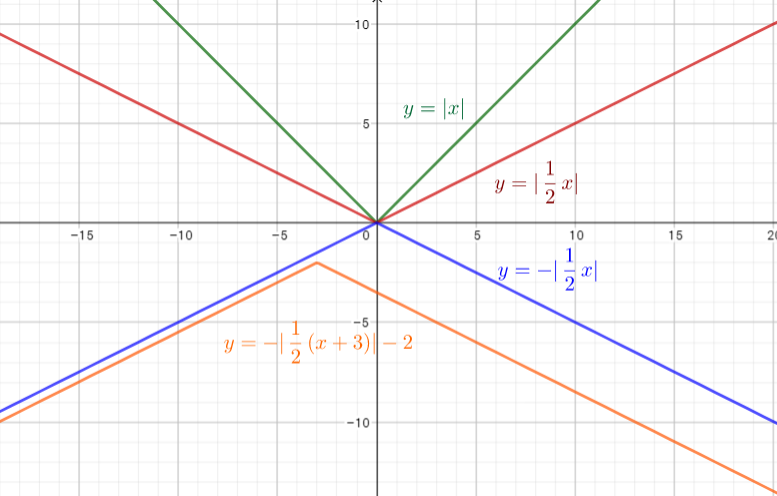
a) see graph: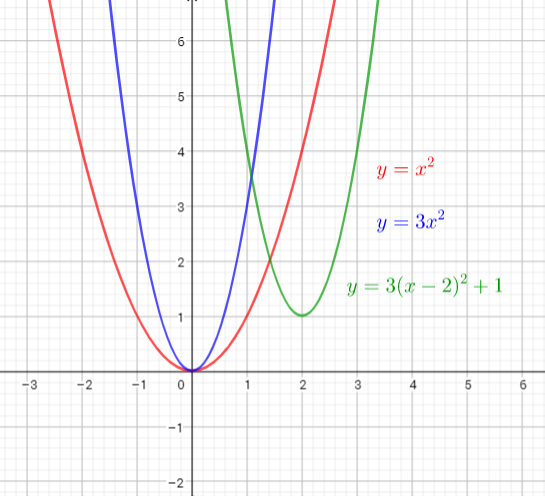
defarraystretch{1.5}%
begin{tabular}{|l|l|}
hline
Transformation & Description \ hline
$y=f(x)+c$ & begin{tabular}[c]{@{}l@{}}vertical translation of\ $c$ units upwardend{tabular} \ hline
$y=f(x+d)$ & begin{tabular}[c]{@{}l@{}}horizontal translation of $d$ units\ to the leftend{tabular} \ hline
$y=acdot f(x)$ & begin{tabular}[c]{@{}l@{}}vertical stretching by a factor of $a$end{tabular} \ hline
$y=f(kx)$ & begin{tabular}[c]{@{}l@{}}horizontal compression by $dfrac{1}{|k|}$end{tabular} \ hline
$y=-f(x)$ & begin{tabular}[c]{@{}l@{}}reflecting the function in\ the $x$-axisend{tabular} \ hline
$y=f(-x)$ & begin{tabular}[c]{@{}l@{}}reflecting the function in \ the $y$-axisend{tabular} \ hline
end{tabular}
end{table}
translation 4 units to the left $implies y=fleft(dfrac{1}{3}(x+4)right)$
b) reflection in $y$-axis $implies y=f(-x)$
vertical stretching by factor 2 $implies y=2f(-x)$
translation 3 units to the right and 1 unit up $implies y=2f(-(x-3))+1$
c) horizontal compression by factor $dfrac{1}{2}implies y=f(2x)$
reflection in $x$-axis $implies y=-f(2x)$
vertical stretching by factor 3 $implies y=-3f(2x)$
translation 1 unit to the right and 3 units down $implies y=-3f(2(x-1))-3$
translation 4 units to the left
b) reflection in $y$-axis
vertical stretching by factor 2
translation 3 units to the right and 1 unit up
c) horizontal compression by factor $dfrac{1}{2}$
reflection in $x$-axis
vertical stretching by factor 3
translation 1 unit to the right and 3 units down
$text{textcolor{#4257b2}{Domain}}$ of a function is the set of input values for which the function is defined
$text{textcolor{#4257b2}{The range}}$ is the resulting $y$-values we get after substituting all the possible $x$-values
We can identify the domain and range of functions is by using graphs. Because the domain refers to the set of possible input values, the domain of a graph consists of all the input values shown on the x-axis. The range is the set of possible output values, which are shown on the y-axis.
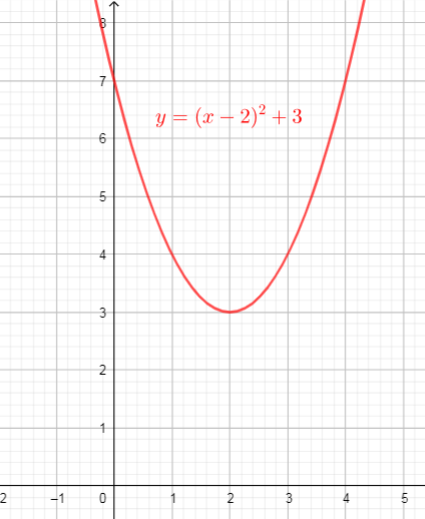
From the graph we can conclude that:
$text{textcolor{#4257b2}{Domain}}$ of the function is interval : $(-infty,+infty)$
$text{textcolor{#4257b2}{Range}}$ of the function is interval: $[3,+infty)$
$$
begin{align*}
y&=-f(dfrac{1}{4}(x+1))+2 \
&=-(dfrac{1}{4}(x+1))^{2}+2 tag{text{replace $x$ with $dfrac{1}{4}(x+1)$}}\
&=-dfrac{1}{16}(x+1)^{2}+2 \
end{align*}
$$
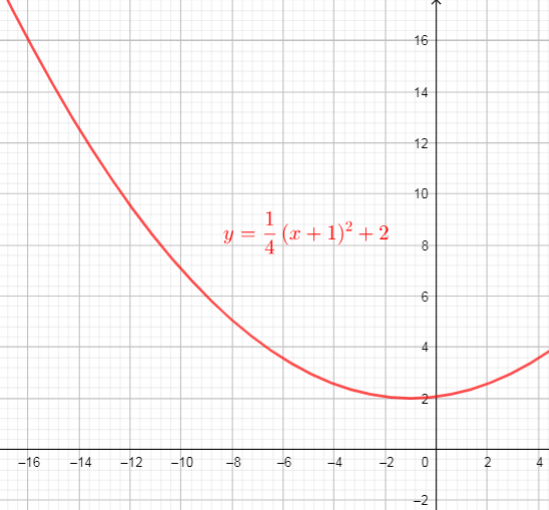
From the graph we can conclude that:
$text{textcolor{#4257b2}{Domain}}$ of the function is interval : $(-infty,+infty)$
$text{textcolor{#4257b2}{Range}}$ of the function is interval: $[2,+infty)$
$$
begin{align*}
y&=0.5f(3(x-4))-1 \
&=0.5(3(x-4))^{2}-1 tag{text{replace $x$ with $3(x-4)$}}\
&=0.5cdot9(x-4)^{2}-1 \
&=4.5(x-4)^{2}-1\
&=dfrac{9}{2}(x-4)^{2}-1\
end{align*}
$$
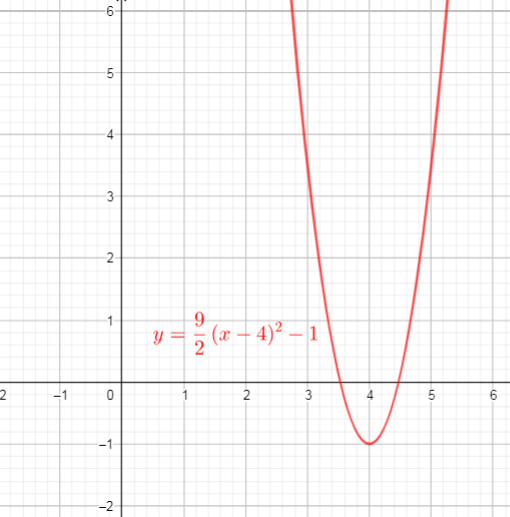
From the graph we can conclude that:
$text{textcolor{#4257b2}{Domain}}$ of the function is interval : $(-infty,+infty)$
$text{textcolor{#4257b2}{Range}}$ of the function is interval: $[-1,+infty)$
b) Domain: $(-infty,+infty)$ , Range: $[2,+infty)$
c) Domain: $(-infty,+infty)$ , Range: $[-1,+infty)$
$text{textcolor{#4257b2}{Domain}}$ of a function is the set of input values for which the function is defined
$text{textcolor{#4257b2}{The range}}$ is the resulting $y$-values we get after substituting all the possible $x$-values
We can identify the domain and range of functions is by using graphs. Because the domain refers to the set of possible input values, the domain of a graph consists of all the input values shown on the x-axis. The range is the set of possible output values, which are shown on the y-axis.
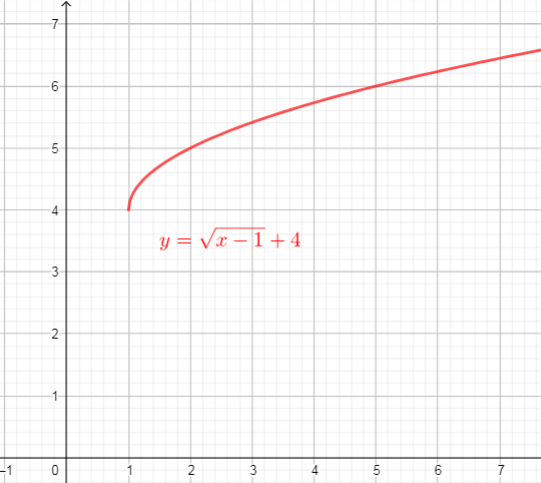
From the graph we can conclude that:
$text{textcolor{#4257b2}{Domain}}$ of the function is interval : $[1,+infty)$
$text{textcolor{#4257b2}{Range}}$ of the function is interval: $[4,+infty)$
$$
begin{align*}
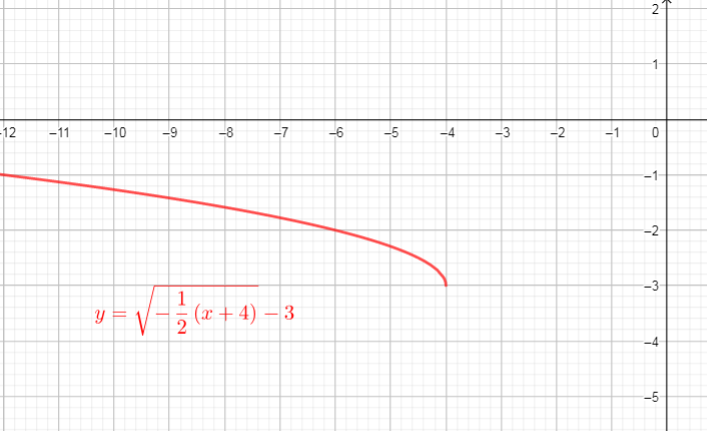
y&=f(-dfrac{1}{2}(x+4))-3 \
&=sqrt{-dfrac{1}{2}(x+4)}-3 tag{text{replace $x$ with $-dfrac{1}{2}(x+4)$}}\
end{align*}
$$
From the graph we can conclude that:
$text{textcolor{#4257b2}{Domain}}$ of the function is interval : $(-infty,-4]$
$text{textcolor{#4257b2}{Range}}$ of the function is interval: $[-3,+infty)$
$$
begin{align*}
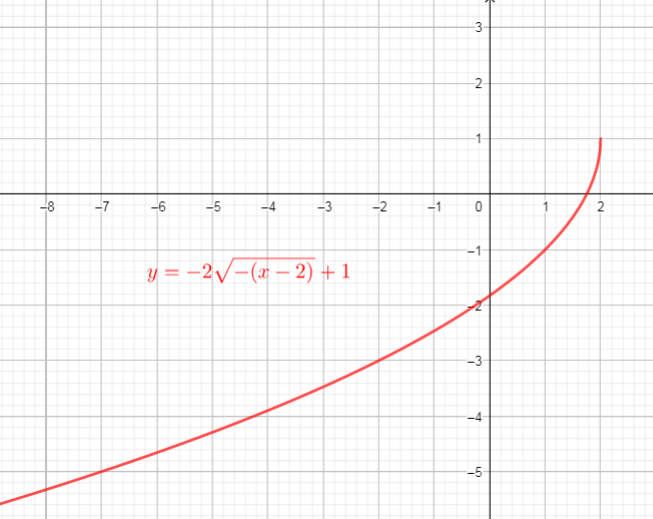
y&=-2f(-(x-2))+1 \
&=-2sqrt{-(x-2)}+1 tag{text{replace $x$ with $-(x-2)$}}\
end{align*}
$$
From the graph we can conclude that:
$text{textcolor{#4257b2}{Domain}}$ of the function is interval : $(-infty,2]$
$text{textcolor{#4257b2}{Range}}$ of the function is interval: $(-infty,1)$
b) Domain: $(-infty,-4]$, Range:$[-3,+infty)$
c) Domain: $(-infty,2]$, Range:$(-infty,1)$
$text{textcolor{#4257b2}{Domain}}$ of a function is the set of input values for which the function is defined
$text{textcolor{#4257b2}{The range}}$ is the resulting $y$-values we get after substituting all the possible $x$-values
We can identify the domain and range of functions is by using graphs. Because the domain refers to the set of possible input values, the domain of a graph consists of all the input values shown on the x-axis. The range is the set of possible output values, which are shown on the y-axis.
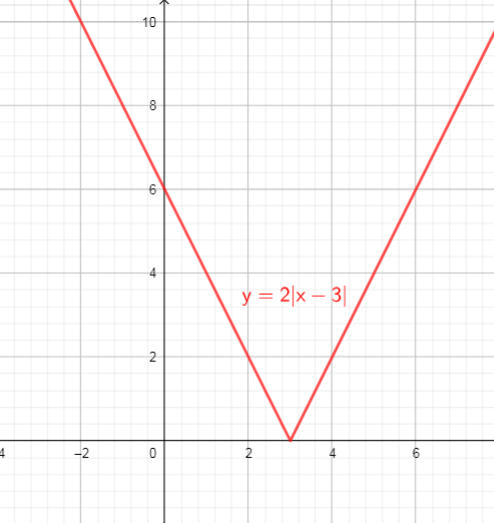
From the graph we can conclude that:
$text{textcolor{#4257b2}{Domain}}$ of the function is interval : $(-infty,+infty)$
$text{textcolor{#4257b2}{Range}}$ of the function is interval: $[0,+infty)$
$$
begin{align*}
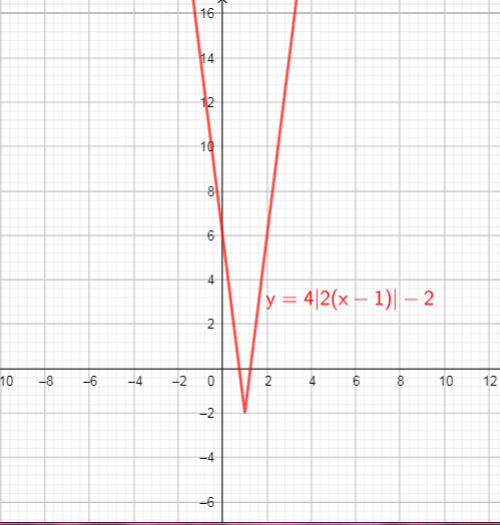
y&=4f(2(x-1))-2 \
&=4|2(x-1)|-2 tag{text{replace $x$ with $2(x-1)$}}\
end{align*}
$$
From the graph we can conclude that:
$text{textcolor{#4257b2}{Domain}}$ of the function is interval : $(-infty,+infty)$
$text{textcolor{#4257b2}{Range}}$ of the function is interval: $[-2,+infty)$
$$
begin{align*}
y&=-dfrac{1}{2}f(3(x+2))+4 \
&=-dfrac{1}{2}|3(x+2)|+4 tag{text{replace $x$ with $3(x+2)$}}\
end{align*}
$$
From the graph we can conclude that:
$text{textcolor{#4257b2}{Domain}}$ of the function is interval : $(-infty,+infty)$
$text{textcolor{#4257b2}{Range}}$ of the function is interval: $(-infty,4]$
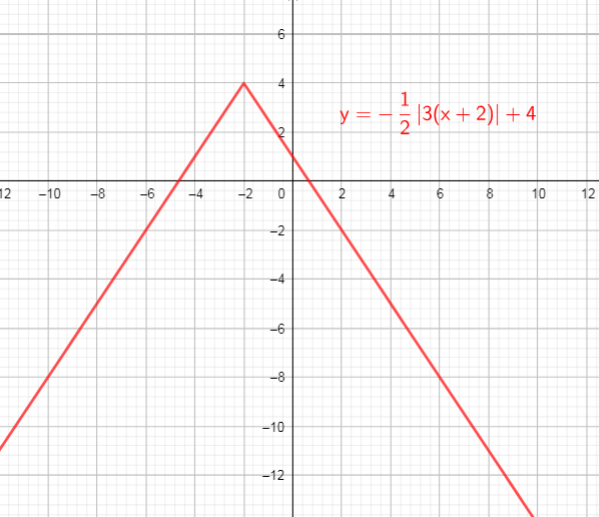
b) domain = ${ xinbold{R}}$ , range = ${ yinbold{R};|;ygeq -2}$
c) domain = ${ xinbold{R}}$ , range = ${ yinbold{R};|;ygeq 4}$
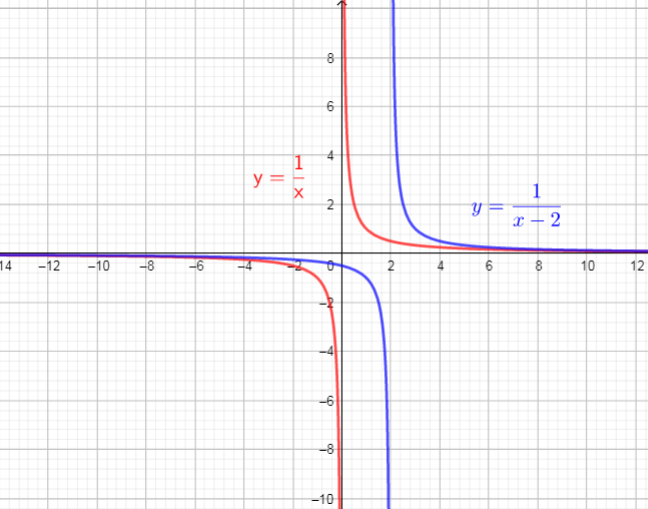
The graph of $f(x)$ will horizontally shift to the right 2 units
So, there are used translation right 2 units
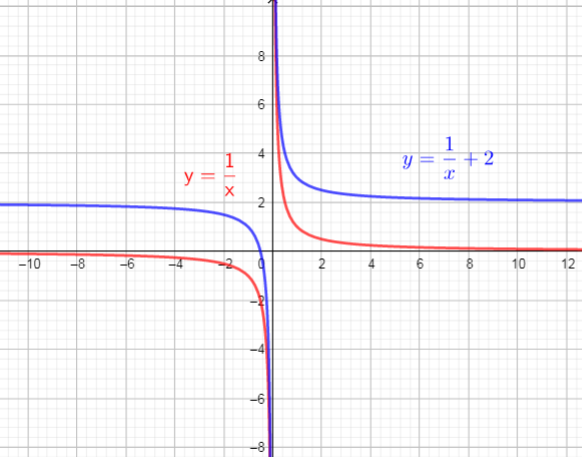
The graph of $f(x)$ will vertically shift upward by 2 units
So, there are used translation up 2 units
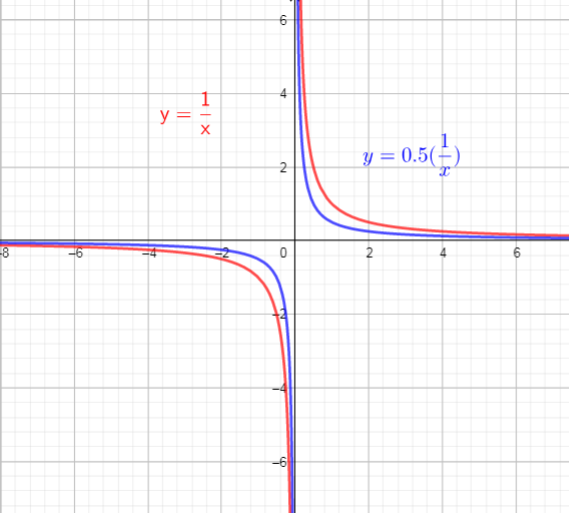
The graph of $f(x)$ will compresses vertically by factor of 0.5.
So, there are used vertical compression, by factor of 0.5
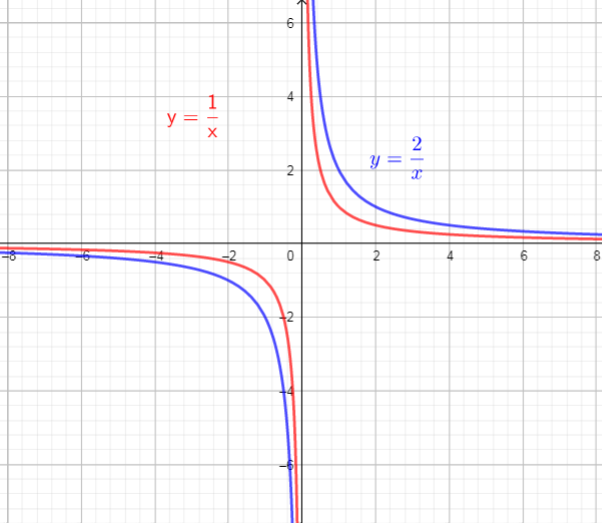
$y=2cdotdfrac{1}{x}$
The graph of $f(x)$ will stretches vertically by factor of 2.
So, there are used vertical stretch, by factor of 2
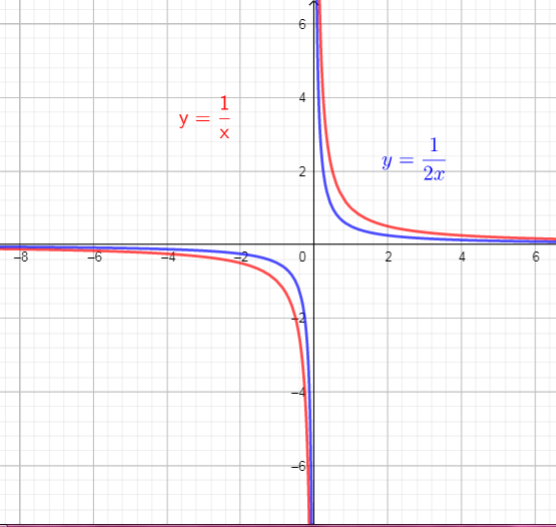
The graph of $f(x)$ will compresses horizontaly by factor of $dfrac{1}{2}=0.5$.
So, there are used horizontal compression, by factor of 0.5
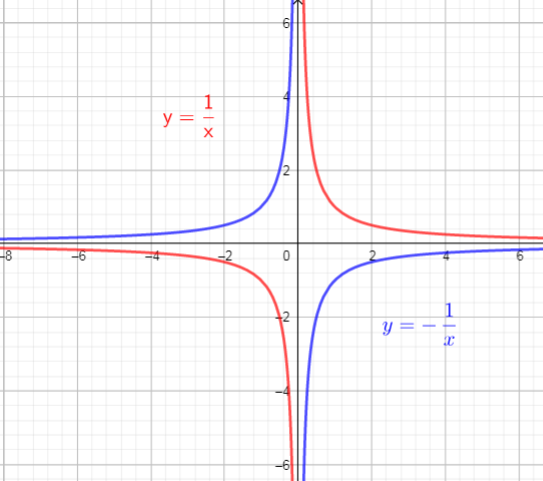
The graph of $f(x)$ is reflected across the x-axis.
So, there is used reflection across the x-axis.
b) vertical translation 2 units upward
c) vertical compression by factor $dfrac{1}{2}$
d) vertical stretching by factor 2
e) horizontal compression by factor $dfrac{1}{2}$
f) reflection in $x$-axis
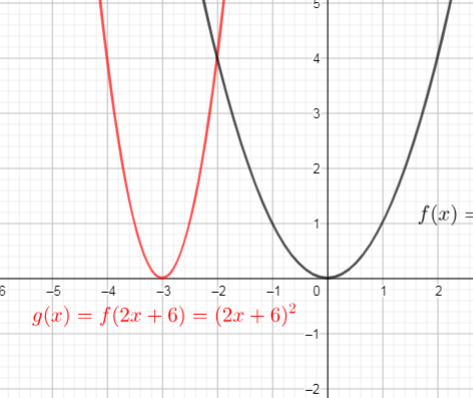
$$
begin{align*}
g(x)&=f(2x+6) \
&=(2x+6)^{2} tag{text{replace $x$ with $2x+6$}}\
end{align*}
$$
$$
begin{align*}
h(x)&=f(-3x-12) \
&=sqrt{-3x-12} tag{text{replace $x$ with $-3x-12$}}\
end{align*}
$$
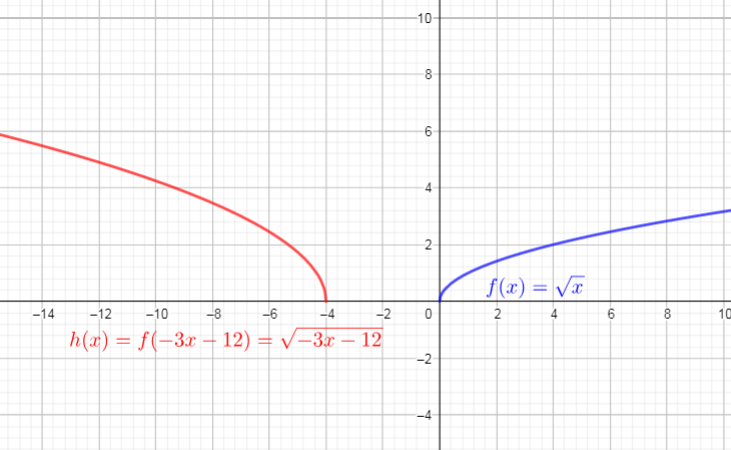
$$
begin{align*}
p(x)&=f(4x+8)\
&=|4x+8| tag{text{replace $x$ with $4x+8$}}\
end{align*}
$$
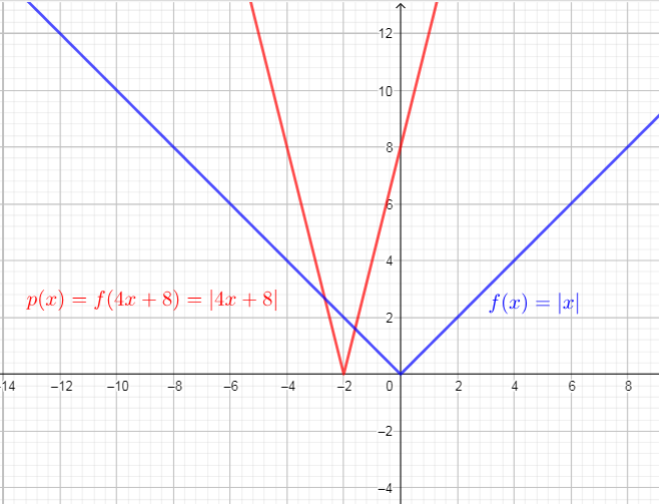
defarraystretch{1.5}%
begin{tabular}{|l|l|}
hline
Transformation & Description \ hline
$y=f(x)+c$ & begin{tabular}[c]{@{}l@{}}vertical translation of\ $c$ units upwardend{tabular} \ hline
$y=f(x+d)$ & begin{tabular}[c]{@{}l@{}}horizontal translation of $d$ units\ to the leftend{tabular} \ hline
$y=acdot f(x)$ & begin{tabular}[c]{@{}l@{}}vertical stretching by a factor of $a$end{tabular} \ hline
$y=f(kx)$ & begin{tabular}[c]{@{}l@{}}horizontal compression by $dfrac{1}{|k|}$end{tabular} \ hline
$y=-f(x)$ & begin{tabular}[c]{@{}l@{}}reflecting the function in\ the $x$-axisend{tabular} \ hline
$y=f(-x)$ & begin{tabular}[c]{@{}l@{}}reflecting the function in \ the $y$-axisend{tabular} \ hline
end{tabular}
end{table}
$T(s)=dfrac{20}{s}implies$ vertical stretching by factor 20
$T(s)=dfrac{15}{s-3}implies$ vertical stretching by factor 15 then translation 3 units to the right
$T(s)=dfrac{15}{s-3}implies$ vertical stretching by factor 15 then translation 3 units to the right
then, stretched vertically by the factor 3 $longrightarrow$ $g_{2}(x)=3sqrt{-x}$
then translated 5 units right $longrightarrow$ $g_{3}(x)=3sqrt{-(x-5)}$
then translated 2 units down $longrightarrow$ $g_{4}(x)=3sqrt{-(x-5)}-2$
Use these steps, we get new function $textcolor{#4257b2}{h(x)=3g(-(x-5))-2=3sqrt{-(x-5)}-2}$
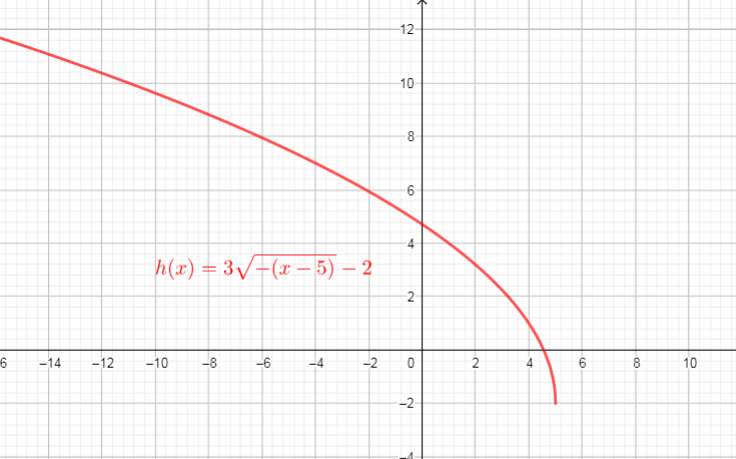
See graph
then, stretched vertically by the factor 3 $longrightarrow$ $y_{2}=3f(-x)$
then translated up 2 units $longrightarrow$ $y_{3}=3f(-x)+2$
then translated 1 units left $longrightarrow$ $y_{4}=3f(-(x+1))+2$
$text{Use these steps we get new function: $textcolor{#4257b2}{h(x)=3f(-(x+1))+2}$}$
text{Equation of the new function is: $h(x)=3f(-(x+1))+2$}
$$
Parent function of this given function is $y=dfrac{1}{x}$
The graph of a function may be transformed using:
horizontal shift which shifts the graph 2 units to the right and verticaly shift 1 unit up, vertical stretch of 3, reflection in the x-axis.
Use these steps we get given function $y=dfrac{3}{-(x-2)}+1$, it corresponds to $text{textcolor{#4257b2}{Graph C}}$
Parent function of this given function is $y=|x|$.
The graph of $y=2|x-3|-2$ is stretched vertically by the factor 2, and then translated 2 units down units and 3 unit right.
Using these transformation we get function $y=2|x-3|-2$, it corresponds to $text{textcolor{#4257b2}{Graph E}}$.
Parent function of this given function is $y=sqrt{x}$.
The graph of $y=sqrt{x}$ is reflected across the y-axis, stretched vertically by the factor 2, and then translated 3 units left and 2 units down
It corresponds to $text{textcolor{#4257b2}{graph A}}$.
Parent function of this given function is $y=x^{2}$
The graph of $y=x^{2}$ is translated down 3 units and 2 units right.
It corresponds to $text{textcolor{#4257b2}{graph G}}$
Parent function of this function is $y=dfrac{1}{x}$
The graph of $y=dfrac{1}{x}$ is reflected in one of the axes and translated 3 units down.
It corresponds to $text{textcolor{#4257b2}{graph F}}$.
Parent function of this function is $y=|x|$
The graph of $y=|x|$ is reflected acros the y-axis, translated 4 units left and 2 units down.
It corresponds to $text{textcolor{#4257b2}{Graph D}}$
Parent function of this function is $y=sqrt{x}$
The graph of $y=sqrt{x}$ is reflected across x-axis and y-axis, stretched vertically by the factor 0.5, translated 1 unit right and 1 unit up.
It corresponds to $text{textcolor{#4257b2}{Graph H}}$
$text{Parent function of this function is $y=x^{2}$}$
The graph of $y=x^{2}$ is reflected in the y-axis, stretched vertically by the factor $dfrac{1}{2}$ ,and then translated 4 units left and 1 unit up.
It corresponds to $text{textcolor{#4257b2}{Graph B}}$
b) $longrightarrow$ Graph E
c) $longrightarrow$ Graph A
d) $longrightarrow$ Graph G
e) $longrightarrow$ Graph F
f) $longrightarrow$ Graph D
g) $longrightarrow$ Graph H
h) $longrightarrow$ Graph B
We need determine $a, k, c$ and $d$.
The graph of $f(x)=sqrt{x}$ is stretched vertically by the factor 2 $longrightarrow$ $y=2sqrt{x}$
then translated 4 units right $longrightarrow$ $y=2sqrt{x-4}$
and then reflected in the x-axis $longrightarrow$ $y=-2sqrt{x-4}$
Use these steps, we get new function $textcolor{#4257b2}{y=-2g(x-4)=-2sqrt{x-4}}$
If we compare this function with $y=af[k(x-d)]+c$, we can conclude that:
$a=-2, k=1, c=0, d=4$
We can identify the domain and range of functions is by using graphs. Because the domain refers to the set of possible input values, the domain of a graph consists of all the input values shown on the x-axis. The range is the set of possible output values, which are shown on the y-axis.
From the graph we can conclude that:
$text{textcolor{#4257b2}{Domain}}$ of the function is interval : $[4,+infty)$
$text{textcolor{#4257b2}{Range}}$ of the function is interval: $(-infty,0)$
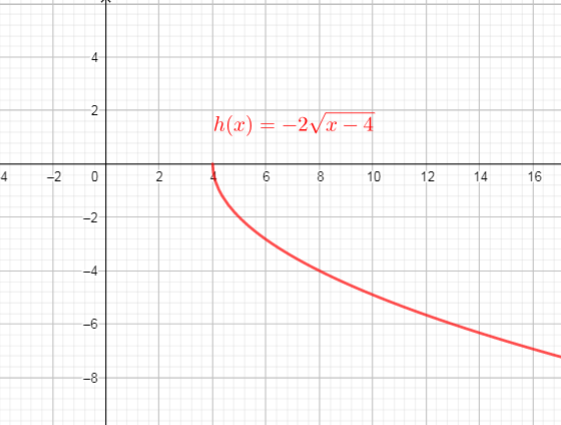
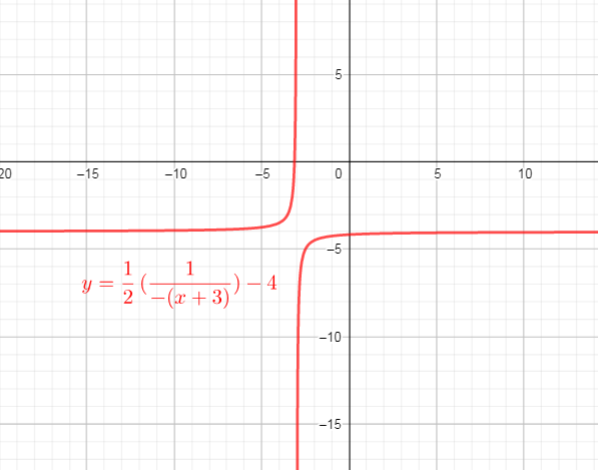
We need determine $a, k, c$ and $d$.
The graph of $f(x)=dfrac{1}{x}$ is compressed vertically by the factor 2 $longrightarrow$ $y=dfrac{1}{2x}$
then reflecred in the y-axis $longrightarrow$ $y=dfrac{1}{2}(dfrac{1}{-x})$
then translated 3 units left $longrightarrow$ $y=dfrac{1}{2}(dfrac{1}{-(x+3)})$
and thentranslated 4 units down $longrightarrow$ $y=dfrac{1}{2}(dfrac{1}{-(x+3)})-4$
Use these steps, we get new function $y=dfrac{1}{2}f(-(x+3))-4$
If we compare this function with $y=af[k(x-d)]+c$, we can conclude that:
$a=dfrac{1}{2}, k=-1, c=-4, d=-3$
We can identify the domain and range of functions is by using graphs. Because the domain refers to the set of possible input values, the domain of a graph consists of all the input values shown on the x-axis. The range is the set of possible output values, which are shown on the y-axis.
From the graph we can conclude that:
$text{textcolor{#4257b2}{Domain}}$ of the function is interval $left{xin R|xne-3 right}$:
$text{textcolor{#4257b2}{Range}}$ of the function is interval:$left{yin R|yne-4 right}$
We need determine $a, k, c$ and $d$.
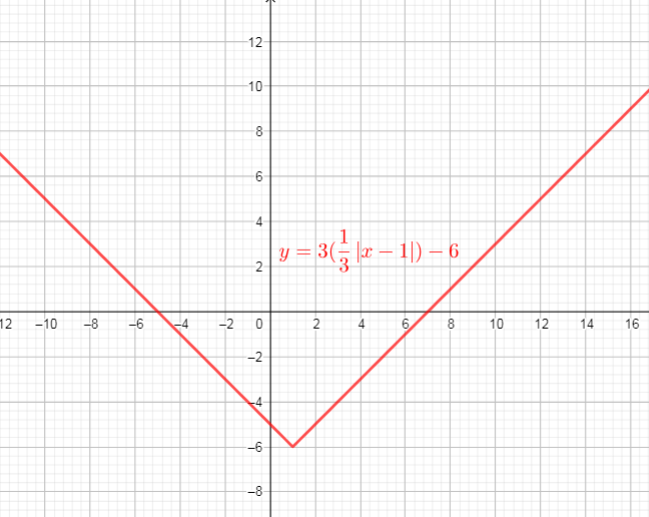
The graph of $f(x)=|x|$ is compressed horizontaly by the factor $dfrac{1}{3}$ $longrightarrow$ $y=dfrac{1}{3}|x|$
then, verticaly streched by the factor 3 $longrightarrow$ $y=3(dfrac{1}{3}|x|)$
then translated 1 units right $longrightarrow$ $y=3(dfrac{1}{3}|x-1|)$
and then translated 6 units down $longrightarrow$ $y=3(dfrac{1}{3}|x-1|)-6$
Use these steps, we get new function $y=3f(dfrac{1}{3}|x-1|)-6$
If we compare this function with $y=af[k(x-d)]+c$, we can conclude that:
$a=3, k=dfrac{1}{3}, c=-6, d=1$
We can identify the domain and range of functions is by using graphs. Because the domain refers to the set of possible input values, the domain of a graph consists of all the input values shown on the x-axis. The range is the set of possible output values, which are shown on the y-axis.
From the graph we can conclude that:
$text{textcolor{#4257b2}{Domain}}$ of the function is interval : $(-infty,+infty)$
$text{textcolor{#4257b2}{Range}}$ of the function is interval: $[-6,+infty)$
defarraystretch{1.8}%
begin{tabular}{|l|l|}
hline
a) & begin{tabular}[c]{@{}l@{}}$a=-2$, $k=1$, $c=0$, $d=4$\ domain = ${ xinbold{R};|;xgeq 4}$\ range = ${ yinbold{R};|;yleq 0}$end{tabular} \ hline
b) & begin{tabular}[c]{@{}l@{}}$a=dfrac{1}{2}$ , $k=-1$, $c=-3$, $d=-4$\ domain = ${ xinbold{R};|;xneq -3}$\ range = ${ yinbold{R};|;yneq -4}$end{tabular} \ hline
c) & begin{tabular}[c]{@{}l@{}}$a=3$ , $k=dfrac{1}{3}$ , $c=-6$, $d=1$\ domain = ${ xinbold{R}}$\ range = ${ yinbold{R};|;ygeq -6}$end{tabular} \ hline
end{tabular}
end{table}
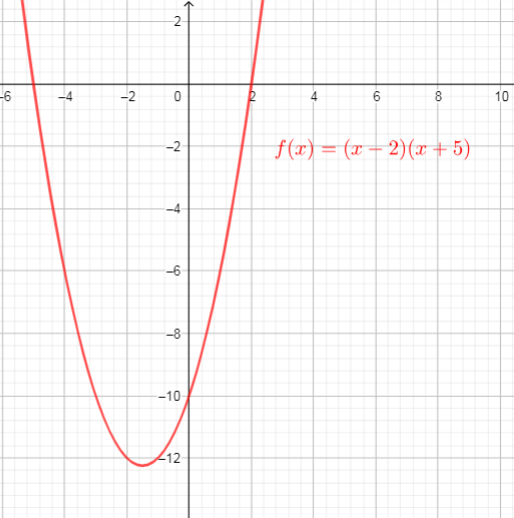
Algebraic, an x-intercept is a point on the graph where y is zero,
$text{If $f(x)=(x-2)(x+5)$, we need determine x-intercepts}$.
Using the definitions of the intercepts, we will proceed as follows:
$text{$y = 0$ for the x-intercepts, so}$
$$
begin{align*}
y&=0\
(x-2)&(x+5)=0\
x-2=0 &lor x+5=0\
x=2 &lor x=-5\
end{align*}
$$
$text{Then the x-intercepts are the points $(2,0)$ and $(-5,0)$}$
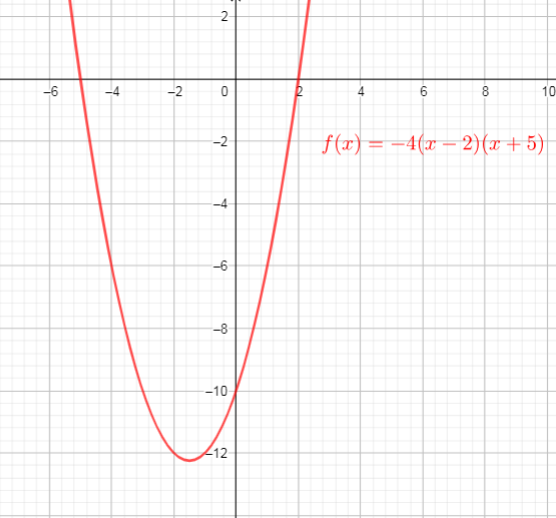
$text{$y = 0$ for the x-intercepts, so}$
$$
begin{align*}
y&=0\
-4(x-2)&(x+5)=0\
x-2=0 &lor x+5=0\
x=2 &lor x=-5\
end{align*}
$$
$text{Then the x-intercepts are the points $(2,0)$ and $(-5,0)$}$
We can conclude that: the x-intercepts are the same as in part a)
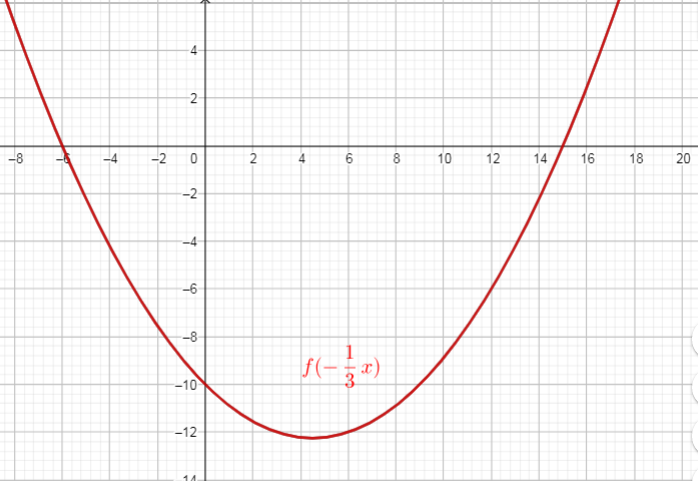
$y=f(-dfrac{1}{3}x)=(-dfrac{1}{3}x-2)(-dfrac{1}{3}x+5)$ ($text{replace $x$ with $-dfrac{1}{3}x$}$)
$text{$y = 0$ for the x-intercepts, so}$
$$
begin{align*}
y&=0\
(-dfrac{1}{3}x-2)&(-dfrac{1}{3}x+5)=0\
-dfrac{1}{3}-2=0 &lor -dfrac{1}{3}x+5=0\
-dfrac{1}{3}x=2 &lor -dfrac{1}{3}x=-5 tag{text{multiply both sides of equation by -3}}\
x=-6 & lor x=15\
end{align*}
$$
$text{Then the x-intercepts are the points $(-6,0)$ and $(15,0)$}$
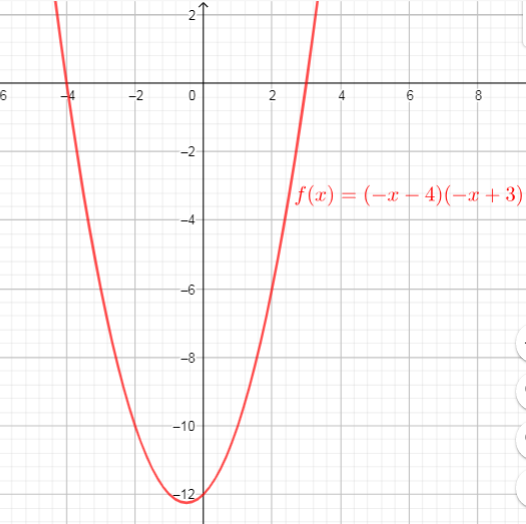
$$
begin{align*}\
y&=f(-(x+2))\
&=(-(x+2)-2)(-(x+2)+5)\
&=(-x-2-2)(-x-2+5)\
&=(-x-4)(-x+3) (text{replace $x$ with $-(x+2)$})\
end{align*}
$$
$text{$y = 0$ for the x-intercepts, so}$
$$
begin{align*}
y&=0\
(-x-4)&(-x+3)=0\
-x-4=0 &lor -x+3=0\
-x=4 &lor -x=-3 tag{text{multiply both sides of equation by -1}}\
x=-4 & lor x=3\
end{align*}
$$
$text{Then the x-intercepts are the points $(-4,0)$ and $(3,0)$}$
b) $(2,0)$ and $(-5,0)$
c) $(-6,0)$ and $(10,0)$
a) $(-4,0)$ and $(3,0)$
defarraystretch{1.5}%
begin{tabular}{|l|l|}
hline
Transformation & Description \ hline
$y=f(x)+c$ & begin{tabular}[c]{@{}l@{}}vertical translation of\ $c$ units upwardend{tabular} \ hline
$y=f(x+d)$ & begin{tabular}[c]{@{}l@{}}horizontal translation of $d$ units\ to the leftend{tabular} \ hline
$y=acdot f(x)$ & begin{tabular}[c]{@{}l@{}}vertical stretching by a factor of $a$end{tabular} \ hline
$y=f(kx)$ & begin{tabular}[c]{@{}l@{}}horizontal compression by $dfrac{1}{|k|}$end{tabular} \ hline
$y=-f(x)$ & begin{tabular}[c]{@{}l@{}}reflecting the function in\ the $x$-axisend{tabular} \ hline
$y=f(-x)$ & begin{tabular}[c]{@{}l@{}}reflecting the function in \ the $y$-axisend{tabular} \ hline
end{tabular}
end{table}
(1) horizontally compress by a factor of $dfrac{1}{|k|}implies y=f(kx)$
if $k<0$, also reflect in the $y$-axis
(2) vertically stretch by a factor of $aimplies y=acdot f(kx)$
if $a<0$, also reflect in the $x$-axis
(3) horizontally translate $d$ units to the right $implies y=acdot f(k(x-d))$
if $d<0$, translate to the left
(4) vertically translate $c$ units up $implies y=acdot f(k(x-d))+c$
if $c<0$, translate downwards
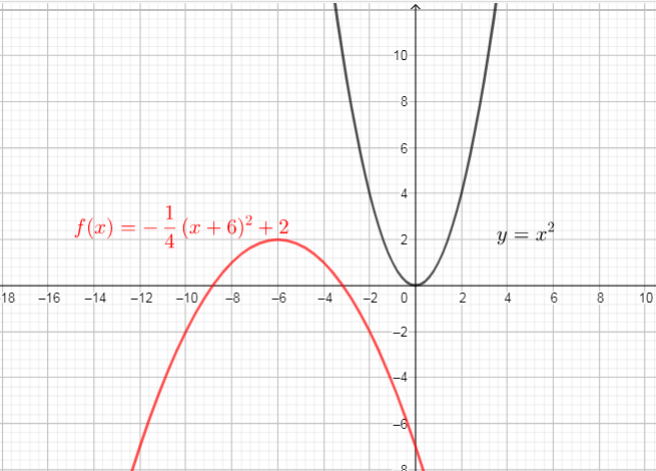
$text{then, scompressed vertically by the factor $dfrac{1}{4}$ $longrightarrow$ $y=-dfrac{1}{4}x^{2}$}$
$text{then translated 6 units left $longrightarrow$ $y=-dfrac{1}{4}(x+6)^{2}$}$
$text{then translated 2 units up $longrightarrow$ $y=-dfrac{1}{4}(x+6)^{2}+2$}$
$$
text{Use these steps, we get new function $textcolor{#4257b2}{y=-dfrac{1}{4}(x+6)^{2}+2}$}
$$
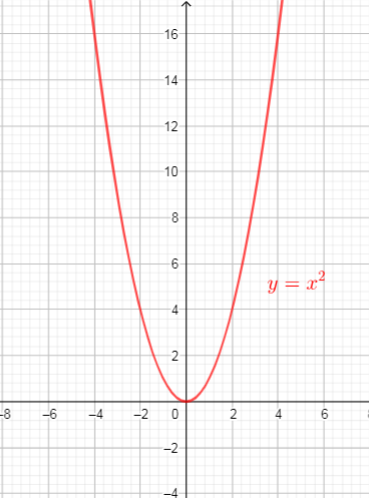
$text{The domain of a function is the set of all real values of $x$ that will give real values for $y$, domain is interval $(-infty, +infty)$}$
$text{The range of a function is the set of all real values of $y$ that we can get by plugging real numbers into $x$, so, range is interval $[0,+infty)$}$
We can identify the domain and range of functions is by using graphs.
Because the domain refers to the set of possible input values, the domain of a graph consists of all the input values shown on the x-axis
The range is the set of possible output values, which are shown on the y-axis.
$text{The domain of a function is the set of nonegative real values of $x$ that will give real values for $y$, domain is interval $[0, +infty)$}$
$text{The range of a function is the set of all real values of $y$ that we can get by plugging real numbers into $x$, so, range is interval $[0,+infty)$}$
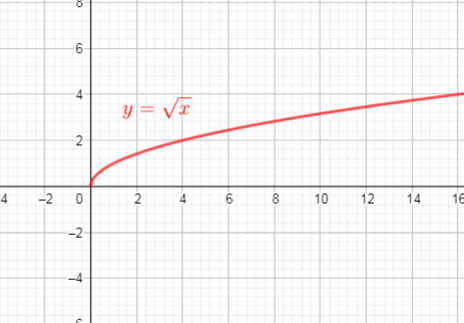
$text{ graph of $g(x)$ is only an upper half-parabola.}$
Reflect the right-half of $f(x)$ with respect to the line $y=x$

