All Solutions
Section 2-1: Determining Average Rate of Change
#### (a)
$dfrac{g(4)-g(2)}{4-2}=dfrac{(4cdot16-5cdot4+1)-(4cdot4-5cdot2+1)}{2}=dfrac{45-7}{2}=19$
#### (b)
$dfrac{g(3)-g(2)}{3-2}=dfrac{(4cdot9-5cdot3+1)-(4cdot4-5cdot2+1)}{1}=22-7=15$
#### (c)
$dfrac{g(2.5)-g(2)}{2.5-2}=dfrac{(4cdot6.25-5cdot2.5+1)-(4cdot4-5cdot2+1)}{0.5}=dfrac{13.5-7}{0.5}=13$
#### (d)
$dfrac{g(2.25)-g(2)}{2.25-2}=dfrac{(4cdot5.06-5cdot2.25+1)-(4cdot4-5cdot2+1)}{0.25}=dfrac{9.99-7}{0.25}=11.96$
$dfrac{g(2.1)-g(2)}{2.1-2}=dfrac{(4cdot4.41-5cdot2.1+1)-(4cdot4-5cdot2+1)}{0.1}=dfrac{8.14-7}{0.1}=11.4$
#### (f)
$dfrac{g(2.01)-g(2)}{2.01-2}=dfrac{(4cdot4.04-5cdot2.01+1)-(4cdot4-5cdot2+1)}{0.01}=dfrac{7.11-7}{0.01}=11$
$textbf{The average rate of change in the height of the flare
during each given interval is}$:
(i)$textbf{average rate of change}$ = $dfrac{42-27}{2-1}=15m$
So, in this interval, the average rate of change in the height is $15m$.
(ii)$textbf{average rate of change}$ = $dfrac{42-47}{4-3}=5m$
So, in this interval, the average rate of change in the height is $5m$.
#### (b)
According to results from (a), the height of the flare during each of those two intervals $textbf{decreased $3$ times in average}$.
$textbf{average rate of change}$ = $dfrac{6.193-0.807}{3.193+2.193}=dfrac{5.386}{5.386}=1$
So,we have a $textbf{positive average rate of change}$, which indicates that the quantity represented by the dependent variable is increasing on
the specified interval, compared with the quantity represented by the independent variable. Graphically, this is
indicated by a secant line that has a positive slope.
Here we have next:
$0.0leq{t}leq0.5$, $textbf{average rate of change}$ = $dfrac{176-0}{0.5-0}=352$
$0.5leq{t}leq1$, $textbf{average rate of change}$ = $dfrac{245-176}{1-0.5}=138$
$1leq{t}leq1.5$, $textbf{average rate of change}$ = $dfrac{388-245}{1.5-1}=286$
$1.5leq{t}leq2$, $textbf{average rate of change}$ = $dfrac{402-388}{2-1.5}=28$
$2leq{t}leq2.5$, $textbf{average rate of change}$ = $dfrac{432-402}{2.5-2}=60$
$2.5leq{t}leq3$, $textbf{average rate of change}$ = $dfrac{415-432}{3-2.5}=-34$
#### (b)
$textbf{The average rate of change}$ is the change in the quantity represented by the dependent variable, here is number of people, divided by the
corresponding change in the quantity represented by the independent variable, here is time in hours, over an interval.
#### (c)
$textbf{A positive average rate of change}$ indicates that the number of people,which is dependent variable in this case, is increasing on the specified interval, compared with the quantity represented by the number of hours, which is independent variable in this case.
$textbf{A negative average rate of change}$ indicates that the number of people, which is dependent variable in this case, is decreasing on the specified interval, compared with the quantity represented by the number of hours, which is independent variable in this case.
$0leq{t}leq1$, $textbf{average rate of change}$ = $dfrac{203-0}{1-0}=203$
$1leq{t}leq2$, $textbf{average rate of change}$ = $dfrac{396-203}{2-1}=193$
$2leq{t}leq3$, $textbf{average rate of change}$ = $dfrac{561-396}{3-2}=165$
$3leq{t}leq4$, $textbf{average rate of change}$ = $dfrac{739.5-561}{4-3}=178.5$
$4leq{t}leq5$, $textbf{average rate of change}$ = $dfrac{958-739.5}{5-4}=218.5$
$5leq{t}leq6$, $textbf{average rate of change}$ = $dfrac{1104-958}{6-5}=146$
#### (b)
No, we can see that from average change of rate, it isn’t same for each consecutive days, which means that $textbf{every day Tour de France race doesn’t travel over the same distance}$.
$textbf{average change of rate}$ = $dfrac{24-8}{6-2}=4$, on the interval $left[2,6 right]$.
Now, for $x=26$, value of the function is $f(x)=4cdot{26}=104$, and the average change of rate on interval $left[2,26 right]$ is:
$textbf{average change of rate}$ = $dfrac{104-8}{26-2}=4$.
$textbf{We can see that average rate of change over those two different intervals is the constant}$. It’s because all linear relationships have a constant rate of change.
For $m>250$ we have that $textbf{average rate of change is positive}$, which means that the monthly cell phone bill is increasing when the minutes she talks increase.
(i) $textbf{average rate of change}$ = $dfrac{20-5}{20-0}=dfrac{15}{20}=0.75$
(ii)$textbf{average rate of change}$ = $dfrac{80-20}{40-20}=dfrac{60}{20}=3$
(iii)$textbf{average rate of change}$ = $dfrac{320-80}{60-40}=dfrac{240}{20}=12$
(iv)$textbf{average rate of change}$ = $dfrac{320-5}{60-0}=dfrac{315}{60}=5.25$
#### (b)
$textbf{No, it isn’t constant}$, we can see that from part (a).
#### (c)
$textbf{We have to assume that on every ten years, number of people is twice bigger than previous ten years}$, on that way we can predict number of people in $2050$, if we use results given in the table in this task.
$$
begin{align*}
textbf{average rate of change}&=dfrac{18cdot15-0.8cdot15^2-left(18cdot10-0.8cdot10^2 right)}{15-10}\
&=dfrac{270-180-180+80}{5}\
&=-dfrac{10}{5}\
&=-2\
end{align*}
$$
-2
$$
(i)
$$
begin{align*}
textbf{average rate of change} &= dfrac{-0.3cdot4+3.5cdot2+11.15-left(-0.3cdot1+3.5cdot1+11.15 right)}{2-1}\
&=dfrac{-1.2+7+0.3-3.5}{1}\
&=2.6\
end{align*}
$$
(ii)
$$
begin{align*}
textbf{average rate of change} &= dfrac{-0.3cdot9+3.5cdot3+11.15-left(-0.3cdot4+3.5cdot2+11.15 right)}{3-2}\
&=dfrac{-2.7+10.5+1.2-7}{1}\
&=2\
end{align*}
$$
(iii)
$$
begin{align*}
textbf{average rate of change} &= dfrac{-0.3cdot16+3.5cdot4+11.15-left(-0.3cdot9+3.5cdot3+11.15 right)}{4-3}\
&=dfrac{-4.8+14+2.7-10.5}{1}\
&=1.4\
end{align*}
$$
(iv)
$$
begin{align*}
textbf{average rate of change} &= dfrac{-0.3cdot25+3.5cdot5+11.15-left(-0.3cdot16+3.5cdot4+11.15 right)}{5-4}\
&=dfrac{-7.5+17.5+4.8-14}{1}\
&=0\
end{align*}
$$
$textbf{Average rate of change in profit decreases}$, it means that this mo9del of profit isn’t good because if number of sold sweatshirts increases, the profit is lower and lower, which is not good for company.
#### (c)
$textbf{The rate of change in profit will not stay positive}$, it will be negative, which means that the profit will be lower and lower, as we explained in part (b).
Here we have $textbf{graph}$ of $P(t)$:

$textbf{The average rate of change in the population size will be
greater farther in the future}$, we can see that from the graph in pasrt (a), this function is increasing.
#### (c)
(i) $textbf{average rate of change}$ = $dfrac{P(10)-P(0)}{10-0}=dfrac{35000-20000}{10}=1500$
(ii) $textbf{average rate of change}$ = $dfrac{P(12)-P(2)}{12-2}=dfrac{39200-22200}{10}=1700$
(iii)$textbf{average rate of change}$ = $dfrac{P(15)-P(5)}{15-5}=dfrac{46250-26250}{10}=2000$
(iv)$textbf{average rate of change}$ = $dfrac{P(20)-P(10)}{20-10}=dfrac{60000-35000}{20-10}=2500$
#### (d)
The prediction was $textbf{correct}$.
#### (a)
Someone might calculate the average increase in the price of gasoline over time. One might calculate the average decrease in the price of computers over time.
#### (b)
An average rate of change would be useful when there are several different rates of change over a specific interval.
#### (c)
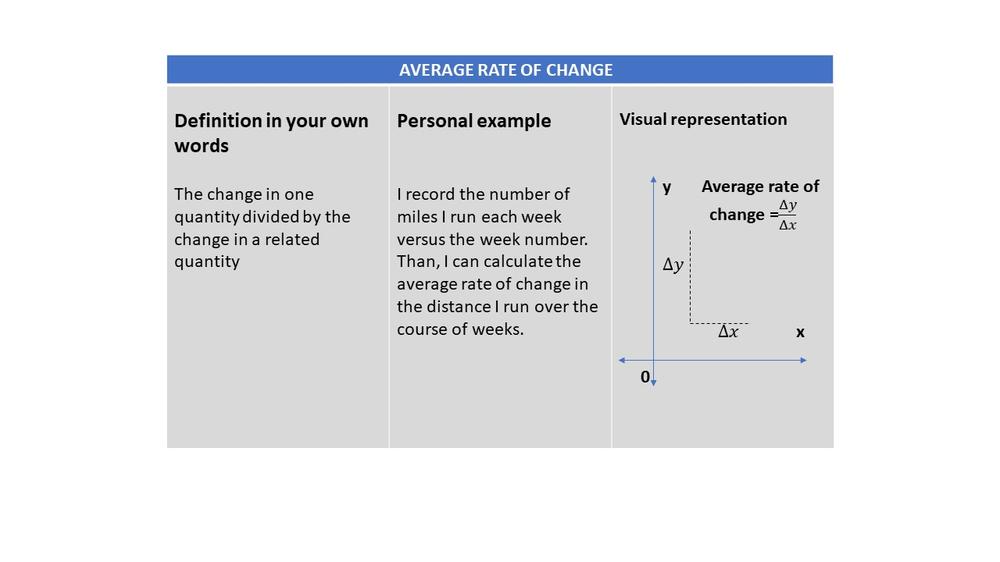
The average rate of change is found by taking the change in $y$ for the specified interval and dividing it by the change in $x$ over that same interval.
$textbf{average rate of change}$ = $dfrac{8750-23500}{8-0}=-1843.75$$\
So, we have that price is lower for$1843.75
$$
in average each year, or, $7.84%$ of the price each year in average.\
$$


