
All Solutions
Page 569: Check Your Understanding
$textbf{The equation of the graph is}$ $6.25pi(dfrac{x}{4})$, and it is on the following picture:
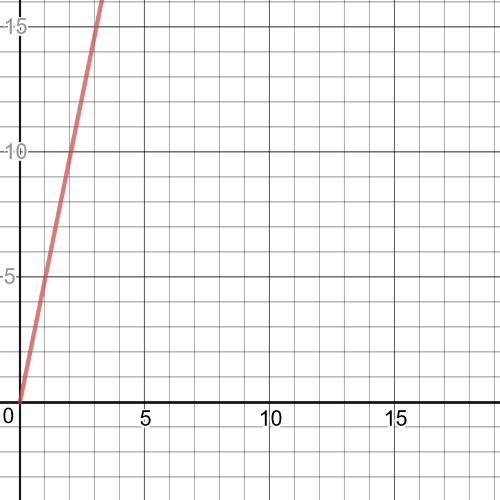
$$
y=6.25pi(dfrac{x}{4})
$$
#### (c)
$8=6.25pi(dfrac{x}{4})$
$8=1.5625pi{x}$
$1.6=x$
$textbf{Ao, it will take about $1.6$ hours}$.
$y=dfrac{6.25 pi}{64}(x-8)^2$
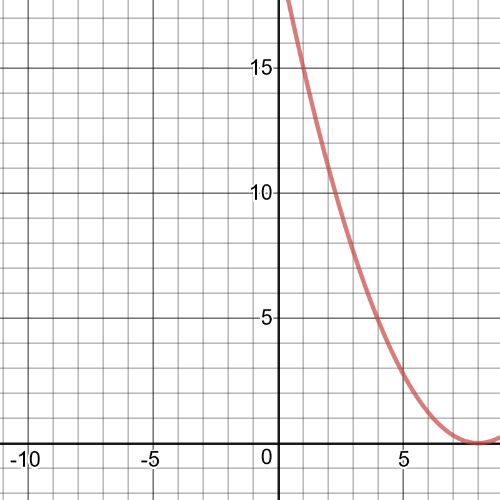
$V(t)=dfrac{6.25pi}{64}(t-8)^2$
#### (c)
$V(2)=dfrac{6.25pi}{64}(2-8)^2=dfrac{6.25pi}{64}(-6)^2=dfrac{6.25}{64}(36)=11m^3$
#### (d)
The initial volume is $19.6 m^3$.
So, the rate of change is $(11-19.6)div 2$ or $-4.3m^3/hr$
#### (e)
As time elapses, the pool is losing less water in the same amount of time.
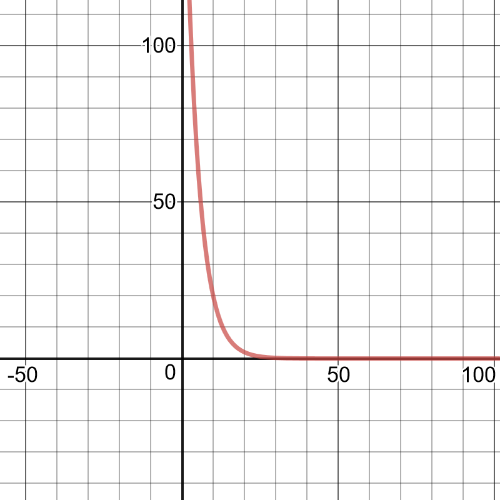
For example, we have two $textbf{following graphs}$:
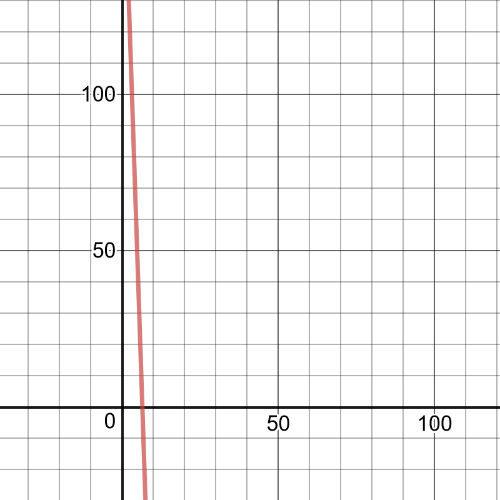
From the linear graph, the $y$-intercept is $(0,200)$ and the slope is $-30$, so, $textbf{the equation is}$:
$V(t)=-30t+200$
$0=-30t+200$
$-200=-30t$
$$
t=6.7
$$
#### (c)
Using a graphing calculator, $textbf{the equation that fits the model is}$
$V(t)=200(0.795)^t.$
$V(t)=200(0.795)^t$
$20=200(0.795)^t$
$0.1=0.765^t$
$log0.1=tlog0.795$
$t=10$.
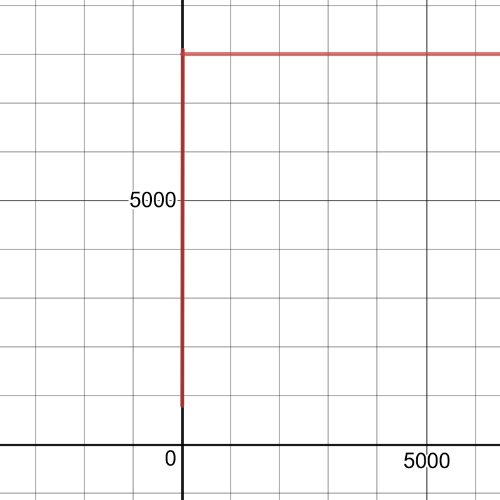
$P(t)=dfrac{8000}{1+9(0.719)^t}$
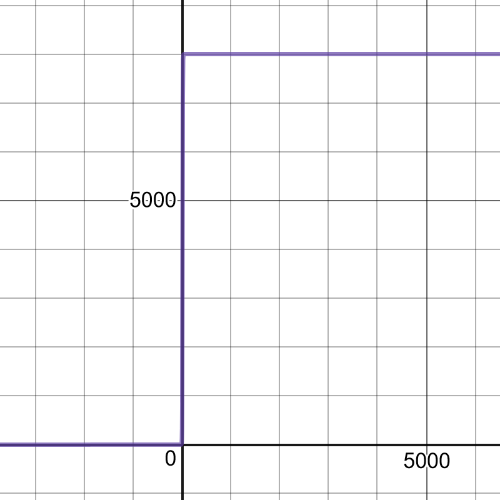
$P(4)=dfrac{8000}{1+9(0.719)^4}=2349$ trout four years after restocking.
#### (d)
The rate of change is $(2349-800)div 4$ or $387.25$ trout per year.
the carrying capacity of the lake; $8000$
#### (b)
Use $(0,800)$ and $(10, 6000)$.
$800=8000-a(b)^0$
$800=8000-a$
$-7200=-a$
$7200=a$
$6000=8000-7200(b)^{10}$
$-2000=-7200(b)^{10}$
$0.278=b^{10}$
$0.278^{dfrac{1}{10}}=b$
$0.88=b$
#### (c)
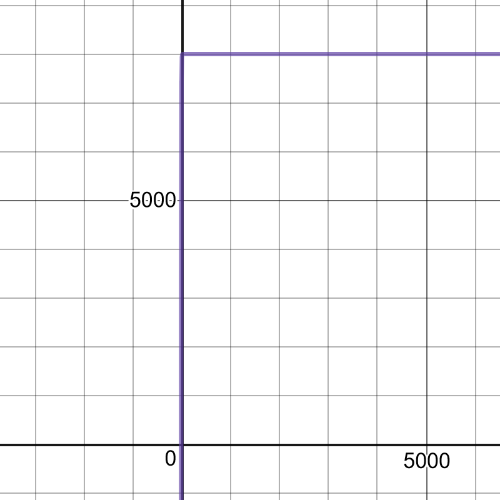
$P(4)=8000-7200(0.88)^4$
$=8000-4317.81$
$=3682$
#### (e)
The rate of change is $(3682-800)div 4$ or $720.5$ trout per year.
#### (f)
In the model in previous problem, the carrying capacity of the lake is divided by a number that gets smaller and smaller, while in this model, a number that gets smaller and smaller is subtracted from the carrying capacity of the lake.
$textbf{The equation is}$ $V(t)=0.85cos(dfrac{pi}{3}(t-1.5))$ and on the following picture there is its $textbf{graph.}$
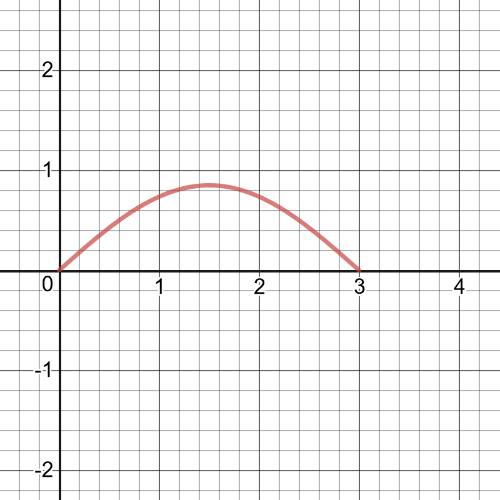
The scatter plot and the graph are very close to being the same, but $textbf{they are not exactly the same.}$
#### (b)
$V(6)=0.85cos(dfrac{pi}{3}(6-1.5))=0.85cos(dfrac{pi}{3}4.5)=0$ L/s
#### (d)
From the graph, the rate of change appears to be at its $textbf{smallest at}$ $t=1.5$s.
#### (e)
It is $textbf{the maximum}$ of the function.
#### (f)
From the graph, the rate of change appears to be at its $textbf{greatest at}$ $t=0$s.
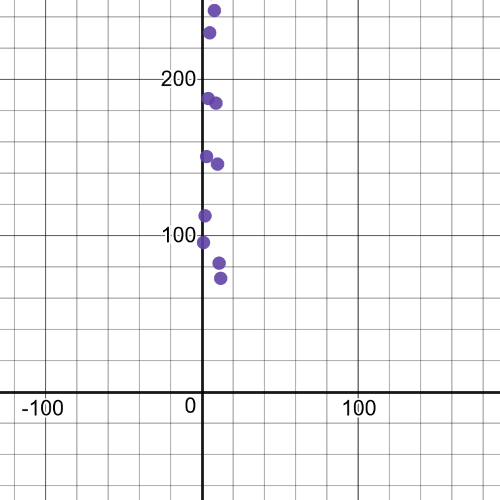
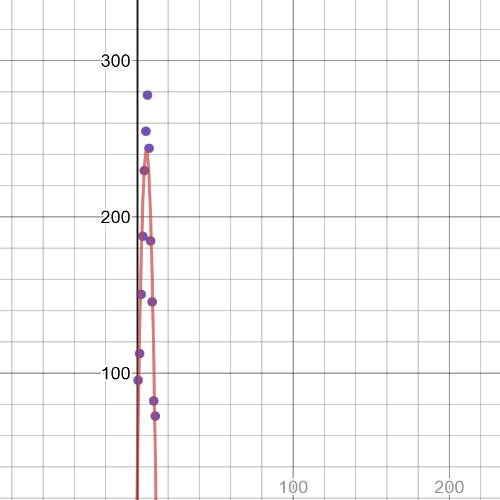
$$
S(t)=-6.07028t^2+77.1402x-2.75455
$$
#### (d)
From the model, $textbf{the maximum}$ will be at $t=7$ an $textbf{the minimum}$ will be at $t=1$.
#### (e)
$textbf{It does not fit it perfectly}$, because, actually, the minimum is not at $t=1$, but at $t=12$.
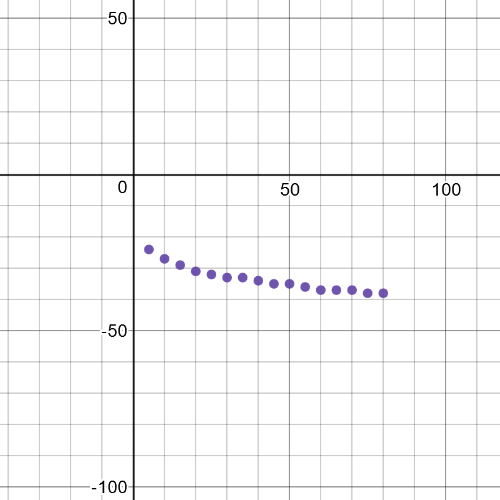
For example:
$C(s)=38+14(0.97)^t$
#### (c)
$C(0)=-38+14(0.97)^0=-38+14=-24^circ$C
$C(100)=-38+14(0.97)^100=-38+0.666=-37.3^circ$C
$C(200)=-38+14(0.97)^200=-38+0.032=-38^circ$C
These answers do not appear to be very resonable, because the wind chill for a wind speed od $0$ km/h should be $-20^circ$C, while the wind chills for wind speeds of $100$ km/h and $200$ km/h should be less than $-38^circ$C.The model only appears to be somewhat accurate for wind speeds of $10$ to $70$ km/h.
Answers will vary; for example, one polynomial model is $P(t)=1.4t^2+3230$, while an exponential model is $P(t)=3230(1.016)^t$. While neither model is perfect, it appears that the polynomial model fits the data better.
#### (b)
$P(155)=1.4(155)^2+3230=36865$
$P(155)=3230(1.016)^{155}=37820$
#### (c)
A case could be made for either model. The polynomial model appears to fit the data better, but population growth is usually exponential.
#### (d)
According to the polynomial model, in $2000$, the population was increasing at a rate of about $389000$ per year, while according to the exponential model, in $2000$, the population was increasing at a rate of about $465000$ per year.
$P(t)=3339.18(1132.25)^t$
#### (b)
$75=3339.18(1132.25)^t$
We can use graphing calculator to solve, and we get that solution is
$t=-31$.So, they were introduced around the year $1924$.
#### (c)
$textbf{rate of growth}$ = $(93100-650)div(35-0)=2641$ rabbits per year.
#### (d)
$$
P(65)=3339.18(1132.25)^65=10712509.96
$$
#### (a)
$V(t)=155.6 sinleft(120pi t+dfrac{pi}{2} right)$
#### (b)
$V(t)=155.6 cos(120 pi t)$
#### (c)
The cosine function was easier to determine.The cosine function is at its maximum when the argument is $0$, so no horizontal translation was necessary.
For example:
$textbf{a linear model is}$ $P(t)=-9t+400$
$textbf{a quadriatic model is}$ $P(t)=dfrac{23}{90}(t-30)^2+170$
$textbf{a exponential model is}$ $P(t)=400(0.972)^t$
The exponential model fits the data far better than the other two models.
#### (b)
$P(60)=-9cdot60+400=-540+400=-140$ kPa
$P(60)=dfrac{23}{90}(60-30)^2+170=dfrac{23}{60}30^2+170=dfrac{23}{90}900+170=230+170=400$ kPa
$P(60)=400(0.972)^60=73$ kPa
#### (c)
$textbf{The exponential model gives the most realistic answer}$, because it fits the data the best.Also, the pressure must be less than $170$ kPa, but it cannot be negative.
linear,quadratic, or exponential
#### (b)
linear or quadratic
#### (c)
exponential
$$
T(n)=dfrac{1}{6}n^3+dfrac{1}{2}n^2+dfrac{1}{3}n
$$
#### (b)
$47850=dfrac{1}{6}n^3+dfrac{1}{2}n^2+dfrac{1}{3}n$
So, $n=64.975$.$textbf{So, it is not a tetrahedral number}$ because $n$ must be an integer.
Using a graphing calculator,the equation is $P(t)=30.75(1.008418)^t$
#### (b)
In $2000$, the growth rate of Canada was less than the growth rate of Ontario and Alberta.

