All Solutions
Page 272: Check Your Understanding
(a) – A
(b) – C
(c) – D
(d) – B
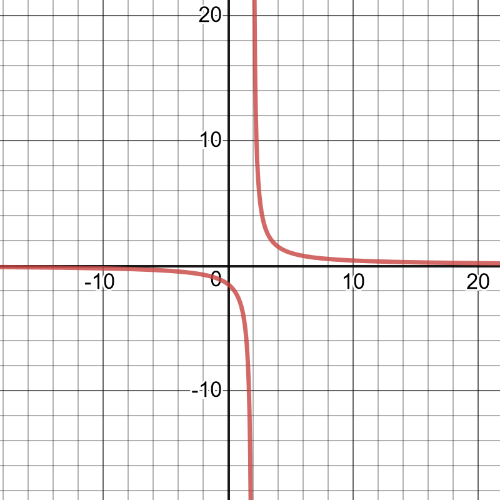
The equation of the vertical asymptote is $x=2$.
#### (b)

The equation of the horizontal asymptote is $y=0$.
#### (d)

$textbf{The domain and range are sets}$:
$D=left{xinBbb{R}|xne2 right}$
$$
R=left{yinBbb{R}|yne0 right}
$$
#### (f)
$textbf{The positive}$ interval is $(2,+infty)$ and $textbf{negative}$ is $(-infty,2)$
#### (g)
The equation of the vertical asymptote is $x=-1$.
#### (b)

The equation of the horizontal asymptote is $y=4$.
#### (d)
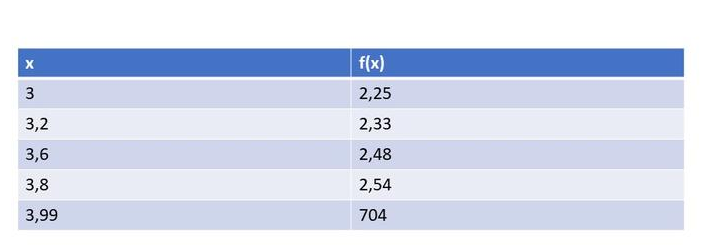
The domain and range are sets:
$D=left{xinBbb{R}|xne-1 right}$
$$
R=left{yinBbb{R}|yne0 right}
$$
#### (g)
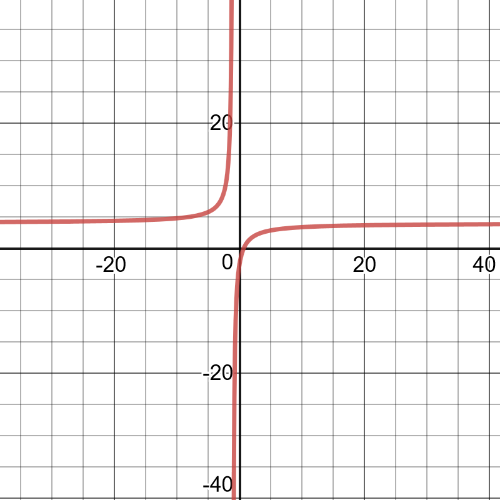
$textbf{The equation of vertical asymptote is}$ $x=-3$.
Now, we choose a value of $x$ to the left and very
close to $-3$, then we have:
$y(-3.1)=dfrac{2}{-3.1+3}=-20$
So, we can see that on the left side of the vertical asymptote, the values of the function are $textbf{negative}$, so, the function decreases to small negative values as $x$ approaches $-3$ from the left.
On the other side, we choose a value of $x$ to the right and very close to $-3$, we have next:
$y(-2.9)=dfrac{2}{-2.9+3}=20$
So, in this case we can conclude that on the right side of the vertical
asymptote, the values of the function are $textbf{positive}$.So, the function increases to large positive values as x approaches $-3$ from the right.
#### (b)
$textbf{The equation of vertical asymptote is}$ $x=5$.
Now, we choose a value of $x$ to the left and very
close to $5$, then we have:
$y(4.9)=dfrac{4.9-1}{4.9-5}=-39$
So, we can see that on the left side of the vertical asymptote, the values of the function are $textbf{negative}$, so, the function decreases to small negative values as $x$ approaches $5$ from the left.
On the other side, we choose a value of $x$ to the right and very close to $5$, we have next:
$y(5.1)=dfrac{5.1-1}{5.1-5}=41$
So, in this case we can conclude that on the right side of the vertical
asymptote, the values of the function are $textbf{positive}$.So, the function increases to large positive values as x approaches $5$ from the right.
$textbf{The equation of vertical asymptote is}$ $x=dfrac{1}{2}$.
Now, we choose a value of $x$ to the left and very
close to $dfrac{1}{2}$, then we have:
$y(0.4)=dfrac{2cdot0.4+1}{2cdot0.4-1}=-9$
So, we can see that on the left side of the vertical asymptote, the values of the function are $textbf{negative}$, so, the function decreases to small negative values as $x$ approaches $dfrac{1}{2}$ from the left.
On the other side, we choose a value of $x$ to the right and very close to $dfrac{1}{2}$, we have next:
$y(0.6)=dfrac{2cdot0.6+1}{2cdot0.6-1}=11$
So, in this case we can conclude that on the right side of the vertical
asymptote, the values of the function are $textbf{positive}$.So, the function increases to large positive values as x approaches $dfrac{1}{2}$ from the right.
$textbf{The equation of vertical asymptote is}$ $x=-dfrac{1}{4}$.
Now, we choose a value of $x$ to the left and very
close to $-dfrac{1}{4}$, then we have:
$y(-dfrac{1}{3})=dfrac{3cdot(-dfrac{1}{3})+9}{4cdot(-dfrac{1}{3})+1}=-24$
So, we can see that on the left side of the vertical asymptote, the values of the function are $textbf{negative}$, so, the function decreases to small negative values as $x$ approaches $-dfrac{1}{4}$ from the left.
On the other side, we choose a value of $x$ to the right and very close to $-dfrac{1}{4}$, we have next:
$y(-dfrac{1}{5})=dfrac{3cdot(-dfrac{1}{5})+9}{4cdot(-dfrac{1}{5})+1}=42$
So, in this case we can conclude that on the right side of the vertical
asymptote, the values of the function are $textbf{positive}$.So, the function increases to large positive values as x approaches $-dfrac{1}{4}$ from the right.
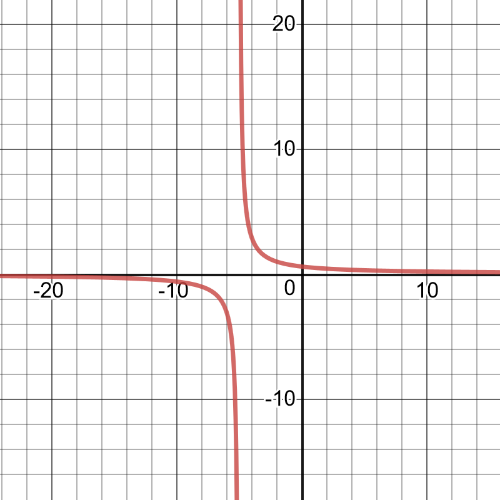
$textbf{The domain}$ of this function is set:
$D=left{xinBbb{R}|xne-5 right}$
It has $textbf{a vertical asymptote}$ at $x=-5$, point of $textbf{intercept}$ is $(0,0.6)$ with $y$-axis.
It is $textbf{positive}$ on interval $(-5,+infty)$ and $textbf{negative}$ on interval $(-infty,-5)$.
This function is $textbf{decreasing}$.
On the following picture is $textbf{graph}$ of this function:
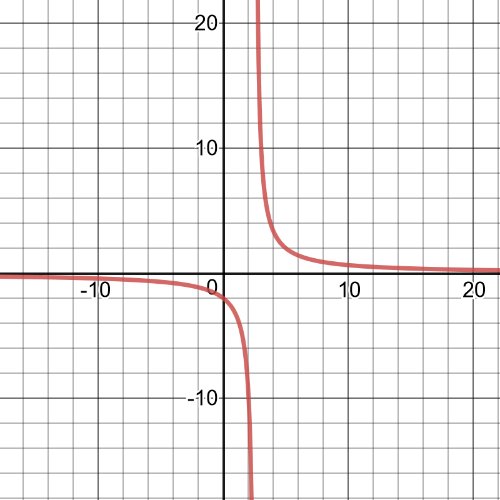
$textbf{The domain}$ of this function is set:
$D=left{xinBbb{R}|xnedfrac{5}{2} right}$
It has $textbf{a vertical asymptote}$ at $x=dfrac{5}{2}$, point of $textbf{intercept}$ is $(0,-2)$ with $y$-axis.
It is $textbf{positive}$ on interval $(dfrac{5}{2},+infty)$ and $textbf{negative}$ on interval $(-infty,dfrac{5}{2})$.
This function is $textbf{decreasing}$.
On the following picture is $textbf{graph}$ of this function:
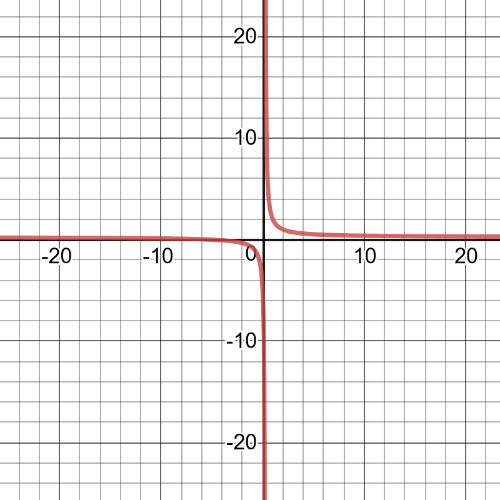
$textbf{The domain}$ of this function is set:
$D=left{xinBbb{R}|xnedfrac{1}{4} right}$
It has $textbf{a vertical asymptote}$ at $x=dfrac{1}{4}$ and $textbf{horizontal asymptote at}$ $y=dfrac{1}{4}$.
Points of $textbf{intercepts}$ is $(0,-5)$ with $y$-axis and $(-5,0)$ with $x$-axis.
It is $textbf{positive}$ on interval $(dfrac{1}{4},+infty)$ and $textbf{negative}$ on interval $(-infty,dfrac{1}{4})$.
This function is $textbf{decreasing}$.
On the following picture is $textbf{graph}$ of this function:
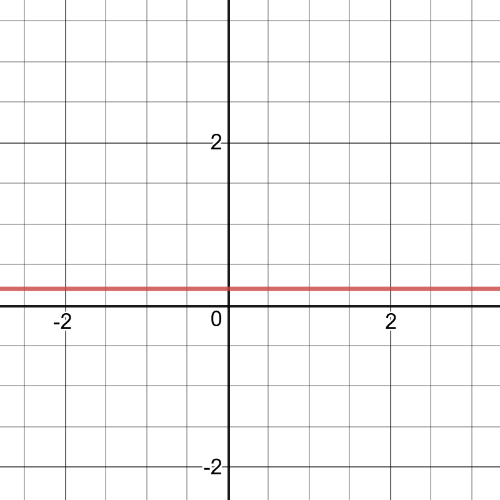
$textbf{The domain}$ of this function is set:
$D=left{xinBbb{R}|xne-2 right}$
This is $textbf{positive constant function}$,it has $textbf{a hole}$ at $x=-2$, has no asymptotes and on the following picture is its $textbf{graph}$:
On the following picture is $textbf{graph}$ of function which is solution for this part of task:
$$
y=dfrac{1}{x+2}
$$
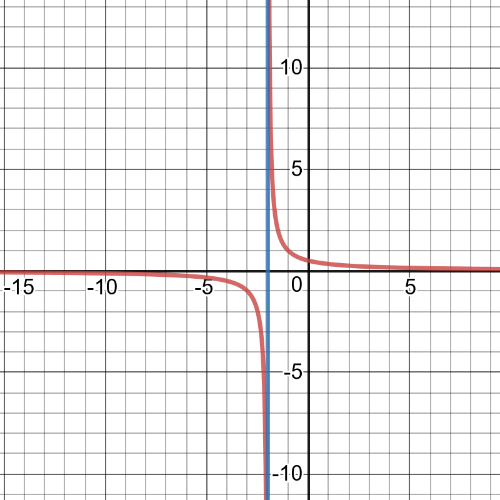
On the following picture is $textbf{graph}$ of function which is solution for this part of task:
$$
y=dfrac{x}{x+2}
$$
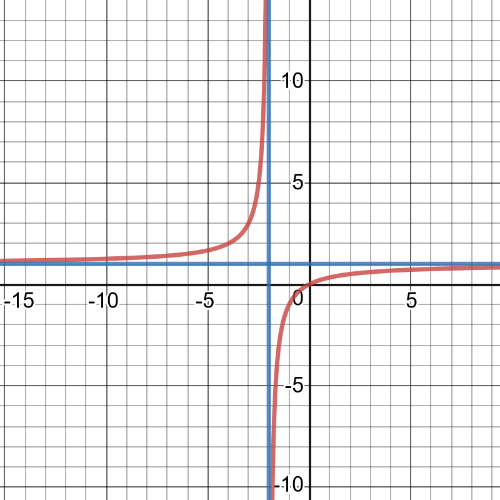
On the following picture is $textbf{graph}$ of function which is solution for this part of task:
$$
y=dfrac{dfrac{1}{2}(x-3)}{x-3}
$$
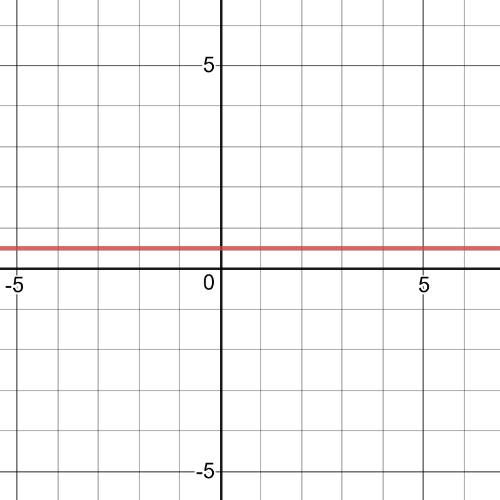
On the following picture is $textbf{graph}$ of function which is solution for this part of task:
$$
y=dfrac{x}{(x+2)(x-6)}
$$
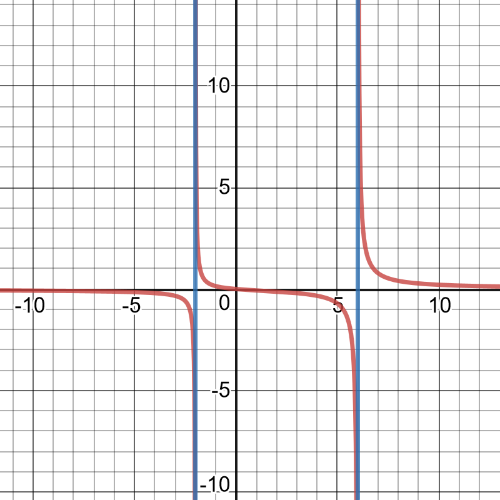
These functions has a lot of things in common:
(1) $textbf{The domain}$ is set $D=left{xinBbb{R}|xne-dfrac{1}{n} right}$;
(2) They are always $textbf{increasing}$;
(3) $textbf{Intercept}$ is point $(0,0)$;
(4) They are $textbf{positive}$ on intervals $(-infty,-dfrac{1}{n})$ or $(0,+infty)$ and $textbf{negative}$ on interval $(-dfrac{1}{n},0)$;
(5) They have $textbf{vertical asymptote}$ at $x=-dfrac{1}{n}$ and $textbf{horizontal asymptote}$ at $y=dfrac{8}{n}$.
On the following pictures are their graphs, red is for $n=1$,blue is for $n=2$, green is for $n=4$ and purple is for $n=8$:
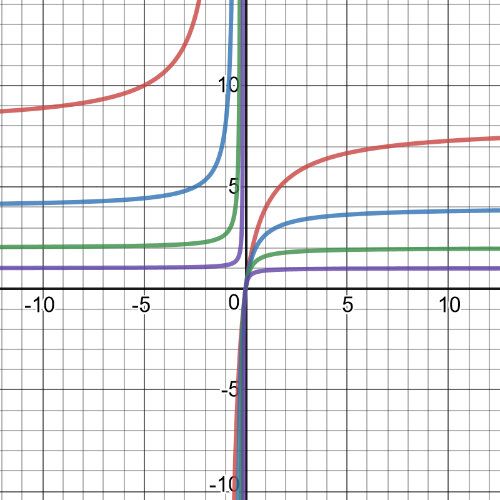
According to graphs from part (a), we can conclude next:
$nrightarrowinfty$, $f(x)rightarrow0$
#### (c)
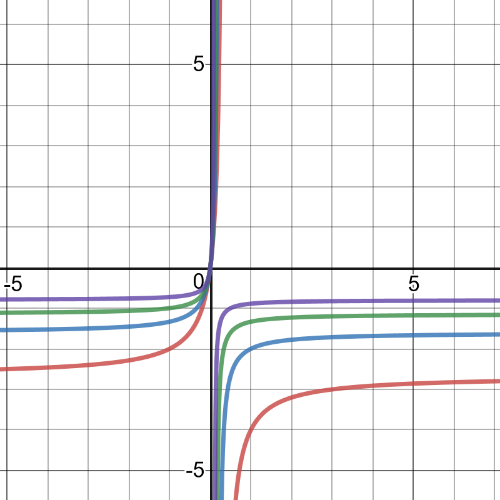
Also, if $n$ is negative, we will have the same thing as we had at part (b):
$nrightarrowinfty$, $f(x)rightarrow0$
We can see this from following graphs of the same function, but where red is when $n=-3$, blue when $n=-5$, green when $n=-7$ and purple when $n=-10$:
(1)$textbf{The domain}$ of this function is set $D=left{xinBbb{R}|xne1 right}$;
(2) It has $textbf{vertical asymptote}$ at $x=1$ and $textbf{horizontal asymptote}$ at $y=3$;
(3) This function is always $textbf{decreasing}$;
(4) It is $textbf{positive}$ on intervals $(-infty,-dfrac{4}{3})$ or $(1,+infty)$ and $textbf{negative}$ on interval $(-dfrac{4}{3},1)$;
(5) Its points of intercepts are $(-dfrac{4}{3},0)$ with $x$-axis and $(0,-4)$ with $y$-axis.
Now, we will analyse function $f(x)= dfrac{x-1}{2x+3}$:
(1)$textbf{The domain}$ of this function is set $D=left{xinBbb{R}|xne-dfrac{3}{2} right}$;
(2) It has $textbf{vertical asymptote}$ at $x=-dfrac{3}{2}$ and $textbf{horizontal asymptote}$ at $y=dfrac{1}{2}$;
(3) This function is always $textbf{increasing}$;
(4) It is $textbf{positive}$ on intervals $(-infty,-dfrac{3}{2})$ or $(1,+infty)$ and $textbf{negative}$ on interval $(-dfrac{3}{2},1)$;
(5) Its points of intercepts are $(1,0)$ with $x$-axis and $(0,-dfrac{1}{3})$ with $y$-axis.
$textbf{The investment after $2$ years}$ will be value of function $I(t)$ for $t=2$, and it is $27.5$ in thousands of dollars.
#### (b)
$textbf{The investment after $1$ years}$ will be value of function $I(t)$ for $t=1$, and it is $40$ in thousands of dollars.
#### (c)
$textbf{The investment after $0.5$ years}$ will be value of function $I(t)$ for $t=0.5$, and it is $65$ in thousands of dollars.
#### (d)
$textbf{It does not make sense}$ because for value $t=0$ value of this function, which is investment in thousand of dollars, should be equaivalent to value which is invested at the beginning.
#### (e)
$textbf{The function will not accurate at very small values of}$ $t$ because we have next:
$$
trightarrow0 Rightarrow I(t)rightarrowinfty
$$
#### (f)
The horizontal asymptote will show us where the value of the investment will probably settle during the time. We have that $textbf{equation of horizontak asymptote is}$ $y=15$, so, the value of investments will settle around $15000$ USD.
$t=1 Rightarrow c(t)=0.67$
$t=2 Rightarrow c(t)=1$
$t=4 Rightarrow c(t)=1.33$
$t=12 Rightarrow c(t)=1.71$
$t=20 Rightarrow c(t)=1.81$
$t=24 Rightarrow c(t)=1.84$
So, we can conclude that $textbf{the concentration increases}$ over the $24$ h period.
$(0,dfrac{b}{d})$ with $y$-axis
$(-dfrac{b}{a},0)$ with $x$-axis
For example, let’s take following function for values $a=2$, $b=4$, $c=1$. $d=3$:
$y=dfrac{2x+4}{x+3}$
This function will have:
$textbf{vertical asymptote}$: $x=-dfrac{d}{c}=-dfrac{3}{1}=-3$
$textbf{horizontal asymptote}$: $y=dfrac{a}{c}=dfrac{2}{1}=2$
$y$-intercept: $y=dfrac{b}{d}=dfrac{4}{3}$
$x$-intercept: $x=-dfrac{b}{a}=-dfrac{4}{2}=-2$
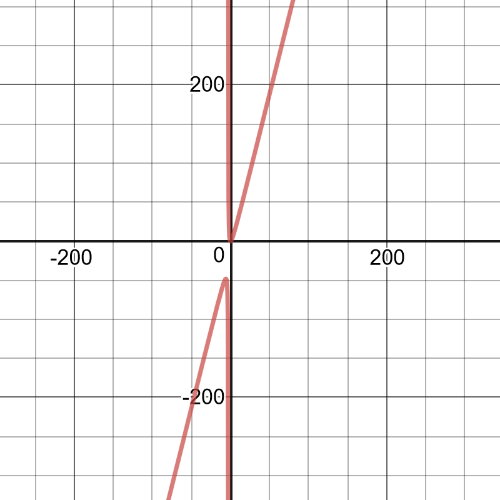
$y=dfrac{4x^2}{3+x}$,
where $p(x)=4x^2$, $q(x)=3+x$ and $stp(x)>stq(x)$, so, according to this, we can conclude that $textbf{this function has oblique asymptote}$, we can see that and from following graph:
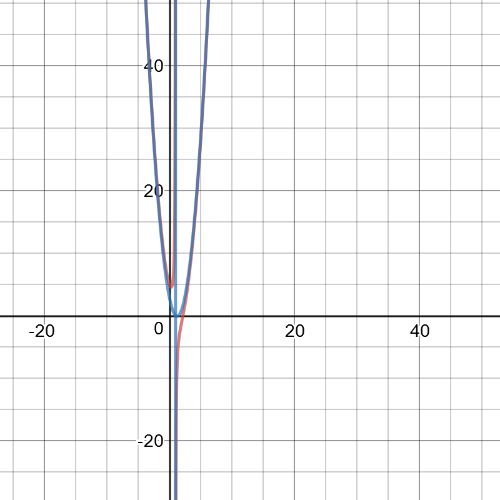
$f(x)=dfrac{2x^3-7x^2+8x-5}{x-1}=2x^2-5x+3-dfrac{2}{x-1}$
We can see from previous equation what is $textbf{end behaviour}$ of this function:
$xrightarrowpminfty Rightarrow f(x)rightarrowinfty$
We can conclude that this function has $textbf{vertical asyymptote}$ at $x=1$ and $textbf{oblique asymotote}$ which equation is $y=2x^2-5x+3$.
Function $f(x)$ has a $textbf{horizontal asymptote}$.
#### (b)
Functions $g(x)$ and $h(x)$ has a $textbf{oblique asymptote}$.
#### (c)
Function $g(x)$ has a $textbf{vertical asymptote}$.
#### (d)
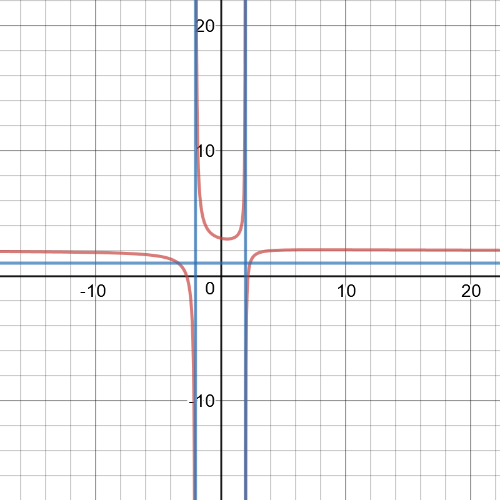
On the following picture there is $textbf{a graph}$ of function $m(x)$, it has $textbf{vertical asymptotes}$ at $x=2$ and $x=-2$, and also $textbf{horizontal asymptote}$ at $y=1$:
