Advanced Functions 12
1st Edition
Chris Kirkpatrick, Kristina Farentino, Susanne Trew
ISBN: 9780176678326
Table of contents
Textbook solutions

All Solutions

Page 118: Chapter Self-Test

Exercise 1
Step 1
1 of 3
#### (a)

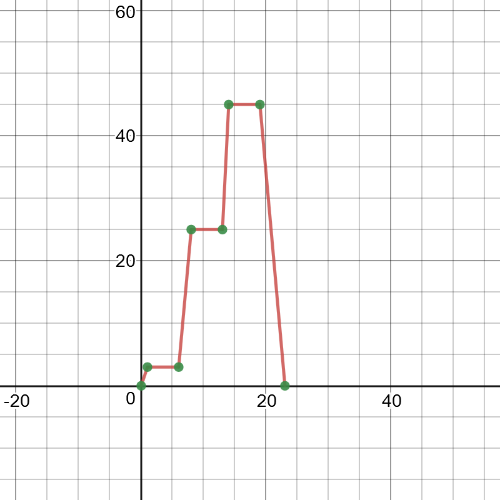
Here we have a $textbf{graph}$ of the boat’s speed versus time:
Exercise scan

Step 2
2 of 3
#### (b)

The average rate of change in speed from $t=6$ to $t=8$ is:

$textbf{average rate of change}$ = $dfrac{25-3}{8-6}=11$

The average rate of change in speed from $t=8$ to $t=13$ is:

$textbf{average rate of change}$ = $dfrac{25-25}{13-8}=0$

$textbf{We can conclude that speed is increasing from $t=6$ to $t=8$ and it is constant from $t=8$ to $t=13$.}$

#### (c)

$textbf{Instaneous rate of change is equaivalent to the slope of tangent line in this point}$ because the graph is linear function in this point, so:

$textbf{instaneous rate of change}$ = $11$.

Result
3 of 3
(b) 11, 0;(c) 11
Exercise 2
Step 1
1 of 2
#### (a)

The slope is:

$textbf{slope}$ = $dfrac{25-70}{50-5}=-1$

#### (b)

Slope is negative, that means that temperature is decreasing while time is increasing.

#### (c)

Using linear regression, we get that equation of give function is $f(x)=0.01x^2-1.88x+80.97$, and its derivative is $f'(x)=0.02x-1.88$.So, the slope of the tangent line in point $(30,35)$ is:

$textbf{slope}$ = $f'(30)=-1.28$

#### (d)

Result from part (c) means that temperatue is decreasing at that moment.
#### (e)

In this case, temperature will decrease faster.

Result
2 of 2
see solution
Exercise 3
Step 1
1 of 2
#### (a)

Average rate of change over the interval $8leq{x}leq10$ is:

$textbf{average rate of change}$ = $dfrac{P(10)-P(8)}{10-8}=310$
#### (b)

Instaneous rate of change at $x=50$ is:

$textbf{instaneous rate of change}$ = $dfrac{P(50.01)-P(49.99)}{50.01-49.99}=100$
#### (c)

The differnce is that at part (a) we calculated average rate of change over the given period and at part (b) at given moment.

Result
2 of 2
(a) 310; (b) 100
Exercise 4
Step 1
1 of 3
#### (a)

First, we will estimate instaneous rate of change in point $p=-1$ on interval $-1.01leq-1leq-0.99$:

$textbf{instaneous rate of change}$ = $dfrac{h(-0.99)-h(-1.01)}{-0.99+1.01}=-1$

Now, we will estimate instaneous rate of change for $p=-0.75$ on interval $-0.76leq-0.75leq-0.74$:

$textbf{instaneous rate of change}$ = $dfrac{h(-0.74)-h(-0.76)}{-0.74+0.76}=0$

In point $p=1$, we will estimate instaneous rate of change on interval $0.99leq1leq1.01$:

$textbf{instaneous rate of change}$ = $dfrac{h(1.01)-h(0.99)}{1.01-0.99}=7$

Only for point $p=-0.75$ instaneous rate of change is equivalent to $0$, so, in this point might be minimum or maximum. We have next:

$h(-0.75)=-1.125$

$h(-0.74)=h(-0.76)=-1.1248$

We can see that in points after and before point $p=-0.75$ values are greater, so, we can conclude that in this point is $textbf{minimum}$.

Step 2
2 of 3
#### (a)

First, we will estimate instaneous rate of change in point $x=-2$ on interval $-2.01leq-2leq-1.99$:

$textbf{instaneous rate of change}$ = $dfrac{k(-1.99)-k(-2.01)}{-1.99+2.01}=4.5$

Now, we will estimate instaneous rate of change for $x=4$ on interval $3.99leq4leq4.01$:

$textbf{instaneous rate of change}$ = $dfrac{k(4.01)-k(3.99)}{4.01-3.99}=-4.5$

In point $x=1$, we will estimate instaneous rate of change on interval $0.99leq1leq1.01$:

$textbf{instaneous rate of change}$ = $dfrac{k(1.01)-k(0.99)}{1.01-0.99}=0$

Only for point $x=1$ instaneous rate of change is equivalent to $0$, so, in this point might be minimum or maximum. We have next:

$k(1)=13.75$

$k(0.99)=k(1.01)=13.74999$

We can see that in points after and before point $x=1$ values are smaller, so, we can conclude that in this point is $textbf{maximum}$.

Result
3 of 3
(a) $p=-0.75$ is minimum; (b) $x=1$ is maximum
unlock
Get an explanation on any task
Get unstuck with the help of our AI assistant in seconds
New
Chapter 1: Functions: Characteristics and Properties
Page 2: Getting Started
Section 1-1: Functions
Section 1-2: Exploring Absolute Value
Section 1-3: Properties of Graphs of Functions
Section 1-4: Sketching Graphs of Functions
Section 1-5: Inverse Relations
Section 1-6: Piecewise Functions
Section 1-7: Exploring Operations with Functions
Page 62: Chapter Self-Test
Chapter 2: Functions: Understanding Rates of Change
Page 66: Getting Started
Section 2-1: Determining Average Rate of Change
Section 2-2: Estimating Instantaneous Rates of Change from Tables of Values and Equations
Section 2-3: Exploring Instantaneous Rates of Change Using Graphs
Section 2-4: Using Rates of Change to Create a Graphical Model
Section 2-5: Solving Problems Involving Rates of Change
Page 118: Chapter Self-Test
Chapter 3: Polynomial Functions
Page 122: Getting Started
Section 3-1: Exploring Polynomial Functions
Section 3-2: Characteristics of Polynomial Functions
Section 3-3: Characteristics of Polynomial Functions in Factored Form
Section 3-4: Transformation of Cubic and Quartic Functions
Section 3-5: Dividing Polynomials
Section 3-6: Factoring Polynomials
Section 3-7: Factoring a Sum or Difference of Cubes
Page 186: Chapter Self-Test
Page 188: Cumulative Review
Page 155: Check Your Understanding
Page 161: Practice Questions
Page 182: Check Your Understanding
Page 184: Practice Questions
Chapter 4: Polynomial Equations and Inequalities
Page 194: Getting Started
Section 4-1: Solving Polynomial Equations
Section 4-2: Solving Linear Inequalities
Section 4-3: Solving Polynomial Inequalities
Section 4-4: Rates of Change in Polynomial Functions
Page 242: Chapter Self-Test
Chapter 5: Rational Functions, Equations, and Inequalities
Page 246: Getting Started
Section 5-1: Graphs of Reciprocal Functions
Section 5-2: Exploring Quotients of Polynomial Functions
Section 5-3: Graphs of Rational Functions of the Form f(x) 5 ax 1 b cx 1 d
Section 5-4: Solving Rational Equations
Section 5-5: Solving Rational Inequalities
Section 5-6: Rates of Change in Rational Functions
Page 310: Chapter Self-Test
Chapter 6: Trigonometric Functions
Page 314: Getting Started
Section 6-1: Radian Measure
Section 6-2: Radian Measure and Angles on the Cartesian Plane
Section 6-3: Exploring Graphs of the Primary Trigonometric Functions
Section 6-4: Transformations of Trigonometric Functions
Section 6-5: Exploring Graphs of the Reciprocal Trigonometric Functions
Section 6-6: Modelling with Trigonometric Functions
Section 6-7: Rates of Change in Trigonometric Functions
Page 378: Chapter Self-Test
Page 380: Cumulative Review
Chapter 7: Trigonometric Identities and Equations
Page 386: Getting Started
Section 7-1: Exploring Equivalent Trigonometric Functions
Section 7-2: Compound Angle Formulas
Section 7-3: Double Angle Formulas
Section 7-4: Proving Trigonometric Identities
Section 7-5: Solving Linear Trigonometric Equations
Section 7-6: Solving Quadratic Trigonometric Equations
Page 441: Chapter Self-Test
Chapter 8: Exponential and Logarithmic Functions
Page 446: Getting Started
Section 8-1: Exploring the Logarithmic Function
Section 8-2: Transformations of Logarithmic Functions
Section 8-3: Evaluating Logarithms
Section 8-4: Laws of Logarithms
Section 8-5: Solving Exponential Equations
Section 8-6: Solving Logarithmic Equations
Section 8-7: Solving Problems with Exponential and Logarithmic Functions
Section 8-8: Rates of Change in Exponential and Logarithmic Functions
Page 512: Chapter Self-Test
Chapter 9: Combinations of Functions
Page 516: Getting Started
Section 9-1: Exploring Combinations of Functions
Section 9-2: Combining Two Functions: Sums and Differences
Section 9-3: Combining Two Functions: Products
Section 9-4: Exploring Quotients of Functions
Section 9-5: Composition of Functions
Section 9-6: Techniques for Solving Equations and Inequalities
Section 9-7: Modelling with Functions
Page 578: Chapter Self-Test
Page 580: Cumulative Review
Page 542: Further Your Understanding
Page 544: Practice Questions
Page 569: Check Your Understanding
Page 576: Practice Questions