
All Solutions
Section 2-4: Using Rates of Change to Create a Graphical Model
A-(b); B-(c); C-(a).
$textbf{The graph begins with a straight line since the rate at which Jan walks is constant. The graph has a negative slope since she walks toward from the sensor}$, and her distance from the sensor decreases as time increases.Jan starts $5$ m from the sensor.Use $(0, 5)$ as the distance intercept.Jan walks $4$ m toward the sensor at a
constant rate for $5$ s, so use the point $(5,1)$.
$textbf{Jan then walks away from the sensor. The line has a postive slope, because her distance from the sensor inreases as time increases.}$
$textbf{The graph ends with a horizontal line that has a slope of 0 because Jan is not moving}$. The slope indicates that her distance from the sensor does not change.
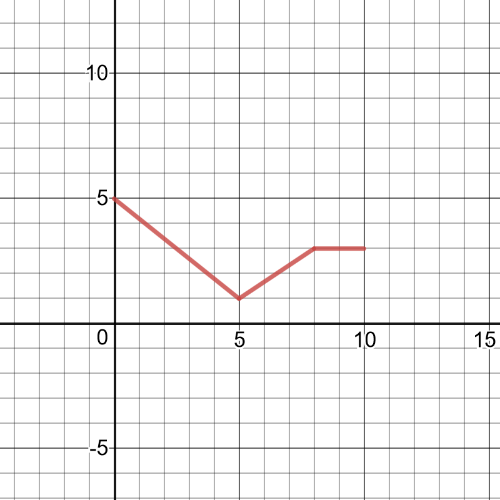
Here we $textbf{have graph of data}$ given in the table in the task:
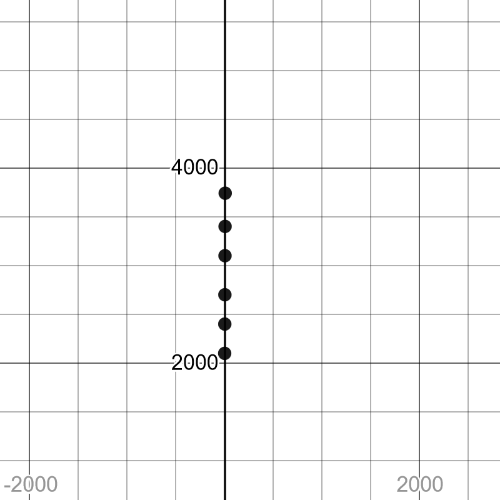
Rachel’s average speed over each part of her climb is:
On interval $0leq{t}leq40$ we have:
$textbf{average speed}$ = $dfrac{6-5}{40-0}=dfrac{1}{40}=0.025$
On interval $40leq{t}leq130$ we have:
$textbf{average speed}$ = $dfrac{7-6}{130-40}=dfrac{1}{90}=0.011$
On interval $130leq{t}leq250$ we have:
$textbf{average speed}$ = $dfrac{7-7}{250-130}=0$
On interval $250leq{t}leq290$ we have:
$textbf{average speed}$ = $dfrac{8-7}{290-250}=dfrac{1}{40}=0.025$
On interval $290leq{t}leq335$ we have:
$textbf{average speed}$ = $dfrac{9-8}{335-290}=dfrac{1}{45}=0.022$
On interval $335leq{t}leq395$ we have:
$textbf{average speed}$ = $dfrac{10-9}{395-335}=dfrac{1}{60}=0.0167$
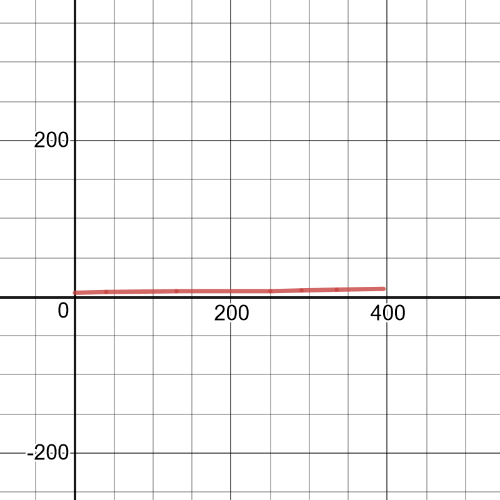
Here we have $textbf{a speed versus time graph}$ of Rachel’s climb:
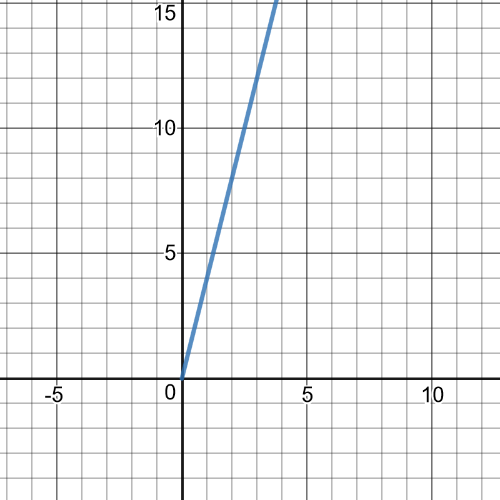
$textbf{The bottle have a constant diameter so the water level increases at a constant rate}$. The water level will rise the fastest in the container with the smallest diameter.The graph is on following picture:
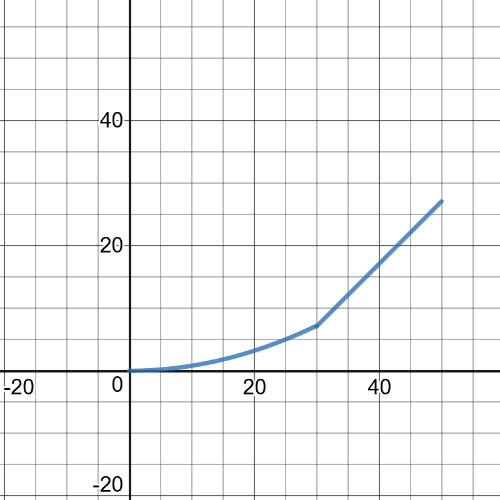
$textbf{The diameter of the vase varies, so the water level will increase at different rates}$. As the water level rises, the diameter of each crosssection gets smaller, causing the water level to increase more rapidly.So the graph must be nonlinear. The graph is on following picture:
Answers may vary. For example, on a graph that represents John’s speed a constant speed would be represented by a stright line, any increase in rate would be represented by a slanted line pointing up, and any decrease in rate would be represented by a slanted line pointing down. John’s speed over his bike ride could be represented following graph.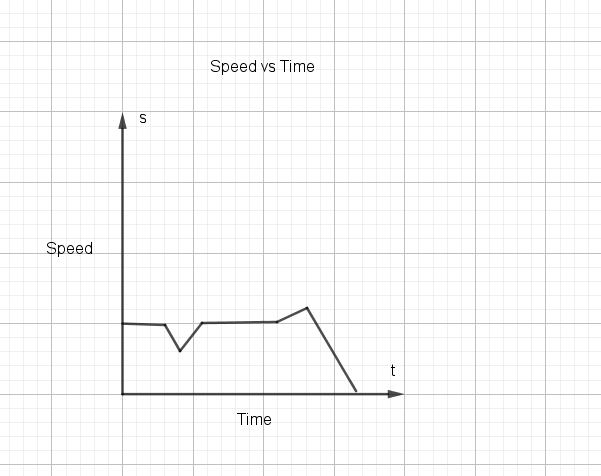
Answers may vary. For example, the first part of John’s bicycle ride is along a flat road. His height over this time would be constant.As he travels up the hill, his height would increase. At the top of the hill, his height would again be constant. As he goes down the hill, his height would decrease. As he climbs the second hill his height would again increase. The graph of his height over time would look something like this.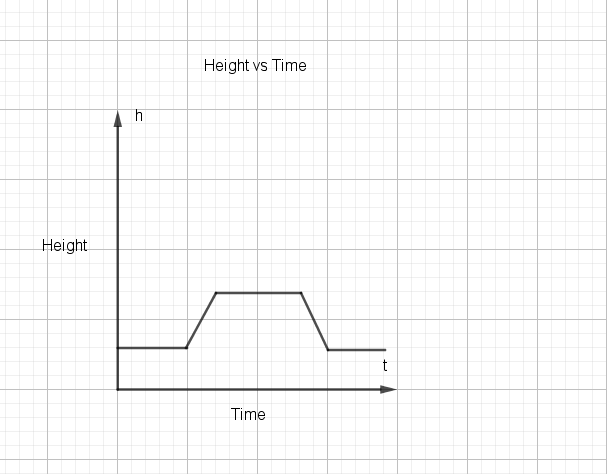
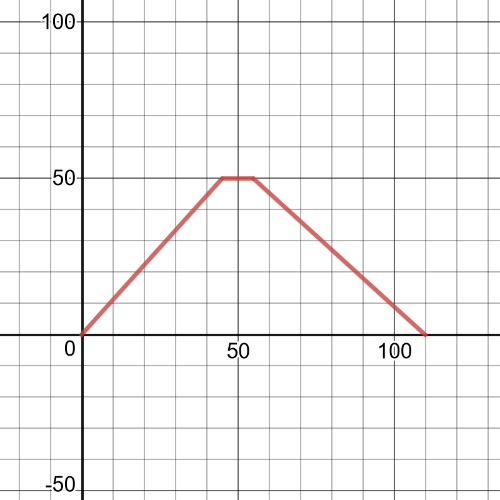
$textbf{The average speed for Kommy’s first length of the pool is}$:
Speed = $|dfrac{Delta{d}}{Delta{t}}|=|dfrac{50-0}{45-0}|=|dfrac{50}{45}|=1.11$ m/s
#### (b)
$textbf{The average speed for Kommy’s second length of the pool is}$:
Speed = $|dfrac{Delta{d}}{Delta{t}}|=|dfrac{0-50}{110-55}|=|-dfrac{50}{55}|=|-0.91|=0.91$ m/s
#### (c)
$$
textbf{For the first length, slope is positive and for the second length slope is negative.Also, slope of the second length is smaller than slope for the first one.}
$$
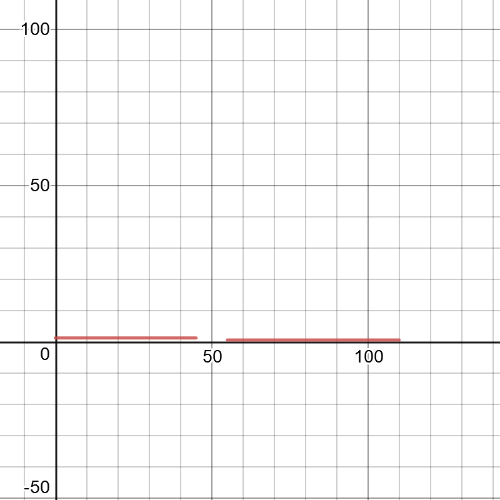
Here we have a $textbf{distance versus time graph for Kommy’s swim:}$
At $t=50$, he was resting, so, $textbf{his speed is}$ $0$ at that moment.
#### (f)
Here we have $textbf{a speed versus time graph for Kommy’s swim:}$
(a) – A
(b) – C
(c) – D
(d) – B
Explanation of those solutions are on page $103$ in this book.

(i)
Standing $5$ m i front of the sensor and then walking $3$ m toward it at a constant rate for $3$ s.Next, walking $3$ m away from the sensor for $3$ s.
(ii)
Standing $6$ m in front of the sensor and then walking $2$ m toward it at aconstant rate for $2$ s.Then, waiting there for $1$ s and then walking away from it $2$ m at a constant rate for $2$ s.
#### (b)
(i)
$textbf{speed}$ = $|dfrac{Delta{d}}{Delta{t}}|=|dfrac{2-5}{3-0}|=|-dfrac{3}{3}|=1$ m/s
$textbf{speed}$ = $|dfrac{Delta{d}}{Delta{t}}|=|dfrac{5-2}{6-3}|=|dfrac{3}{2}|=dfrac{3}{2}$ m/s
(ii)
$textbf{speed}$ = $|dfrac{Delta{d}}{Delta{t}}|=|dfrac{6-4}{2-0}|=|dfrac{2}{2}|=1$ m/s
$textbf{speed}$ = $|dfrac{Delta{d}}{Delta{t}}|=|dfrac{4-4}{3-2}|=0$ m/s
$textbf{speed}$ = $|dfrac{Delta{d}}{Delta{t}}|=|dfrac{4-2}{5-3}|=|dfrac{2}{2}|=1$ m/s
$textbf{speed}$ = $|dfrac{Delta{d}}{Delta{t}}|=|dfrac{2-4}{6-5}|=|-dfrac{2}{1}|=2$ m/s
Here we have $textbf{a speed versus time graph}$ to represent this situation given in this task:
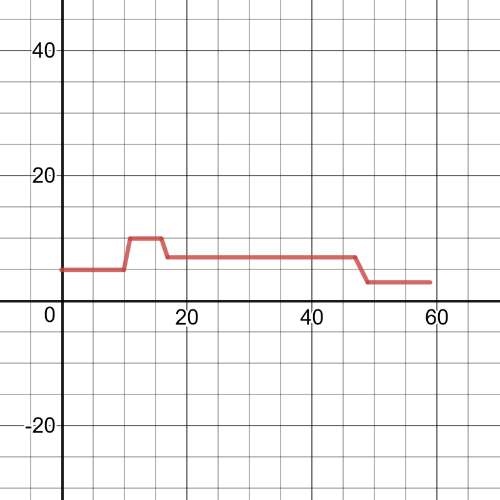
Equation of line that passes through points $(10,5)$ and $(11,10)$ is:
$y-5=dfrac{10-5}{11-10}(x-10)$ $Rightarrow$ $y=5x-45$
So, in order to calculate instaneous rate of change for $x=10.5$, let’s take two values $x=10.4$ and $x=10.6$, and their values of $y$ are:
$x=10.4: y=5cdot{10.4}-45=7$
$x=10.6:y=5cdot{10.6}-45=8$
So, finally,$textbf{ the instantaneous rate of change}$ in the runner’s speed at
$10.5$ min is:
$$
dfrac{Delta{y}}{Delta{x}}=dfrac{8-7}{10.6-10.4}=5
$$
#### (c)
The slopes of lines passes throgh points $(11,10$ and $(49,3)$ are, respectively:
$0$ and $-2$. so, $textbf{the average rate of change is}$:
$$
dfrac{-2-0}{49-11}=-dfrac{2}{38}=-0.31
$$
#### (d)
Answer for part (c) does not accurately represent the runner’s training schedule from minute $11$ to minute $49$ because we didn’t include all lines between this two points in our calculating average rate of change.
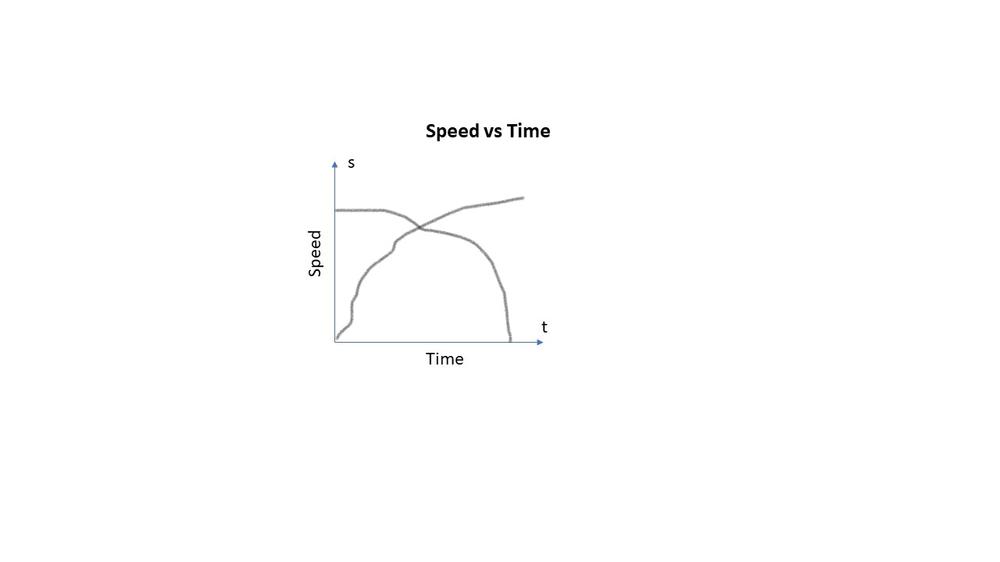
If the original graph showed a decrease in rate, it would mean that the distance travelled during each successive unit of time would be less-meaning a line that curves down.

