All Solutions
Page 313: Closure Activity
75% of those who do not believe in ghosts can be represented by the two coins. After tossing two coins, if there is atleast one head, then it is a non-believer of ghost. Then the 25% that believes in ghost will be represented by the two coins when it appeared to be two tails. Tossing the two coins 5 times would represent a group with 5 people.
#### b.
Use numbers 1 – 100 to assign the non-believer and believer of ghosts. Numbers 1 – 25 would be the believer of ghosts and 26 – 100 would be the non-believer of ghosts. Using the graphing calculator’s randInt, it would generate sets of 5 numbers randomly picked.
b. Using randInt with numbers 1 – 25 as believer and 26 – 100 as non-believer of ghost.
$$begin{aligned}
y &= 2x\
y &= x ^ {2}+5\
end{aligned}$$
$$begin{aligned}
2x &= x^{2}+5\
x^{2}-2x+5 &= 0\
(x^{2}-2x+1) +4 &=0\
(x-1)^{2} &= -4\
end{aligned}$$
Squaring both sides, we get
$$begin{aligned}
x-1 &= pm 2i\
x-1 &= -2i\
Rightarrow x_{1} &= 1-2i\
x-1 &= 2i\
Rightarrow x_{2} &= 1 + 2i\
end{aligned}
$$(b) text{No intersection}.$$
The mean is
$$
frac{1,489}{100}=14.89.
$$
In percentage, this is
$$
frac{14.89}{60}=0.2482=boldsymbol{24.82%}.
$$
$textbf{b.}$
We can see that 10 students had 20 or more points, so
$$
frac{10}{100}=0.1=boldsymbol{10%}.
$$
Only $10%$ of students got an A.
$textbf{c.}$
The results about the mean score, and about a percentage of students who got an A are nearly identical.
$textbf{d.}$
I would say that there is no need to prepare for the test, because as this simulation showed, blindly guessing will give you almost identical results.
$textbf{b.}$ $24.82%$
$textbf{c.}$ $10%$
$textbf{d.}$ No need to study hard.
mid2x-5mid=dfrac{-5+8}{3}=1
$$
3x^{2}+11x=4
$$
$$f(x) = sqrt[3]{4x-1} $$
We will replace first f(x) with y.
$$begin{aligned}
y &= sqrt[3]{4x-1}\
end{aligned}$$
$$begin{aligned}
x & = sqrt[3]{4y-1}\
end{aligned}$$
Cubing, both sides, we get.
$$begin{aligned}
x^{3} & = (sqrt[3]{4y-1})^{3}\
x^{3} & = 4y-1\
end{aligned}$$
$$begin{aligned}
y &= dfrac{x^{3}+1}{4}\
end{aligned}$$
Finally replace $y$ with $f^{-1}(x)$.
$$begin{aligned}
f^{-1} &= dfrac{x^{3}+1}{4}\
end{aligned}$$
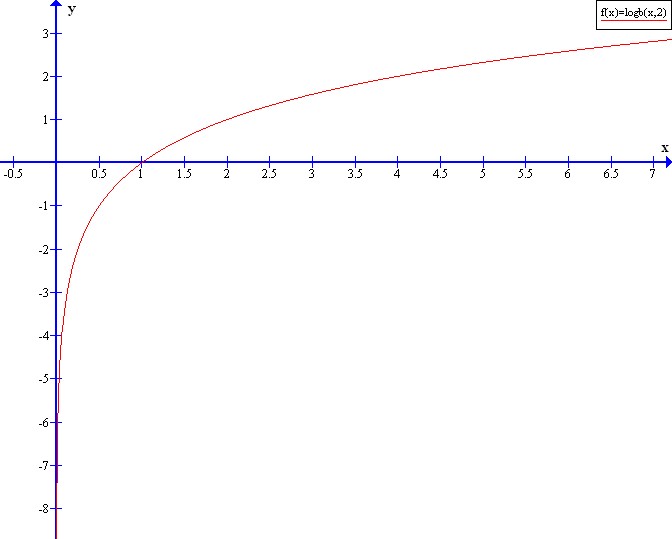
$$g(x) = log_{7}(x)$$
We will replace first g(x) with y.
$$begin{aligned}
y &= log_{7}(x)\
end{aligned}$$
$$begin{aligned}
x & = log_{7}(y)\
end{aligned}$$
Now, Solve for $y$. We get,
$$begin{aligned}
y &= 7^{x}\
end{aligned}$$
Finally replace $y$ with $g^{-1}(x)$.
$$begin{aligned}
g^{-1} &=7^{x}\
end{aligned}$$
$$(b) g^{-1} = 7^{x}$$

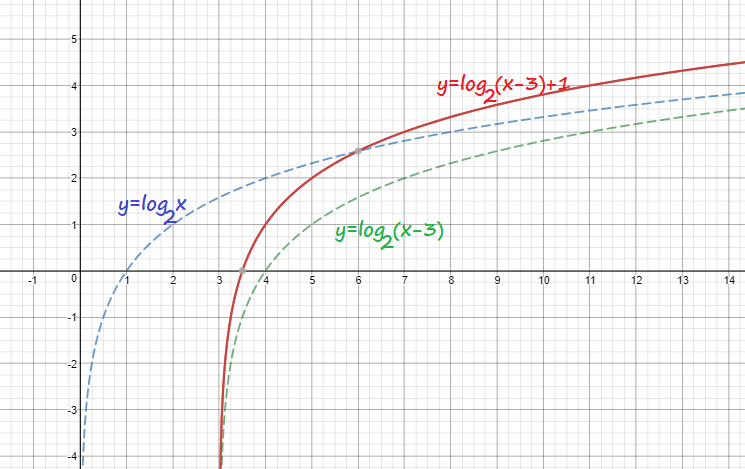
y=1+log_2(x-3)
$$

$$
frac{18}{120}=0.15=boldsymbol{15%}.
$$
Hence, $15%$ of 16-year-olds got into a car accident.
$textbf{b.}$
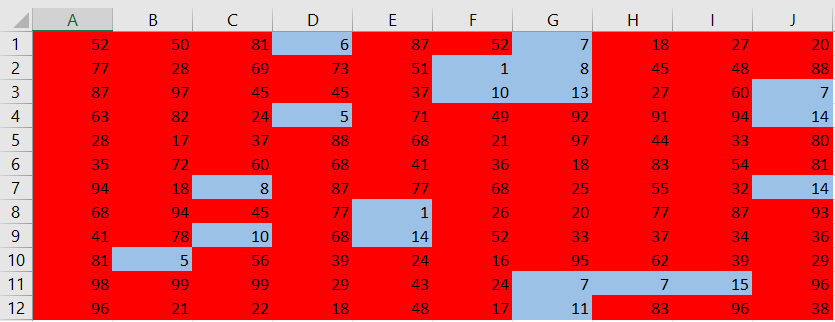
Let numbers 1-15 represent students who got into the accident, and 16-100 those who did not. Generate a random number between 1 and 100 for 120 times.
We will use MS Excel tool to run the simulation using the command $texttt{=RANDBETWEEN(1;100)}$ and coloring numbers 1-15 with blue, and other with red.

After discarding top $5%$ and bottom $5%$ of means, it remains that the required proportion is $15%pm 5%$.
$textbf{d.}$
Since $21%$ is outside the confidence interval, we can say that they are better drivers.
$textbf{b.}$ You can use $texttt{randInt(1, 100, 120)}$ command on your graphing calculator or $texttt{=RANDBETWEEN(1;100)}$ in MS Excel software.
$textbf{c.}$ $15%pm 5%$
$textbf{d.}$ Yes

