
All Solutions
Page 268: Questions
To experimentally determine the probability with a coin, these would be the steps to be followed:
begin{enumerate}
item Assign a side of the coin to each gender. For this example, we’ll take “heads” to indicate a girl has been born, and “tails” if a boy has been born.
item Set up a table to record your trials, such as this one:
begin{table}[h]
begin{tabular}{ccc}
textbf{Trial number} & textbf{Results} & textbf{Girl born?} \ hline
1 & T, H & Yes \
2 & T, T, T, T & No \
vdots & vdots & vdots
end{tabular}
end{table}
item For each trial, you will flip the coin at most 4 times. Stop flipping if either the coin lands on heads, or if it lands on tails four times.
item Register “yes” or “no” in the last column depending on your result.
item Repeat this 25 times. Count the number of times you wrote “yes” in the rightmost column. Divide the number by the total number of trials (25). That is your experimental probability.
end{enumerate}
Here’s an example of the results of 25 trials.
begin{table}[h]
begin{tabular}{ccc}
textbf{Trial number} & textbf{Results} & textbf{Girl born?} \ hline
1 & H & Yes\
2 & H & Yes\
3 & T,T,H & Yes\
4 & T,T,T,T & No\
5 & T,H & Yes\
6 & T,T,T,T & No\
7 & H & Yes\
8 & T,H & Yes\
9 & H & Yes\
10 & H & Yes\
11 & H & Yes\
12 & H & Yes\
13 & T,H & Yes\
14 & T,T,T,T & No\
15 & T,H & Yes\
16 & H & Yes\
17 & T,H & Yes\
18 & H & Yes\
19 & H & Yes\
20 & H & Yes\
21 & T,H & Yes\
22 & H & Yes\
23 & T,T,T,H & Yes\
24 & H & Yes\
25 & H & Yes\hline
end{tabular}
end{table}
textbf{Successes:} 22
textbf{Total number of trials:} 25
textbf{Experimental probability:} (frac{22}{25} = color{blue} 88%)
Joining your results with the rest of your class will increase your number of trials, and the experimental probability will gradually approach the theoretical probability of 93.75% (see Problem 6-3 on this page for details on how to reach this number).
begin{tabular}{|c|c|c|}
hline
Number of trial & Results & Girl born? \ hline
1 & 01 & textcolor{blue}{Yes} \ hline
2 & 01 & textcolor{blue}{Yes} \ hline
3 & 01 & textcolor{blue}{Yes} \ hline
4 & 1 & textcolor{blue}{Yes} \ hline
5 & 1 & textcolor{blue}{Yes} \ hline
6 & 1 & textcolor{blue}{Yes} \ hline
7 & 01 & textcolor{blue}{Yes} \ hline
8 & 1 & textcolor{blue}{Yes} \ hline
9 & 1 & textcolor{blue}{Yes} \ hline
10 & 1 & textcolor{blue}{Yes} \ hline
11 & 1 & textcolor{blue}{Yes} \ hline
12 & 1 & textcolor{blue}{Yes} \ hline
13 & 1 & textcolor{blue}{Yes} \ hline
14 & 01 & textcolor{blue}{Yes} \ hline
15 & 0000 & textcolor{red}{No} \ hline
16 & 1 & textcolor{blue}{Yes} \ hline
17 & 001 & textcolor{blue}{Yes} \ hline
18 & 1 & textcolor{blue}{Yes} \ hline
19 & 1 & textcolor{blue}{Yes} \ hline
20 & 01 & textcolor{blue}{Yes} \ hline
21 & 10 & textcolor{blue}{Yes} \ hline
22 & 0001 & textcolor{blue}{Yes} \ hline
23 & 1 & textcolor{blue}{Yes} \ hline
24 & 0001 & textcolor{blue}{Yes} \ hline
25 & 01 & textcolor{blue}{Yes} \ hline
end{tabular}
until they have a girl is:
$$
dfrac{textrm{Number of successful events }}{textrm{Total number of events}}=dfrac{24}{25}=0.96=textcolor{#4257b2}{96%}
$$
With a larger data set probability must be closer to theoretical probability i.e. $93.75%$
This is better estimate as coin can be unevenly weighted or have some other defects which may favour a side more than other whereas in this method numbers are generated randomly without any bias.
The probability of 4 boys is then: $left(dfrac{1}{2}right)^4=dfrac{1}{16}$.
The probability of first 3 boys and then a girl: $left(dfrac{1}{2}right)^4=dfrac{1}{16}$.
The probability of first 2 boys and then a girl: $left(dfrac{1}{2}right)^3=dfrac{1}{8}$.
The probability of first 1 boy and then a girl; $left(dfrac{1}{2}right)^2=dfrac{1}{4}$.
The probability of the first child to be a girl is $left(dfrac{1}{2}right)$.
Thus the probability of having a girl is then:
$$
dfrac{1}{16}+dfrac{1}{8}+dfrac{1}{4}+dfrac{1}{2}=dfrac{15}{16}=93.75%
$$
begin{center}
begin{tabular} {|c|c|c|}
hline
Player No. & Die No. & Nickel\
hline
Player 1 & 1 & Head\
hline
Player 2 & 2 & Head\
hline
Player 3 & 3 & Head\
hline
Player 4 & 4 & Head\
hline
Player 5 & 5 & Head\
hline
Player 6 & 6 & Head\
hline
Player 7 & 1 & Tail\
hline
Player 8 & 2 & Tail\
hline
Player 9 & 3 & Tail\
hline
Player 10 & 4 & Tail\
hline
Player 11 & 5 & Tail\
hline
Player 12 & 6 & Tail\
hline
end{tabular}
end{center}
$$
25%cdot 20% = 0.25cdot 0.2=0.05=5%
$$
b. Sine the probability of having a garage is independent of having a large back yard, the conditional probability of having a large backyard is equal to the probability of having a large backyard 75%.
b. 75%
The given survey question is misleading. Because of the content of the Jolly Juice in terms of vitamin E from other brands, it makes the statement already bias. This would lead people to answer the survey that Jolly Juice is the healthiest.
#### b.
Even the answer would only be a yes or no, the survey question will lead the people to answer yes right away. The question already speaks for itself and the result is already determined even without the question being conducted.
#### c.
The survey question is not giving any choice but to answer yes. The survey question could be tricky on the part of the respondents. If the respondent opposes, there are consequences that might happen. With this, respondents tend to answer in favor of the survey question.
#### d.
The survey question does not contain any bias. The survey question will let the respondents have the freedom to give their opinion. The result might vary because of the wide answer but it will give a more accurate answer.
b. Yes
c. Yes
d. No
b. The word defenseless makes people more inclined to answer yes and thus the question contains bias.
c. The question contains bias because the question makes the stand point of the surveyor obvious and then the respondents will be more inclined to agree.
d. This question does not contain any bias.
b. Yes
c. Yes
d. No
$$begin{aligned}
text{Radius of the cork}&= 2 text{cm}\
text{Height of the cork}&= 5 text{cm}\
text{Weight of the cork}&= 2.5 text{grams}\
end{aligned}$$
$$begin{aligned}
text{Volume}&= pi r^2 h\
end{aligned}$$
Substituting the values:
$$begin{aligned}
&= dfrac{22}{7}cdot (2)^2 cdot 5 \
&= 3.14cdot 4 cdot 5 \
&boxed{text{Volume}= 62.83 text{cm}^3} \
end{aligned}$$
$$begin{aligned}
text{density}&= dfrac{text{Mass}}{text{Volume}}\
end{aligned}$$
Substituting the values:
$$begin{aligned}
&= dfrac{2.5}{62.83}\
&boxed{text{density}= 0.0397 dfrac{text{g}}{text{cm}^3}}
end{aligned}$$
Density : $0.0397 dfrac{text{g}}{text{cm}^3}$
$$begin{aligned}
f(x)&= 2x^2 – 3x + 1rightarrow(1)\
g(x)&= 4x-2rightarrow(2)\
end{aligned}$$
$$begin{aligned}
2x^2 – 3x + 1&= 4x-2\
2x^2 – 3x -4x+1+2&=0\
2x^2 – 7x+3&=0rightarrow(3)\
end{aligned}$$
$$begin{aligned}
2x^2- 6x – x+3&=0\
2x(x-3)-1(x-3)&=0\
(2x-1) (x-3)&=0rightarrow(4)\
end{aligned}$$
$$begin{aligned}
2x-1&=0\
2x&=1\
&boxed{x=dfrac{1}{2}}\
end{aligned}$$
Also,
$$begin{aligned}
x-3&=0\
&boxed{x=3}\
end{aligned}$$
1. Draw a sphere to be an octopus’ head.
2. Draw four cones to be the octopus’ legs.
Based on the two wheels, it is most likely that the second roulette wheel is rigged. The consistency of the simulation would tell that it is okay, unlike the first roulette wheel.
A fair wheel would be both beneficial to the One-Eyed Jack Casino and also the players. This will have a fair competition for everyone.
$textbf{(b)}$ Below are results of 200 experiments:
$$
B, R, B, R, B, B, B, B, B, R, R, R, B, B, B, B, R, R, B, R,
$$
$$
B, B, B, R, R, R, B, B, B, R, B, R, R, R, B, R, R, R, B, R,
$$
$$
R, B, R, B, R, R, R, R, R, R, R, R, B, R, R, R, R, R, R, B,
$$
$$
B, R, B, B, B, B, R, B, R, B, R, B, R, B, B, R, B, R, B, B,
$$
$$
B, R, R, B, B, R, B, B, B, B, R, B, R, R, B, B, B, R, R, R,
$$
$$
B, R, B, B, R, R, R, B, B, B, B, R, B, B, R, B, R, R, R, B,
$$
$$
R, R, B,R, B, B, R, R, R, R, B, R, B, B, B, B, R, R, R, B,
$$
$$
R, R, B, B, B, B, B, R, B, B, B, B, R, B, R, R, B, B, R, B,
$$
$$
B, B, R, B, R, R, B, R, R, R, B, B, R, B, B, B, B, B, B, B,
$$
$$
R, B, B, B, B, R, B, B, B, R, B, R, B, R, R, B, R, R, B, B
$$
Total number of Red outcomes is: 93
Total number of Black outcomes is: 107
$textbf{(c)}$ It can be observed that there are 2 streaks of five or more reds and 3 streaks of five or more blacks.
$textbf{(d)}$ Wheel might be rigged if more number of streaks or longer streaks for a color are observed compare to other color
* $bullet$ Number of times Figure 1 is obtained: 31
* $bullet$ Number of times Figure 2 is obtained: 30
* $bullet$ Number of times Figure 3 is obtained: 29
* $bullet$ Number of times Figure 4 is obtained: 38
* $bullet$ Number of times Figure 5 is obtained: 28
* $bullet$ Number of times Figure 6 is obtained: 44
It can be observed Figure 5 have least probability i.e $0.14$
Expected value of getting Figure 5 is $dfrac{1}{textrm{Probability}}=$ 7.14
Hence, Katelyn should buy $text{textcolor{#4257b2}{8 meals}}$ to get all 6 action figures
$textbf{(b)}$ Below are results obtained after 10 more simulations:
* $bullet$ Number of times Figure 1 is obtained: 346
* $bullet$ Number of times Figure 2 is obtained: 374
* $bullet$ Number of times Figure 3 is obtained: 346
* $bullet$ Number of times Figure 4 is obtained: 359
* $bullet$ Number of times Figure 5 is obtained: 397
* $bullet$ Number of times Figure 6 is obtained: 378
It can be observed Figure 1 and Figure 3 have least probability i.e $0.1572$
Expected value of getting Figure 1 and Figure 3 is $dfrac{1}{textrm{Probability}}=$ 6.3613
Hence, Katelyn should buy $text{textcolor{#4257b2}{7 meals}}$ to get all 6 action figures
$textbf{(c)}$ After combining with team, the answer must be more closer to 6
It is possible to buy 50 or 100 meals to get all six figures as there is no certain value for maximum number of meals to be bought
For the first simulation, 9 meals had to be bought to obtain all action figures.
$textbf{b.}$
Totally, we ran 11 simulations. Our wait times for each simulations are:
$$
9, 9, 13, 10, 22, 10, 23, 14, 11, 19, 10
$$
The wait time, or the average number of meals is
$$
frac{9+9+13+10+22+10+23+14+11+19+10}{11}=boldsymbol{13.overline{63}}
$$
$textbf{c.}$
If you did this assignment in a team, compare and see what did everyone else get. You can help yourselves using the procedure described above.
$textbf{d.}$
It is possible to get all action figures if you buy only 6 meals. The biggest number of meals you would have to buy is a bit difficult to predict. Judging by our simulations before, I would say it is quite unlikely for that number to be greater than 30.
Although it is possible that we might have to buy 50 or 100 meals to get all action figures, but it is quite unlikely.
‘yes’ results – 11 out of 30 11/30=.36 or 36%
‘no’ results – 19 out of 30 19/30=.63 or 63%
Myriah should expect to do the dishes about 36% of the time or about 11 days of each month.
$$
7cdot dfrac{15}{36}=2.916667approx 3
$$
Thus about 3 days.
The question is:
If the canteen would offer a student meal, will you buy it at least once a week?
The research question trying to answer is:
How many students would take advantage of the budget-wise student meal?
#### b.
The question is:
The area of Math I found hard:
* Algebra
* Trigonometry
* Calculus
* Geometry
The research question trying to answer is:
What area do the students need more focus?
#### c.
The question is:
How many hours do you spend watching tv?
The research question trying to answer is:
What is the average time spent by teenagers watching tv?
3^x+5=x^2-5
$$
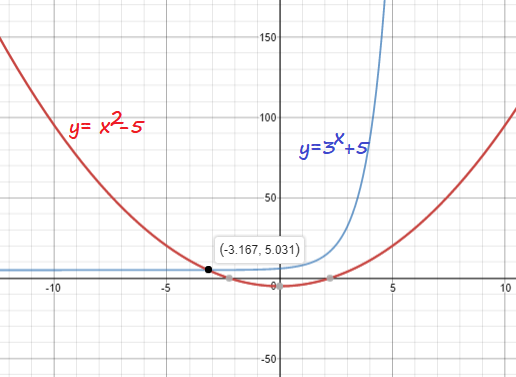
xapprox -3.167
$$
xapprox -3.167
$$
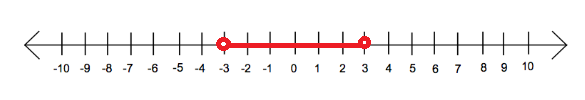
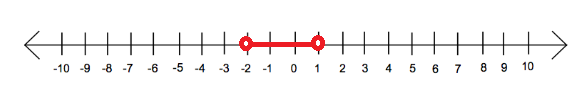
|x|<3
$$
-3<x<3
$$
|2x+1|<3
$$
$-3-1<2x+1-1<3-1$
$-4<2x<2$
$$
-2<x<1
$$
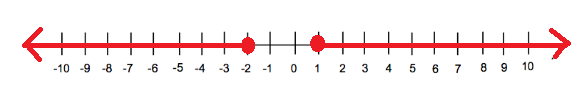
|2x+1|geq 3
$$
$2x+1-1leq -3-1$ or $2x+1-1geq 3-1$
$2xleq -4$ or $2xgeq 2$
$xleq -2$ or $xgeq 1$
b) $(-2,1)$
c) $(-infty, -2]cup[1,infty)$
f(x)=dfrac{1}{2}(x+1)^3
$$
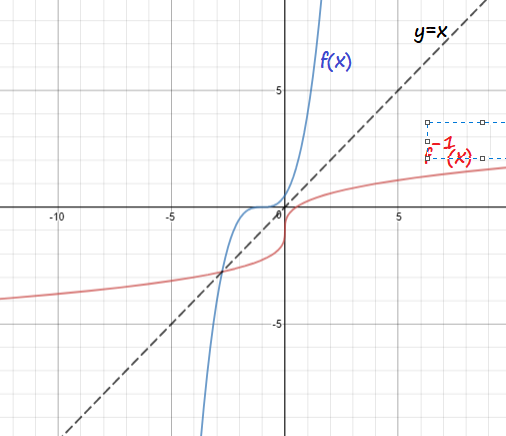
$x=dfrac{1}{2}(y+1)^3$
$2x=(y+1)^3$
$y+1=sqrt[3]{2x}$
$y=sqrt[3]{2x}-1$
$$
f^{-1}(x)=sqrt[3]{2x}-1
$$
f^{-1}(x)=sqrt[3]{2x}-1
$$
$$
dfrac{textrm{Number of blue candies}}{textrm{Total number of candies}}
$$
Simulating such a scenario expecting to get 50 candies per package we have below result:
Brown: 8
Yellow:10
Red:5
Orange:10
Green:7
Blue.10
Hence, for above simulation proportion of blue candies is $dfrac{10}{50}=textcolor{#4257b2}{0.2}$
$$0.20,
0.20,
0.16,
0.08,
0.14,
0.26,
0.12,$$
$$0.18,
0.08,
0.12,
0.2,
0.16,
0.20,
0.10,$$
$$
0.26,
0.22,
0.28,
0.28,
0.14,
0.18,$$
$$
0.08,
0.16,
0.22,
0.16,
0.12
$$
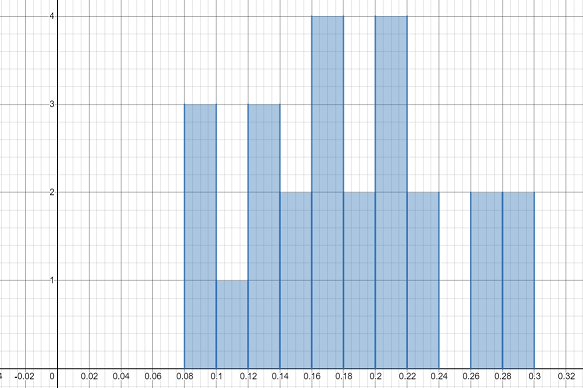
below table:\\
begin{tabular}{|c|c|}
hline
textbf{Class} & textbf{Frequency} \ hline
$0.08-0.10$ & 3 \ hline
$0.10-0.12$ & 1 \ hline
$0.12-0.14$ & 3 \ hline
$0.14-0.16$ & 2 \ hline
$0.16-0.18$ & 4 \ hline
$0.18-0.20$ & 2 \ hline
$0.20-0.22$ & 4 \ hline
$0.22-0.24$ & 2 \ hline
$0.24-0.26$ & 0 \ hline
$0.26-0.28$ & 2 \ hline
$0.28-0.30$ & 2 \ hline
end{tabular}\\
Below is histogram for above frequency table:
$$
begin{align*}
overline{x}&=dfrac{4.3}{25}\
&=textcolor{#4257b2}{0.172}
end{align*}
$$
Mean proportion gives estimate of expected value of proportion received in a random packet
$textbf{(d)}$ We expect the proportion of blue candies in the sample to be between $text{textcolor{#4257b2}{underline{0.08}}}$ and $text{textcolor{#4257b2}{underline{0.3}}}$.
$textbf{(e)}$ Proportion of blue candies in whole population is $color{#4257b2}{0.172 pm 0.11}$
Margin of error is 0.11
begin{tabular}{|c|c|c|}
hline
textbf{Number of simulation} & textbf{Results} & textbf{Number of matches} \ hline
1 & $2,2,1,1,1,2,1$ & 7 \ hline
2 & $2,2,1,2,2$ & 5 \ hline
3 & $1,2,1,1,2,1$ & 6 \ hline
4 & $2,2,1,1,1,2,2$ & 7 \ hline
5 & $2,1,2,2,1,2$ & 6 \ hline
6 & $2,2,2,1,1,1,1$ & 7 \ hline
7 & $2,2,2,1,1,1,2$ & 7 \ hline
8 & $1,1,1,2,1$ & 5 \ hline
9 & $2,1,1,2,1,2,2$ & 7 \ hline
10 & $1,2,2,2,1,2$ & 6 \ hline
11 & $2,2,2,1,2$ & 5 \ hline
12 & $1,2,1,1,1$ & 5 \ hline
13 & $2,1,1,2,1,1$ & 6 \ hline
14 & $2,2,2,2$ & 4 \ hline
15 & $1,1,1,1$ & 4 \ hline
16 & $1,1,2,2,1,2,2$ & 7 \ hline
17 & $2,2,2,1,1,1,2$ & 7 \ hline
18 & $2,1,1,1,1$ & 5 \ hline
19 & $1,1,2,2,2,1,2$ & 7 \ hline
20 & $1,2,1,2,2,2$ & 6 \ hline
21 & $1,1,1,2,1$ & 5 \ hline
22 & $2,2,2,2$ & 4 \ hline
23 & $1,2,1,2,1,1$ & 6 \ hline
24 & $1,1,2,1,1$ & 5 \ hline
25 & $2,2,2,2$ & 4 \ hline
end{tabular}
$$
dfrac{143}{25}=textcolor{#4257b2}{5.72 textrm{ games}}
$$
begin{tabular}{|c|c|c|}
hline
textbf{Number of simulation} & textbf{Results} & textbf{Longest streak} \ hline
1 & $1,1,0,0,0,0,1,1,1,0,0,0,0,0,1,1,1,0,0,0$ & 3 \ hline
2 & $1,1,0,1,1,1,0,1,1,1,1,0,0,0,0,1,0,1,1,1$ & 4 \ hline
3 & $0,0,1,1,0,1,1,1,0,0,0,1,1,0,0,1,1,1,0,1$ & 3 \ hline
4 & $1,1,0,0,1,1,0,1,0,0,0,0,0,0,0,1,1,1,0,0$ & 3 \ hline
5 & $0,0,1,0,0,0,0,0,1,0,0,0,1,1,1,1,0,1,0,1$ & 4 \ hline
6 & $1,1,0,1,0,1,0,1,0,0,1,1,0,0,1,0,1,1,0,1$ & 2 \ hline
7 & $1,0,1,1,1,1,0,0,1,0,0,0,1,1,0,0,1,0,0,1$ & 4 \ hline
8 & $1,1,0,1,0,0,1,1,1,0,1,0,1,1,1,0,0,1,0,1$ & 3 \ hline
9 & $0,0,1,0,1,1,1,1,1,0,1,1,1,0,0,1,0,0,0,1$ & 5 \ hline
10 & $1,0,1,0,0,0,1,1,0,1,1,0,0,1,1,1,0,1,0,0$ & 3 \ hline
11 & $1,0,1,0,1,0,1,0,1,0,1,1,1,0,0,1,1,0,0,0$ & 3 \ hline
12 & $1,0,0,0,1,1,1,0,1,1,1,0,1,0,1,0,1,0,1,1$ & 3 \ hline
13 & $0,1,0,1,0,0,1,1,1,1,0,1,0,0,1,1,0,1,1,1$ & 4 \ hline
14 & $0,0,0,0,1,0,1,0,0,1,0,1,0,0,0,0,1,0,1,1$ & 2 \ hline
15 & $1,1,0,0,0,1,1,0,1,0,1,1,0,1,1,0,1,1,0,0$ & 2 \ hline
16 & $0,0,0,1,0,0,1,1,1,1,1,0,0,0,0,1,0,1,1,0$ & 5 \ hline
17 & $1,1,0,1,0,1,0,0,0,0,0,1,1,1,0,1,0,0,0,0$ & 3 \ hline
18 & $0,1,1,0,0,0,1,1,0,0,1,1,0,0,1,0,1,0,1,0$ & 3 \ hline
19 & $1,0,1,1,1,0,0,1,1,1,0,0,0,0,1,0,1,1,0,0$ & 3 \ hline
20 & $1,1,0,1,0,0,1,1,0,1,1,1,0,0,0,0,1,1,1,1$ & 4 \ hline
21 & $1,1,0,1,0,1,0,1,0,0,1,0,1,0,0,1,0,0,1,1$ & 2 \ hline
22 & $0,1,0,1,0,1,1,1,1,1,0,1,1,0,0,0,1,1,0,0$ & 5 \ hline
23 & $0,1,1,0,1,0,1,1,0,0,0,1,0,0,0,1,1,1,0,1$ & 3 \ hline
24 & $0,0,1,1,1,0,0,1,0,0,1,0,1,1,0,1,0,0,0,1$ & 3 \ hline
25 & $0,1,1,1,1,0,0,1,0,0,0,1,1,1,1,1,1,0,0,0$ & 6 \ hline
end{tabular}
$$
dfrac{85}{25}=textcolor{#4257b2}{3.4}
$$
The streak must be $text{textcolor{#4257b2}{at least 4}}$ successful throws long before it is considered unusual.
$$
frac{18}{38},
$$
while the probability of a ball landing on green is
$$
frac{2}{38}.
$$
Make an area model as below:
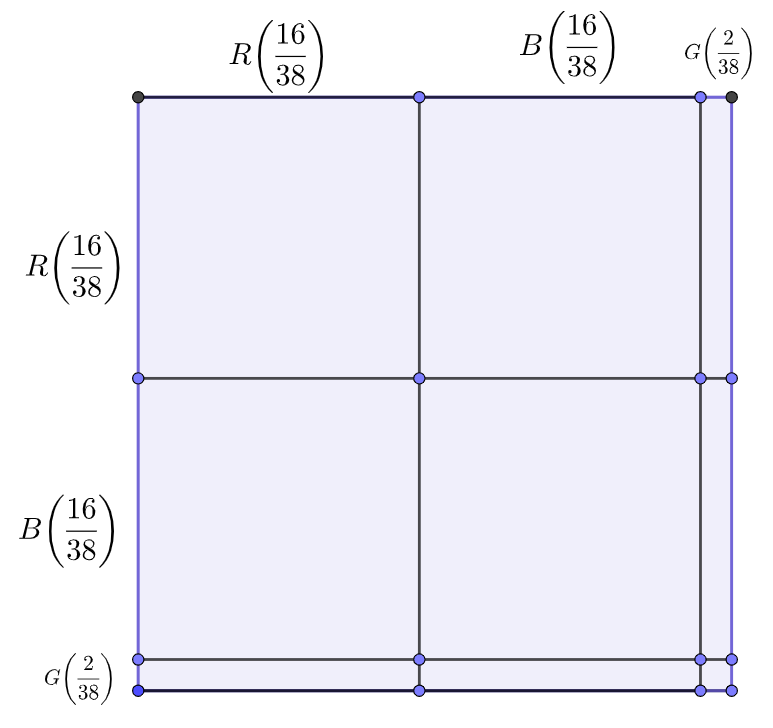
Probability of the ball landing on red twice in a row is represented by an area of a RR rectangle which is
$$
frac{18}{38}cdot frac{18}{38}=frac{9}{19} cdot frac{9}{19} = frac{81}{361} approx boldsymbol{22.44%}.
$$
$textbf{c.}$
Probability of the ball landing on red on the second spin is represented by a sum of areas of RR, BR, and GR triangles, thus:
$$
frac{18}{38}cdot frac{18}{38}+frac{18}{38}cdot frac{18}{38}+frac{2}{38}cdot frac{18}{38}=frac{81}{361}+frac{81}{361}+frac{9}{361}=frac{171}{361}approx boldsymbol{47.37%}.
$$
$textbf{d.}$
Since it is given that the first spin was red, we consider only the first column. The required probability is the ratio of areas of RR rectangle and the sum of areas of RR, RB, RG rectangles.
$$
frac{frac{81}{361}}{frac{81}{361}+frac{81}{361}+frac{9}{361}} approx boldsymbol{47.37%}.
$$
$textbf{e.}$
They are the same because the probability of the ball landing on red is a single spin is $frac{18}{38}$, or $approx boldsymbol{47.37%}.$
$textbf{b.}$ $approx 22.44%$
$textbf{c.}$ $approx 47.37%$
$textbf{d.}$ $approx 47.37%$
$textbf{e.}$ Probabilites are the same.
People could answer the genre of music, or an artist or a song.
* – The place where the survey was conducted is not random. Only adults will be able to answer the survey. Their preference might be different from teenagers or even kids.
* – The survey question is too broad. It does not directly ask if the survey is pertaining to the genre of the music, the title of a song or the year of music.
* – The surveyor might encounter people with multiple answers, making the result not accurate.
$$
dfrac{1}{2}=dfrac{16}{x^2-4}
$$
Use cross multiplication:
$$
(1)(x^2-4)=(16)(2)
$$
Simplify:
$$
x^2-4=32
$$
Add 4 to both sides of the equation:
$$
x^2=36
$$
Take the square root of both sides of the equation:
$$
x=pm 6
$$
x=pm 6
$$
Also, people who support the dance are highlighted in $color{#4257b2}text{blue}$, and those who do not are colored in $color{#c34632}text{red}$.
In the last, separated row, there are proportions of students who support the dance. With this, $textbf{a.}$ and $textbf{b.}$ are solved.
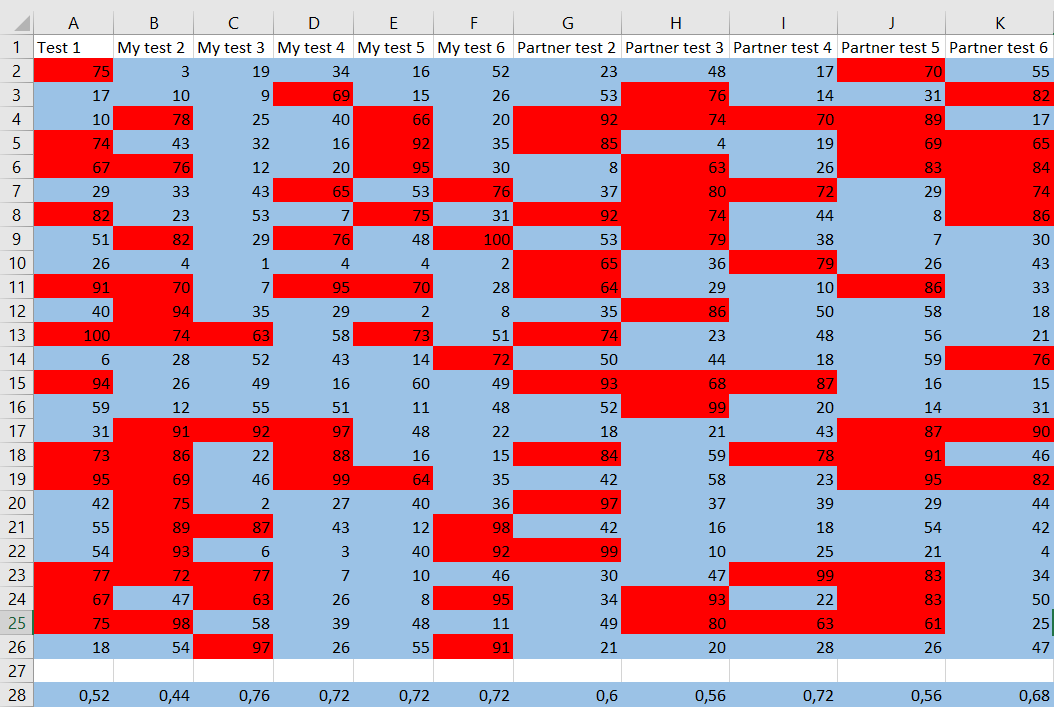
The mean of all proportions combined is
$$
frac{0.52+0.44+0.76+0.72+0.72+0.72+0.6+0.56+0.72+0.56+0.68}{11}approx boldsymbol{0.64},
$$
which is very close to $0.6$, which is we would expect. This is because $0.6$ is the expected proportion.
$textbf{d.}$
We have to find the middle $90%$ of all means, which means that the lower bound should be $0.52$, and the upper bound $0.72$.
$textbf{e.}$
The margin of error is half of range between the bounds, so the margin of error is
$$
frac{0.72-0.52}{2}=boldsymbol{0.1}.
$$
The required proportion is
$$
boldsymbol{0.64pm 0.1}.
$$
With this, since the proportion obtained was $0.64pm 0.1$, even with the margin of error, the principal should have the convincing evidence.
Larger sample means more credible results.
$textbf{b.}$
If the results on the sample of 25 students were credible, and they should be since the mean of proportions was close to the expected value, then the margin of error should be similar. On a larger sample, it could be even smaller because the mean could be closer to the real proportion.
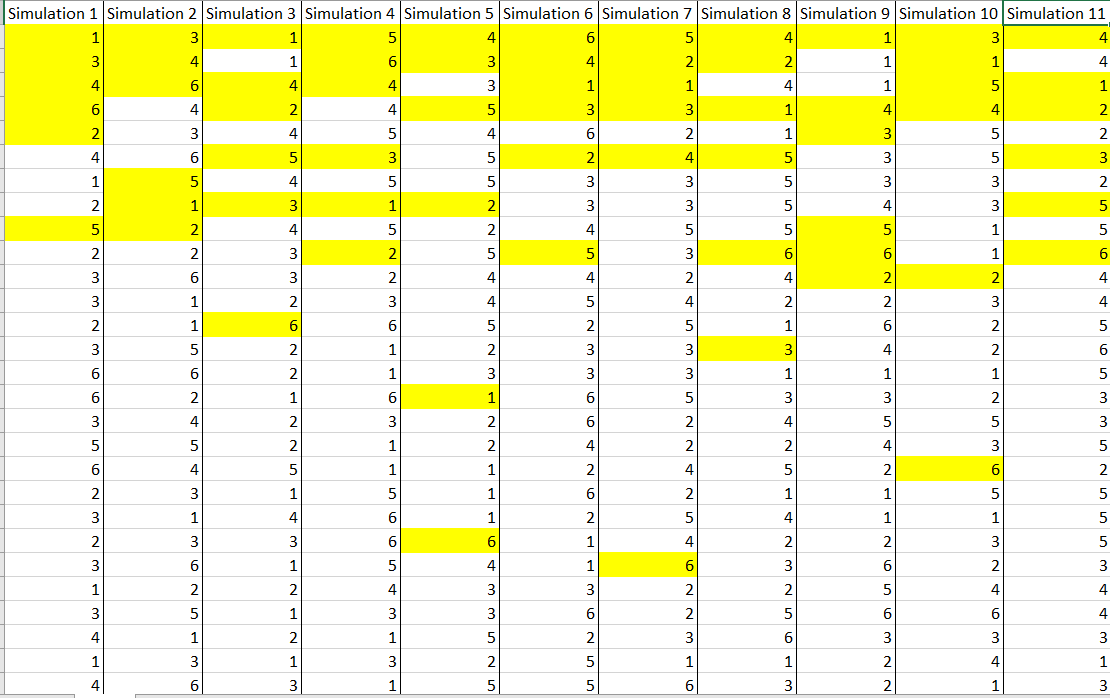
Let’s set up 5 simulations for 100 students. The results will be written as in the previous problem. People who support the dance are highlighted in $color{#4257b2}text{blue}$, and those who do not are colored in $color{#c34632}text{red}$.
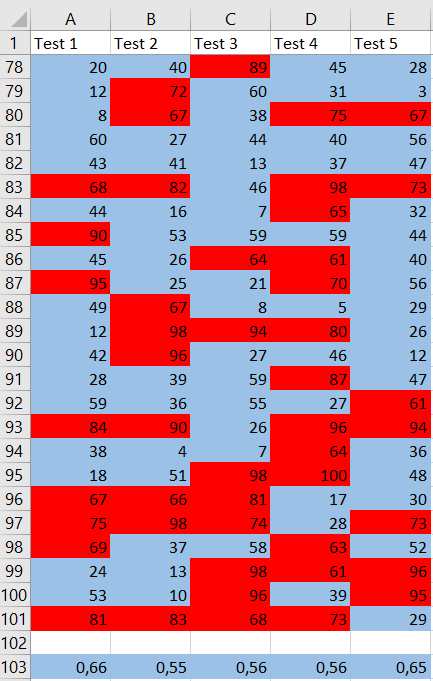
The mean of all proportions combined is
$$
frac{0.66+0.55+0.56+0.56+0.65}{5}approx boldsymbol{0.596},
$$
which is extremely close to $0.6$, which is what we would expect. This is because $0.6$ is the expected proportion.
Comparing with the class, it turns out that the lower bound is $0.568$, and the upper bound $0.64$. In that case, the margin of error is
$$
frac{0.64-0.568}{2}=0.036
$$
$textbf{e.}$
If nothing else, the principal should be more convinced. The results gather even more around $0.6$ which is expected value and that means that by increasing the sample, results got more credible. The principal may argue that the sample was not representative enough, but surely, their results should not be discarded.
The margin of error in that problem was quite large and it could be argued that the lower bound minus the margin could end up being less than 0.5 (maybe it happened in your class). In our measurement, it was near that value, but not under, and the sample was small, so the principal could not be sure.
To find the mean proportion, we have to add all proportions and divide by 100 (a number of samples). Luckily, we are given the sum, 7.83, so the mean proportion is
$$
frac{7.83}{100}=boldsymbol{7.83%}.
$$
$textbf{b.}$
Out of 100 samples, the lowest 5 represent the lower $5%$, and the greatest 5 the upper $5%$. We have to dismiss these values, and they are 0.02, 0.04, 0.05, 0.05, 0.05, so the lower bound will be $boldsymbol{0.05}$. We also dismiss 0.11, 0.11, 0.12, 0.12, 0.13, so the upper bound is $boldsymbol {0.11}$.
$textbf{c.}$
The proportion of defective flashlights in the whole population is $boldsymbol{7.83%}$ with the margin of error $frac{0.11-0.05}{2}=0.03=boldsymbol{3%}$.
$textbf{b.}$ $0.05$ and $0.11$
$textbf{c.}$ $7.83%pm 3%$
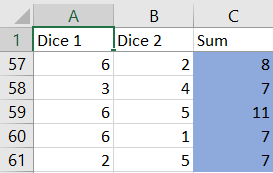
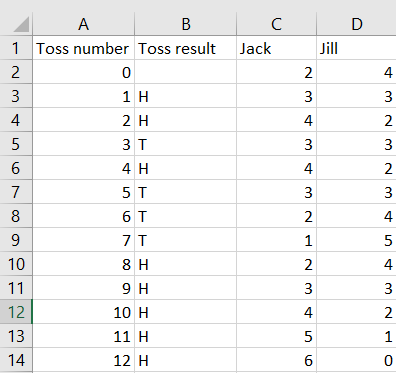
You could use your online studying materials to simulate dice rolling, or you could use your graphing calculators or computer software. We are going to use MS Excel tool. You can try any spreadsheet software yourself. Type the command $texttt{=RANDBETWEEN(1;6)}$ into the function bar and copy-paste the command to all required cells. A random integer from 1 to 6 will be generated in each cell, representing the dice roll. I will show my results below.
Myriah doing the dishes will be represnted with $color{#c34632}text{red}$ highlighting, and parents doing the dished with $color{#4257b2}text{blue}$ highlighting.
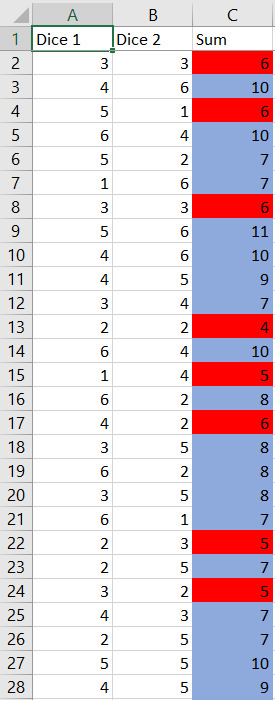
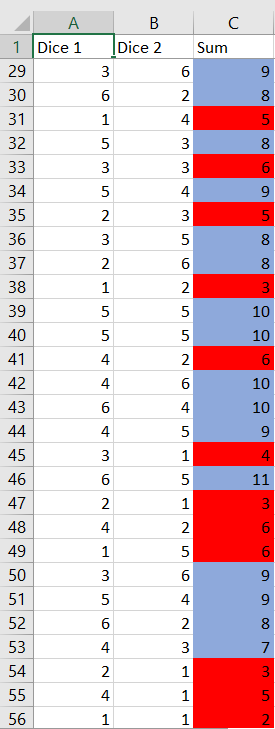
$textbf{b.}$ This simulation have shown that she will have to do dishes 3 or more times in a row in 2 instances.
$$begin{aligned}
y&= log_{12}(x)rightarrow(1)\
end{aligned}$$
Re-writing equation(1) in exponential form:
$$begin{aligned}
x&= 12^{y}
end{aligned}$$
$$begin{aligned}
x&= log_{y}(17)rightarrow(2)\
end{aligned}$$
Re-writing equation(2) in exponential form:
$$begin{aligned}
y^x&= 17\
end{aligned}$$
$$begin{aligned}
y&= 1.75^{2x}rightarrow(3)\
end{aligned}$$
Re-writing equation(3) in exponential form:
$$begin{aligned}
log_{1.75}(y)&= log_{1.75}(1.75)^{2x}\
log_{1.75}(y)&=2x log_{1.75}(1.75)\
log_{1.75}(y)&=2x\
end{aligned}$$
$$begin{aligned}
3y&= x^7rightarrow(4)\
end{aligned}$$
Re-writing equation(4) in exponential form:
$$begin{aligned}
log_{x}(3y)&= log_{x}(x^7)\
log_{x}(3y)&=7\
end{aligned}$$
Equation to be solved by Jenna,
$$begin{aligned}
dfrac{3}{x-2} + dfrac{8}{10}&= dfrac{x}{x-2}rightarrow(1)\
end{aligned}$$
$$begin{aligned}
dfrac{3}{x-2} cdot 10 + dfrac{8}{10}cdot 10&= dfrac{x}{x-2}cdot10rightarrow(1)\\
&boxed{dfrac{30}{x-2} + 8=dfrac{10x}{x-2}rightarrow(2)}\\
end{aligned}$$
Hence, equation (2) is the new equation.
Eliminating $dfrac{30}{x-2}$:
Subtracting $dfrac{30}{x-2}$ both sides,
$$begin{aligned}
dfrac{30}{x-2} – dfrac{30}{x-2} +8 – dfrac{30}{x-2} &= dfrac{10x}{x-2}-dfrac{30}{x-2}\\
8&= dfrac{10x-30}{x-2}\\
8(x-2)&= 10x-30\
8x-16&=10x-30\
8x-10x&= -30+16\
-2x&= -14\\
x&=dfrac{14}{2}\\
&boxed{x=7}
end{aligned}$$
Left-hand side:
$$begin{aligned}
&=dfrac{3}{7-2}+dfrac{8}{10}\\
&= dfrac{3}{5}+dfrac{4}{5}\\
&= dfrac{7}{5}rightarrow(a)\\
end{aligned}$$
Right-hand side:
$$begin{aligned}
&=dfrac{7}{7-2}\\
&=dfrac{7}{5}rightarrow(b)\
end{aligned}$$
From $(a)$ and $(b)$, it is clear $x = 7$ is the right answer.
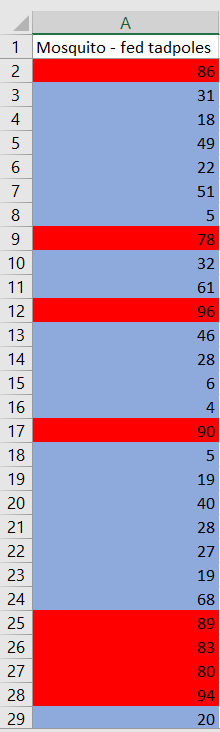
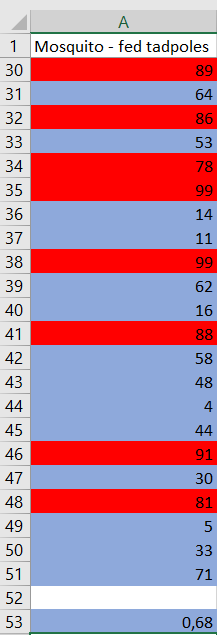
Surviving tadpoles will be highlighted $color{#4257b2}text{blue}$ and dying $color{#c34632}text{red}$. As calculated, the proportion of surviving tadpoles is $boldsymbol 68%$.
The results of simulation are below. It is done using the same software, with the same conditions.
Surviving tadpoles will be highlighted $color{#4257b2}text{blue}$ and dying $color{#c34632}text{red}$. As calculated, the proportion of surviving tadpoles is $boldsymbol 56%$.
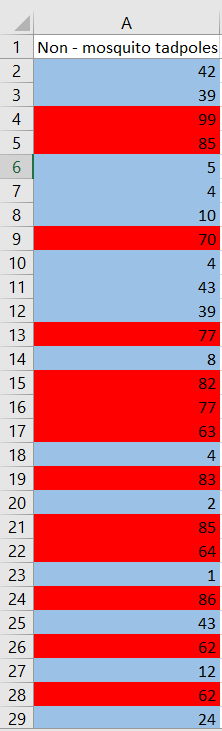
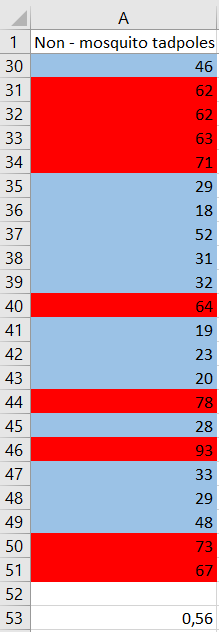
The difference between these proportions is $68%-56%=boldsymbol{12%}$.
$textbf{d.}$
A positive difference means that the proportion of surviving tadpoles who were mosquito fed is greater than the proportion of surviving non mosquito fed tadpoles.
A negative difference means the converse.
$textbf{e.}$
Out of 100 samples, the lowest 5 represent the lower $5%$, and the greatest 5 the upper $5%$. We have to dismiss these values, and they are $-0.07$, $-0.05$, $-0.04$, $-0.04$, $-0.02$, so the lower bound will be $boldsymbol{-0.01}$. We also dismiss 0.30, 0.30, 0.30, 0.33, 0.36, so the upper bound is $boldsymbol {0.29}$.
The margin of error is $frac{0.29-(-0.01)}{2}=boldsymbol{0.15}$.
$textbf{f.}$
Since the means of proportion was $0.14$, we can predict that the difference between surviving tadpoles who were mosquito fed, and those who were not is $boldsymbol{14% pm 15%}$.
$textbf{g.}$
The difference of zero means that the same proportion of tadpoles survived, no matter if they were mosquito fed or not.
$textbf{h.}$
While it appears that there is a difference, we cannot be entirely convinced because the margin of error is greater than the mean of differences.
Out of 100 samples, the lowest 5 represent the lower $5%$, and the greatest 5 the upper $5%$. We have to dismiss these values, and they are $0.51$, $0.52$, $0.54$, $0.54$, $0.56$, so the lower bound will be $boldsymbol{0.56}$. We also dismiss 0.74, 0.75, 0.76, 0.76, 0.77, so the upper bound is $boldsymbol {0.74}$.
$textbf{b.}$
The margin of error is
$$
frac{0.74-0.56}{2}=boldsymbol{0.09}.
$$
The simulation mean is $65%$, so the predicted proportion is $boldsymbol{65%pm 9%}$.
$textbf{b.}$ The predicted proportion is $65%pm 9%$.
Since $1.3%$ of 1000 is 13, and $4.7%$ of 1000 is 47, we can predict that if they surveyed 1000 passengers, the number of those who lost their luggage will be between 13 and 47.
$tan 44=dfrac {x}{28}$
$0.9657=dfrac {x}{28}$
$x=0.9657 times 28$
$$
x=27.04 mathrm { ~feet}
$$
$cos 32=dfrac {150}{x}$
$0.848=dfrac {150}{x}$
$x=dfrac {150}{0.848}$
$$
x=176.88 mathrm { ~cm}
$$
$sin 38=dfrac {x}{47}$
$0.6157=dfrac {x}{47}$
$x=0.6157 times 47$
$$
x=28.94 mathrm { ~meters}
$$
b- $x=176.88 mathrm { ~cm}$
c- $x=28.94 mathrm { ~meters}$
There are multiple ways how to do this. One way would be flipping a coin 3 times, because there are 8 different outcomes. We could map each possible outcome to a different student.
$textbf{b.}$
The answer is 3, and the method is described in $textbf{a.}$
$textbf{c.}$
Yes. We can apply the method described. If the outcome of tossing a coin 3 times correspond to the absent student, we can just repeat the process.
$textbf{b.}$ 3
$textbf{c.}$ Apply the method described above. If the outcome correspond to the absent student, repeat the process.
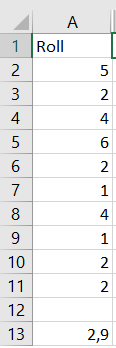
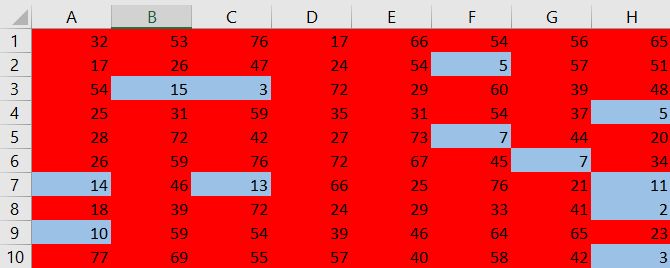
You could use your online studying materials to simulate dice rolling, or you could use your graphing calculators or computer software. We are going to use MS Excel tool. You can try any spreadsheet software yourself. Type the command $texttt{=RANDBETWEEN(1;6)}$ into the function bar and copy-paste the command to all required cells. A random integer from 1 to 6 will be generated in each cell, representing the dice roll. I will show my results below.
The mean turned out to be $2.9$.
Since there would be 2 people working in a group, each one of us made a simulation and recorded the result. The mean can also be seen for each sample, below the list of outcomes.

We will pretend that the class has 6 people. That would be 30 testing since everyone produces five simulations. Record the data in the table and draw a histogram of means (otherwise it would be too tedious to make a histogram of all data). The mean is found to be $3.58$.
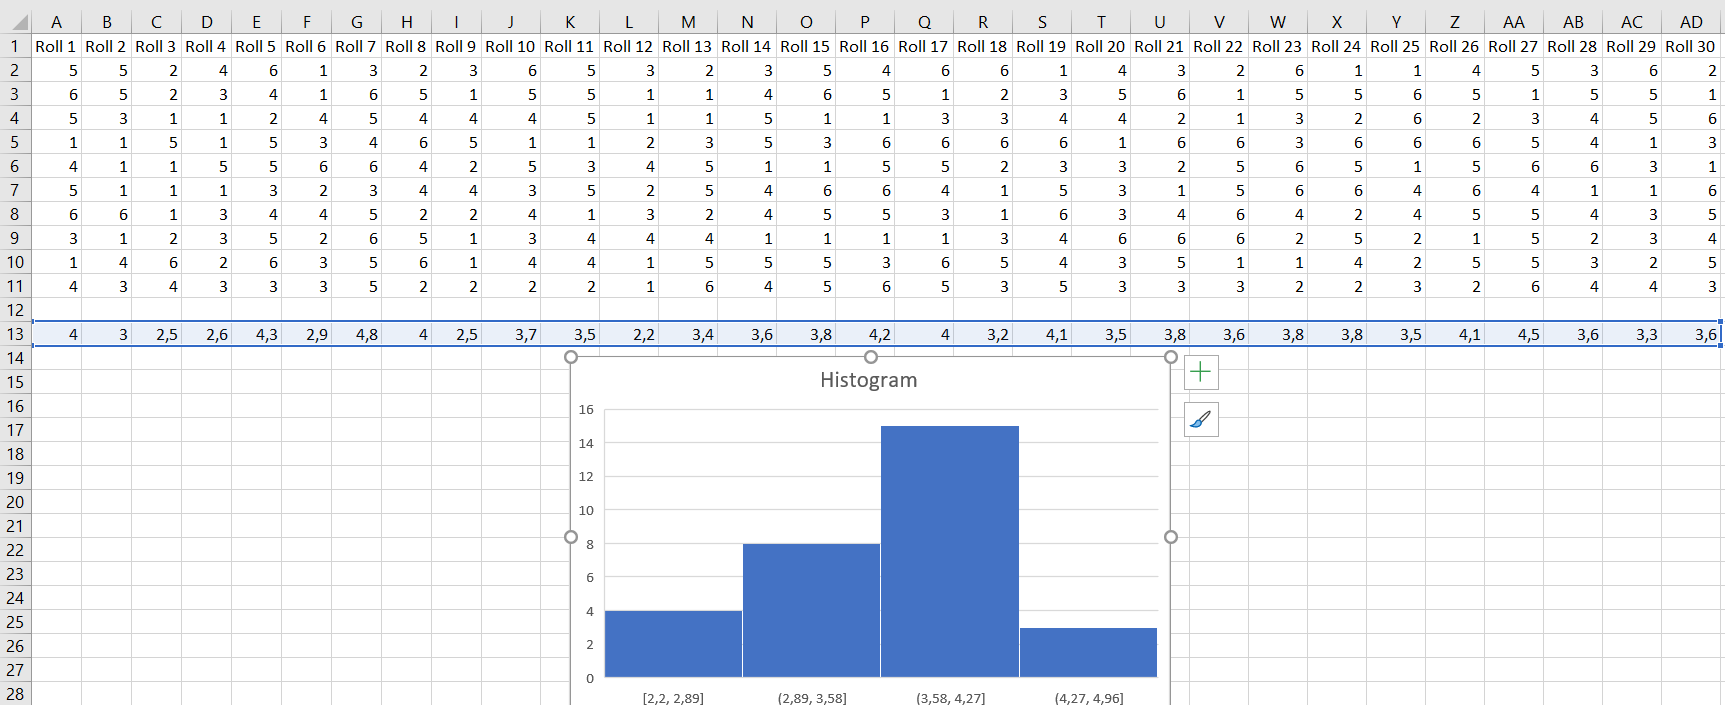
Discard bottom $5%$ and top $5%$ of means. The lower bound is $2.5$ and the upper bound is $4.3$
Thus, it can be inferred that the probability that a person prefers an action movie is $dfrac{1}{2}$. Similarly, the probability that a person prefers a romantic movie is also $dfrac{1}{2}$.
The question asks what are the chances that a group of 4 will prefer one genre over the other unanimously.
Accordingly, each of the 4 persons will have a 50% chance that she prefers action or romantic movies.
Thus,
$$begin{aligned}
text{P(group of 4 will prefer one genre over the other)} &= dfrac{1}{2} times dfrac{1}{2} times dfrac{1}{2} times dfrac{1}{2} \\
&=dfrac{1}{16}
end{aligned}$$
Therefore, there is a $6.25 % left(dfrac{1}{16} times 100right)$ chance that a group of 4 persons will prefer one genre over the other unanimously.
The conclusion arrived is plausible as one person’s preference is independent of the other person’s preference. Also, the plausibility is based on the assumption that there was no preconceived notion attached to any one genre.
| | | | | |
|–|–|–|–|–|
|24551 |24656 |24764 |24889 |24928 |
|24574 |24656 |24767 |24893 |25020 |
|24600 |24691 |24782 |24895 |25024 |
|24609 |24705 |24791 |24904 |25025 |
|24612 |24717 |24793 |24910 |25028 |
|24615 |24725 |24796 |24911 |25033 |
|24618 |24735 |24798 |24914 |25041 |
|24652 |24758 |24883 |24928 |25249 |
Accordingly, $24551, 24574$ are to be excluded from the first column. And we get the lower bound i.e. $24600$.
Similarly, $25249, 25041$ are to be excluded from the bottom of the last column. And we get the upper bound i.e. $25033$
Accordingly we can find the mean ($bar{x}$)
$$bar{x} = dfrac{992440}{40} = 24,811$$
$$text{Margin of Error} = dfrac{text{Upper Bound – Lower Bound}}{2}$$
Calculating the margin of error,
$$begin{aligned}
text{Margin of Error}&=dfrac{25033-24600}{2} \\
&=dfrac{433}{2} \\
&=216.5
end{aligned}$$
$$24,811 pm 216.5$$
The range is thus from $24594.5$ to $25027.5$. Since the company has claimed that their machines can copy at least 25000 copies the researchers may be successful in filing their claim.
The difference in proportions is
$$
84% – 72% = 12% = boldsymbol{0.12}
$$
$textbf{b.}$
The difference of zero is not a plausible result, because 0 is not in the confidence interval. A difference of zero means that there is no difference whether the detergent is used, or not.
$textbf{c.}$
Since the proportion of difference is positive, even with margin of error included, we can say that we are confident that there is a difference between washing the dishes with detergent and doing this without it.
$textbf{b.}$ No. Zero means that there is difference whether detergent is used, or not.
$textbf{c.}$ Yes.
$$log(x) = log (5)rightarrow(1)$$
$$begin{aligned}
log(x)&= log(5)\
&boxed{x=5}
end{aligned}$$
$$log(7) = log (x^2)rightarrow(1)$$
$$begin{aligned}
log(7)&= log(x^2)\
&boxed{7=x^2}
end{aligned}$$
Given,
$$
begin{align*}
log(10) &= log(2x-3) tag{1}
end{align*}
$$
We will solve the left-hand side and the right-hand side.
$$
begin{align*}
log(10) &= log(2x-3) \
10 &= 2x-3 \
13 &= 2x \
dfrac{13}{2} &= x \
6.5 &= x \
end{align*}
$$
begin{align*}
log (10) &= log (2 times {6.5} – 3)\
log (10) &= log (13 – 3)\
log (10) &= log (10)\
intertext {Hence, the equations are equivalent.}\
end{align*}
Given,
$$
begin{align*}
log(25) &= log(4x^{2}-5x-50) tag{1}
end{align*}
$$
We will solve the left-hand side and the right-hand side.
begin{align*}
log(25) &= log(4x^{2}-5x-50) \
25 &= 4x^{2}-5x-50 \
4x^{2} – 5x – 50 – 25 &= 0 \
4x^{2} – 5x -75 &= 0 \
intertext {Using the splitting middle term for solving the equation}.\
4x^{2} -20x + 15x – 75 &= 0\
4x (x-5) + 15 (x-5) &= 0 \
(x-5)(4x+15)&=0\
intertext {By solving this, we get the two values of x.}\
end{align*}
begin{align*}
x – 5 &= 0\
fbox {x = 5}\
4x + 15 &= 0\
4x &= -15\
x &= – dfrac{15}{4}\
fbox {x = -3.75}\
end{align*}
$$
begin{align*}
log(25) &= log (4(5)^{2} – 5(5) – 50))\
log(25) &= log (100 – 25 – 50))\
log(25) &= log (100 – 75)\
log(25) &= log (25)\
intertext {Hence, the equations are equivalent.}\\
intertext {Now, Put x = -3.75}\
log(25) &= log (4(-3.75)^{2} – 5(-3.75)-50))\
log(25) &= log (56.25 + 18.75 – 50))\
log(25) &= log (25)\
intertext {Hence, the equations are equivalent.}\
end{align*}
$(b.) x = 5 ; -3.75$
$$begin{aligned}
sqrt{x+18}&= x-2rightarrow(1)\
end{aligned}$$
$$begin{aligned}
x+18&= x^2+4-2x\
0&= x^2-2x-18x+4\
0&= x^2-20x+4rightarrow(2)\
end{aligned}$$
$$begin{aligned}
x&= dfrac{(20)pmsqrt{(20)^2-4(1)(4)}}{2(1)}\\
&=dfrac{20pmsqrt{400-16}}{2}\\
&= dfrac{20pmsqrt{384}}{2}\\
&= dfrac{20pm19.6}{2}\
end{aligned}$$
Thus,
$$begin{aligned}
x&=dfrac{20+19.6}{2}\\
x&= dfrac{39.6}{2}\\
&boxed{x=19.8}\
end{aligned}$$
or,
$$begin{aligned}
x&=dfrac{20-19.6}{2}\\
x&= dfrac{0.4}{2}\\
&boxed{x=0.2}\
end{aligned}$$
$$begin{aligned}
|x+3|&= -2x+9rightarrow(1)\
end{aligned}$$
$$begin{aligned}
pm (x+3)&= -2x+9rightarrow(2)\
end{aligned}$$
$$begin{aligned}
x+2x&= 9-3\
3x&=6\\
x&=dfrac{6}{3}\\
&boxed{x=2}\
end{aligned}$$
Also,
$$begin{aligned}
-x-3&=-2x+9\
-x+2x&= 9+3\
x&= 12\
&boxed{x=12}\
end{aligned}$$
$$begin{aligned}
y + 3&= 2x^2-5xrightarrow(1)\
3x+y&=1rightarrow(2)\
end{aligned}$$
$$begin{aligned}
y& =1 -3xrightarrow(3)\
end{aligned}$$
Put the value of $y$ concluded in equation (3) in equation (1):
$$begin{aligned}
1-3x+3&= 2x^2-5x\
0&= 2x^2-5x+3x-4\
0&= 2x^2-2x-4rightarrow(4)\
end{aligned}$$
$$begin{aligned}
x&= dfrac{(2)pmsqrt{(2)^2-4(2)(-4)}}{2(1)}\\
&=dfrac{2pmsqrt{4+32}}{2}\\
&= dfrac{2pmsqrt{36}}{2}\\
&= dfrac{2pm6}{2}\
end{aligned}$$
Thus,
$$begin{aligned}
x&=dfrac{2+6}{2}\\
x&= dfrac{8}{2}\\
&boxed{x=4}\
end{aligned}$$
or,
$$begin{aligned}
x&=dfrac{2-6}{2}\\
x&= dfrac{-4}{2}\\
&boxed{x=-2}\
end{aligned}$$
Put $y = -2 text{or} 4$ in equation (3):
Case 1:
$$begin{aligned}
y&= 1 – 3(4)\
y&= 1-12\
&boxed{y=-11}\
end{aligned}$$
Also,
$$begin{aligned}
y&= 1 – 3(-2)\
y&= 1+6\
&boxed{y=7}\
end{aligned}$$
$$begin{aligned}
y&= 2x^2 – 8x+ 7rightarrow(1)\
y&= -2x^2+12x-14rightarrow(2)\
end{aligned}$$
$$begin{aligned}
2x^2 – 8x+ 7&= -2x^2+12x-14\
2x^2+2x^2-8x-12x+7+14&=0\
4x^2-20x^2+21&=0rightarrow(3)\
end{aligned}$$
$$begin{aligned}
4x^2-6x-14x+21&=0\
2x(2x-3)-7(2x-3)&=0\
(2x-7)(2x-3)&=0\
end{aligned}$$
$$begin{aligned}
2x-7&=0\
2x&=7\
&boxed{x=dfrac{7}{2}}\\
end{aligned}$$
Also,
$$begin{aligned}
2x-3&=0\
2x&= 3\
&boxed{x=dfrac{3}{2}}\
end{aligned}$$
$$begin{aligned}
y&= 2(3.5)^2- 8(3.5) + 7\
y&= 2(12.25)- 28+7\
y&= 24.5-28+7\
&boxed{y=10.5}
end{aligned}$$
Also,
$$begin{aligned}
y&= 2(1.5)^2- 8(1.5) + 7\
y&= 2(2.25)- 12+7\
y&= 4.5-12+7\
&boxed{y=14.5}
end{aligned}$$
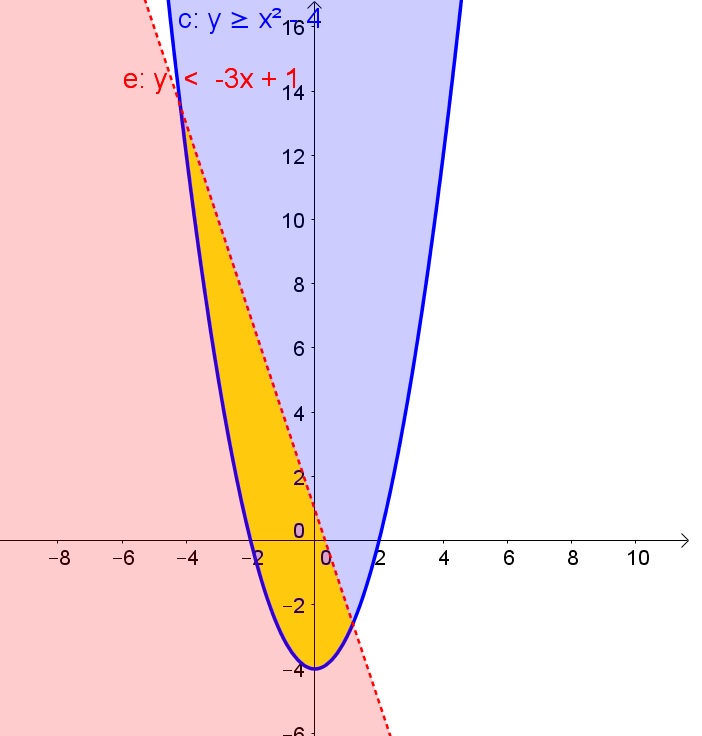
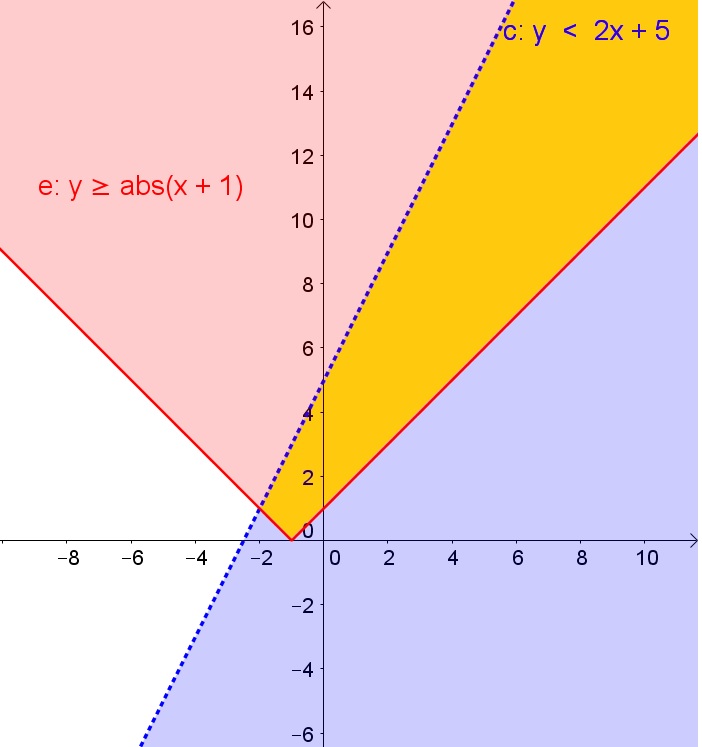
$$begin{aligned}
ygeq |x+2|-3rightarrow(1)\
yleq2rightarrow(2)\
end{aligned}$$

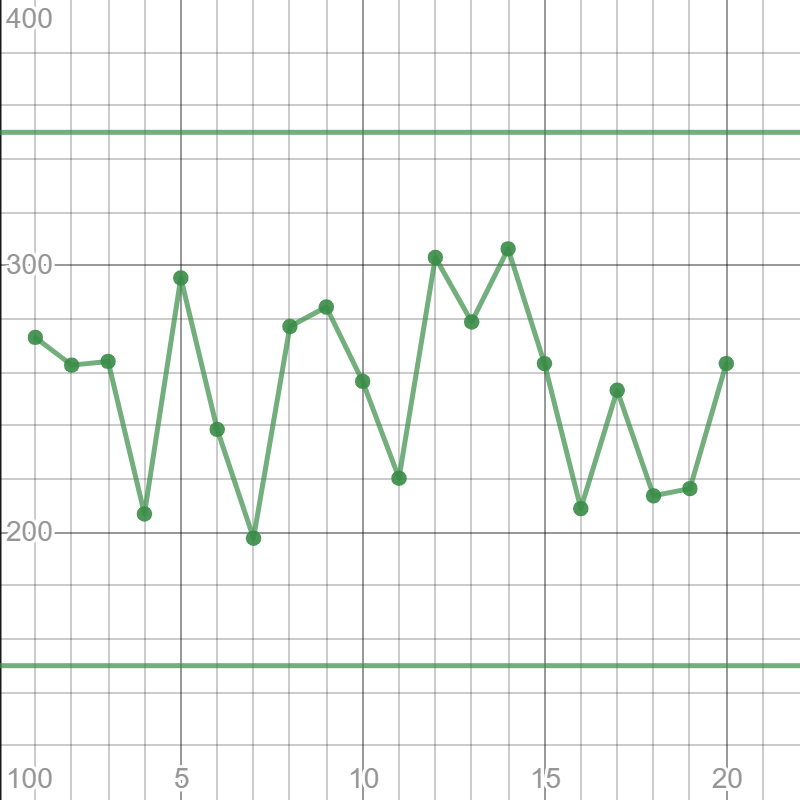
You can use your calculator, but for the purpose of demonstration, we are going to use a graphing calculator on desmos.com.
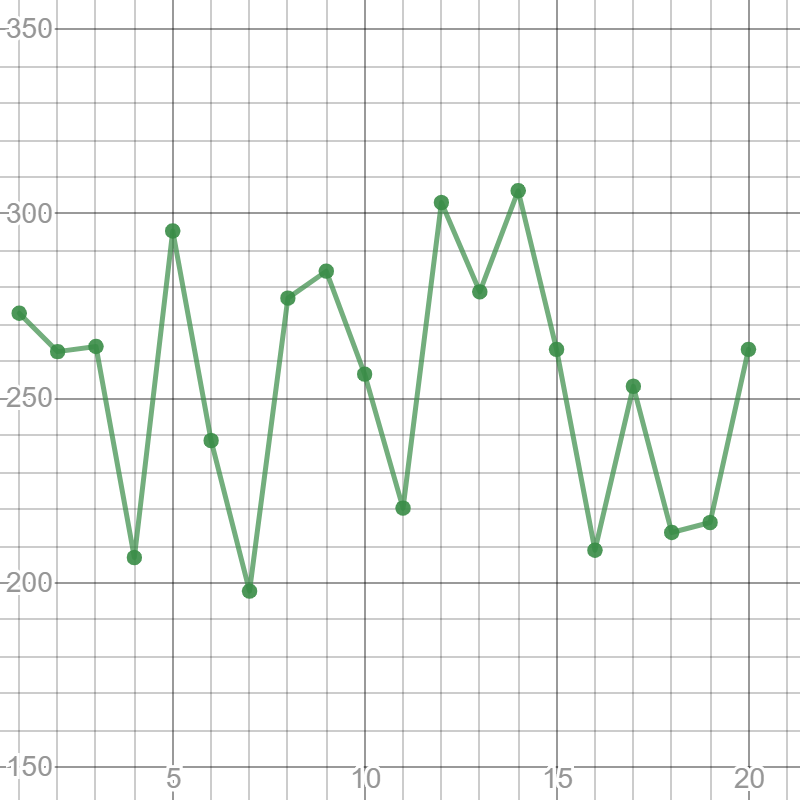
Add the control limits. Equations of the lines are $y=150$ and $y=350$. We will also zoom out a bit for a better view.
You can use your calculator, but for the purpose of demonstration, we are going to use the graphing calculator on desmos.com.
Add the control limits. Equations of the lines are $y=150$ and $y=350$.
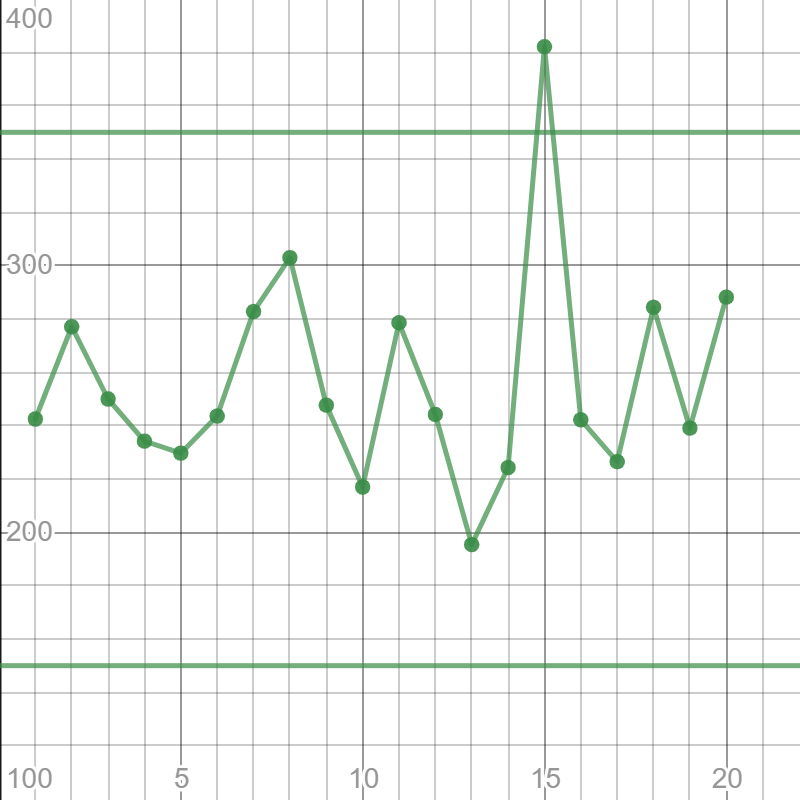
The process went out of control at hour 15. It is possible that the machine malfunction or the human error is responsible for the issue.
$textbf{b.}$ The process went out of control at hour 15. It is possible that the machine malfunction or the human error is responsible for the issue.
You can use your calculator, but for the purpose of demonstration, we are going to use the graphing calculator on desmos.com. Create the scatterplot.
Add the control limits. Equations of the lines are $y=150$ and $y=350$.
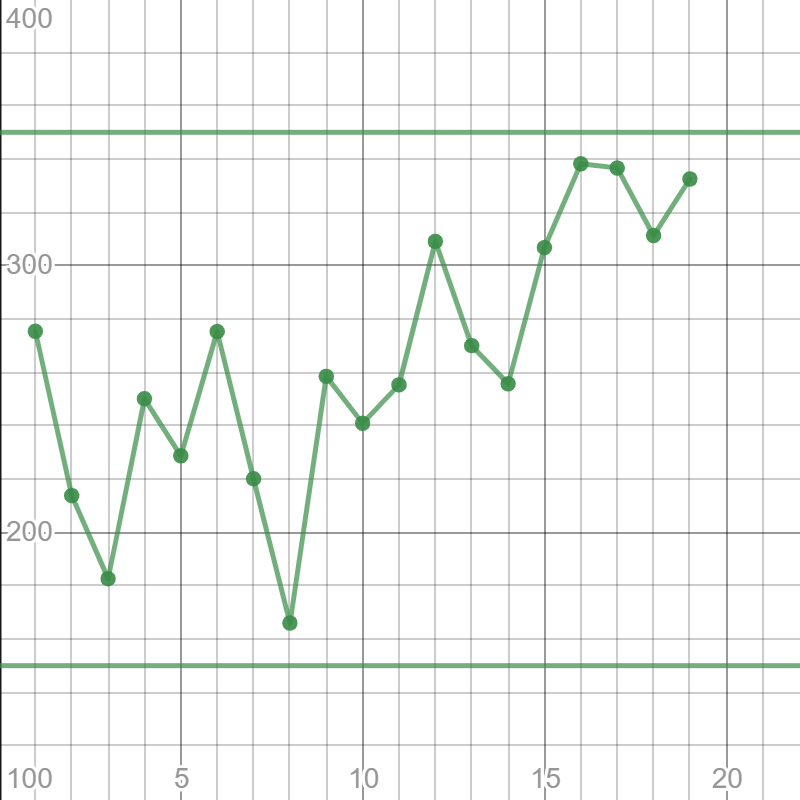
It can be noticed that mean sizes of ice cubes gravitate towards the upper control limit as hours pass. Engineers probably assessed that the process will go out of control at hour 20.
$textbf{c.}$
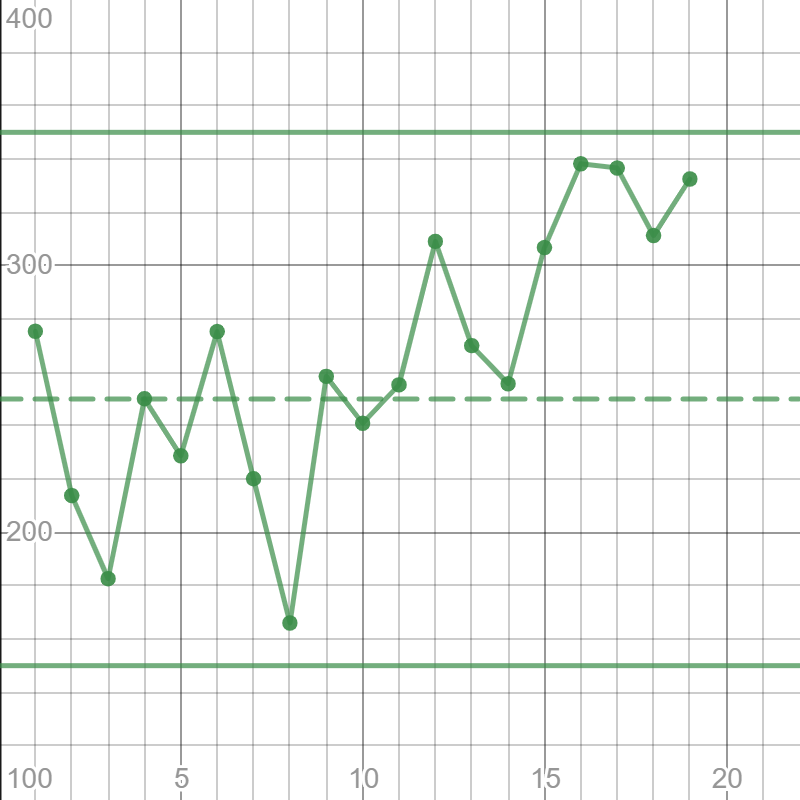
The size in the center of the control limits is the mean value of the limits, so
$$
frac{150+350}{2}=250text{ mm}.
$$
Graph the dotted line $y=250$ representing the centerline.
Since nine points lie above the centerline, the process is out of control.
For nine points loss of control, I believe that machine malfunction might be a better explanation than human error.
$textbf{b.}$ It was probably assessed that the process would go out of control at hour 20.
$textbf{c.}$ The centerline is at 250 mm cube size.
$textbf{d. }$ Graph the line $y=250$ representing the centerline. The process is out of control.
$textbf{e.}$ Machine malfunction is the likely problem.
The process in the other graphs is in control because the graph doesn’t contain many peaks.
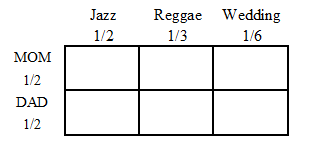
$$
begin{align*}
text{Total number of songs in a playlist} &= 6\
text{Favorable number of her parents wedding song} &= 1\
text{Favorable number of reggae songs} &= 2\
text{Favorable number of jazz songs} &= 3\
end{align*}
$$
intertext {Let $(E_{1})$ be an event that the song is her parent’s wedding song. Thus, the probability of the song is her parent’s wedding song is mathematically stated below.}\
P(E_{1}) &= dfrac{text{Total numbers of outcomes}}{text{Favorable number of outcomes}}\
P (E_{1}) &= dfrac {1}{6} \
end{align*}
intertext {Let $(E_{2})$ be an event of reggae song. Thus, the probability of the reggae songs are mathematically stated below.}\
P (E_{2}) &= dfrac {2}{6}\
P(E_{2}) &= dfrac {1}{3}\
end{align*}
intertext {Let $(E_{3})$ be an event of jazz music. Thus, the probability of jazz music are mathematically stated below.}\
P (E_{3}) &= dfrac {3}{6}\
P(E_{3}) &= dfrac {1}{2}\
end{align*}
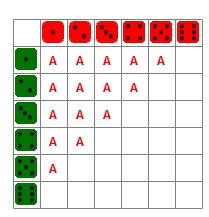
The area model of the given situation is given below.
Let $(E^{-1})$ be an event that the song will not be her parent’s wedding song. The probability of the song that will not be her parent’s wedding song is mathematically expressed as follows.\
As we know, the probability of a parent’s wedding song,i.e, \
begin{align*}
P(E_{1}) &= dfrac {1}{6}\
intertext {Now}\
P(E_{1}) + P(E^{-1}) &= 1\
P(E^{-1}) &= 1 – P(E_{1})\
P (text {not her parent’s song}) &= 1 – dfrac{1}{6}\
&= dfrac {5}{6}\
end{align*}
Let $(E_{4})$ be an event that the phone will show a smiling emoticon. Thus, the probability of the phone will show an emoticon is mathematically expressed as follows.
$$
begin{align*}
P(E_{4}) &= dfrac{1}{2} times(text{Probability of wedding song}) + dfrac{1}{2} times(text {Probability of jazz song})\\
&= dfrac{1}{2}times dfrac{1}{6} + dfrac{1}{2} times dfrac{1}{2}\\
&= dfrac{1}{12} + dfrac {1}{4}\\
&= dfrac {1}{3}\\
P(E_{4}) &= 0.33\\
&= 33.3 text{percent}\
end{align*}
$$
The formula of the conditional probability of an event is;\
begin{align*}
P(B|A) &= dfrac {text{P (A and B)}}{text{P(A)}}\\
intertext {Where, A = dad and B = emoticon}\
&= dfrac{text{P (dad and emoticon)}}{text{P (emoticon)}}\\
&= dfrac {dfrac{1}{2}timesdfrac{1}{2}}{dfrac{1}{3}}\\
&= dfrac {dfrac{1}{4}}{dfrac{1}{3}}\\
&= dfrac {3}{4} = 0.75\\
P(B|A) &= 75 text{percent}\
end{align*}
$(b.)$ $dfrac {5}{6}$
$(c.)$ $35 text{percent}$
$(d.)$ $75 text {percent}$
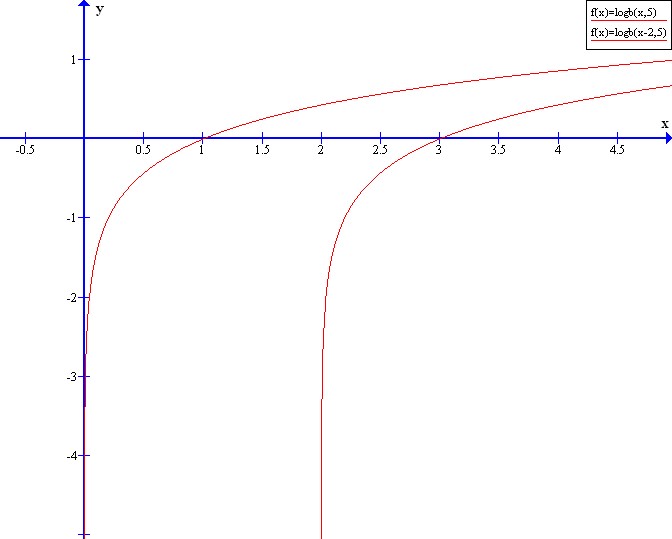
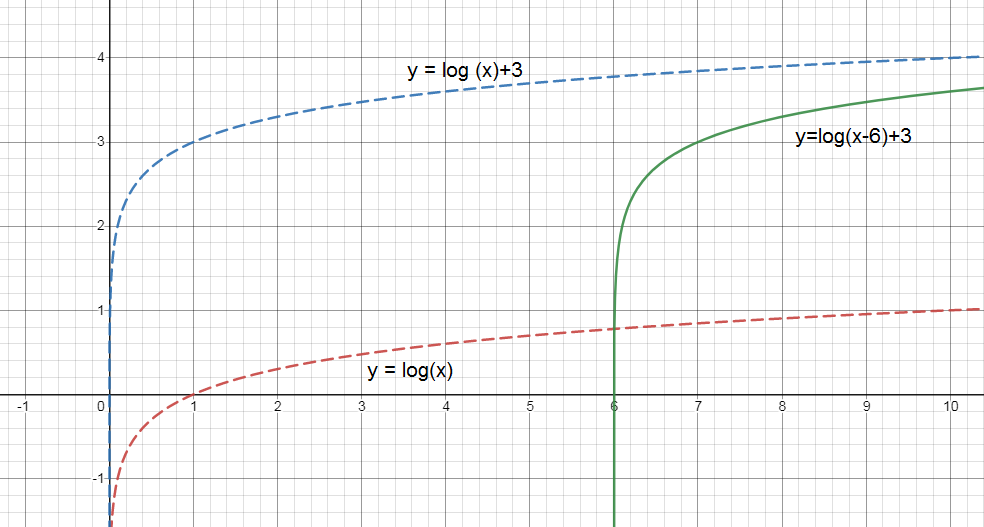
begin{align*}
text {y} &= text {log (x)} tag{1}\
intertext {The logarithum function, $y = log_{b}(x)$, can be shifted $k$ units vertically and $h$ units horizontally with the equation is given below:}\
text {y} &= text {log}_{b} (text{x+h}) + text {k} tag{a} \\
intertext {As comparing the given equation to the logarithum function, we get the value of $b$.}\
text {log}_{b}(text {x}) &= text {log (x)}\
text {b} &= 1\
end{align*}
We know that condition,\
begin{align*}
intertext {If h is greater than 0, alongside the shift up by unit, it means:}\
text {f(x)} &= text {log}_{text {b}} (text {x}) + text {k}\
intertext {As, 3 is greater than 0, then put the value of h in equation}\
&= text {log}_{text {b}} (text {x}) + 3 tag{2}\
end{align*}
We know that condition,\
begin{align*}
intertext {If k is greater than 0, alongside the shift right by unit, it means:}\
text {f(x)} &= text {log}_{text {b}} (text {x} – h) + text {k}\
intertext {As, 6 is greater than 0, then put the value of k in equation}\
&= text {log}(text {x} – 6) + 3 tag{2}\
end{align*}
As per the U.S. Center for Disease Control average height of a woman in the United States is 63.8 inches with a standard deviation of 3.8 inches. Thus, with respect to women of the U.S. it is given
Average height ($bar x$) = 63.8 inches
Standard Deviation ($sigma$) = 3.8 inches
The cockpit is made for people with the height between
5 feet 8 inches or $(5 times 12) + 8 = 68$ inches and
6 feet 3 inches or $(6 times 12) + 3 = 75$ inches.
We have to find the percentage of women who are not within the optimal height range.
In this case we are given the standard deviation and the mean. The sample scores are the optimal range of heights for which the cockpit is designed.
It is pertinent to note,
$$z=dfrac{x-bar{x}}{sigma}$$
$$begin{aligned}
x_a&=68 \
bar{x}& = 63.8 \
sigma &= 3.8\
end{aligned}$$
Calculating the $z$-score,
$$begin{aligned}
z_a&=dfrac{x_a-bar{x}}{sigma} \\
&=dfrac{68-63.8}{3.8} \\
&=dfrac{4.2}{3.8}\\
&=1.10526
end{aligned}$$
Now we will use the normal distribution table,
We get
$x<68 = 0.86548$
This implies,
Percentage of women below the height of 68 inches = $86.548 %$
We can also take help of the graph

$$begin{aligned}
x_b&=75 \
bar{x}& = 63.8 \
sigma &= 3.8\
end{aligned}$$
Calculating the $z$-score,
$$begin{aligned}
z_b&=dfrac{x_b-bar{x}}{sigma} \\
&=dfrac{75-63.8}{3.8} \\
&=dfrac{11.2}{3.8}\\
&=2.9474
end{aligned}$$
Now we will use the normal distribution table,
We get
$x75 = 1-0.9984=0.0016025$
This implies,
Percentage of women above the height of 75 inches = $0.16025 %$
We can also take help of the graph

Percentage of women below the height of 68 inches = $86.5 %$
Percentage of women above the height of 75 inches = $0.16 %$
Percentage of women within the optimal range of height i.e. 68 to 75 inches = $100-86.5-0.16 = 13.34 %$
the percentage of women who are not within the optimal height range = $100-13.34 = 86.66 %$
This is represented by the un-shaded region in the graph below

$$begin{aligned}
text{ Total case that Walter likes the suit}, n(L)&=0.75\
text{Total case of disliking by Walter}, n(L)^{‘}&= 0.25\
text{Favorable cases of liking}&=7\
text{Favorable cases of dis-liking}&=3\
text{Favorable cases of telling truth}&=1\
end{aligned}$$
$$begin{aligned}
P(E_1)&= dfrac{text{Favorable Cases}}{text{Total Cases}}\\
&= dfrac{3}{0.25}\\
&= 12\
end{aligned}$$
$$begin{aligned}
P(E_2)&= dfrac{text{Favorable Cases}}{text{Total Cases}}\\
&= dfrac{7}{0.75}\\
&= 9.3\
end{aligned}$$
Create the area model:
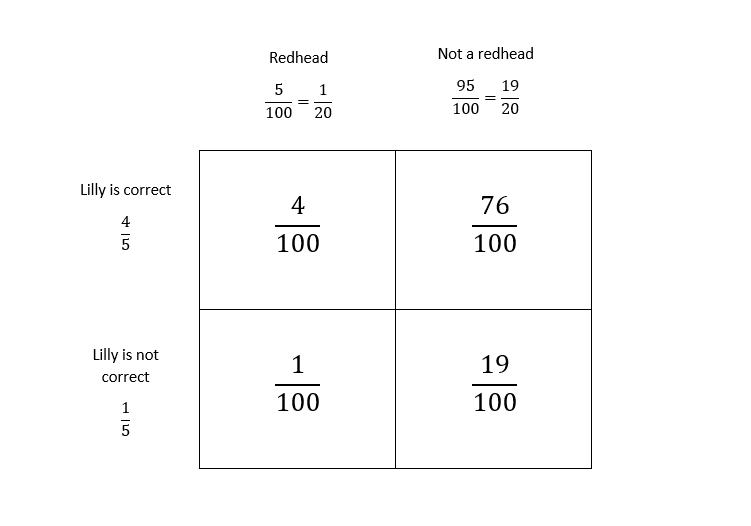
As it can be seen from the area model, she will correctly identify a redhead 4 times out of 100, so we can expect that she will be correct 4 times.
$textbf{c.}$
Lilly will say that the student has red hair if she is correct and the student indeed has red hair, and if she is not correct, and the student does not have red hair. Adding these probability from the area model:
$$
frac{4}{100}+frac{19}{100}=frac{23}{100}.
$$
Out of 100 students, we can expect that Lilly will proclaim 23 of them as redheads.
$textbf{d.}$
We established in $textbf{c.}$ that she will proclaim 23 out of 100 students as redheads, but she is correct in identifying redheads 4 times out of 100. So, the required percentage is
$$
frac{frac{4}{100}}{frac{23}{100}}=frac{4}{23}approx 17%.
$$
$textbf{e.}$
As established in $textbf{d.}$, when she is identifying redheads, she is correct only in $17%$ of the cases, not a great percentage, so it is unlikely that out of Measley’s is a thief.
$textbf{f.}$
This is not a proof. It is merely a probability question, so it is still possible that one of them is a thief, although unlikely.
$textbf{b.}$ 4
$textbf{c.}$ 23
$textbf{d.}$ $17%$
$textbf{e.}$ It is unlikely that Measley is a thief.
$textbf{f.}$ This is not a proof, so a possibility that Measley is a thief still exists.
Create the area model:

Out of 100,000 people, 100 are actually sick. Out of 100,000 people who are not sick, but are going to be told so is 999. So, to compare the numbers:
$$
frac{999}{100}approx 10.
$$
The amount of people who are going to be told they are sick and are not is 10 times greater than the number of people who are actually sick.
$textbf{c.}$
The probability of test coming back positive is if the test is correct, and the person is positive, and if the test is not correct and the person is negative. That probability is $frac{99}{100,000}+frac{999}{100,000}=frac{1,098}{100,000}$.
The conditional probability is
$$
frac{frac{999}{100,000}}{frac{1,098}{100,00}}=frac{999}{1,098}approx 91%.
$$
The probability of being false positive is approximately $boldsymbol{91%}$.
$textbf{d.}$
Since the disease is very rare, being proclaimed as HIV positive does not necessarily be the truth. Consecutive testing is recommended. When people volunteer for testing, the percentage of false positives will decrease because much smaller percentage of HIV negative people will submit to the test.
$textbf{e.}$
The test is always $99%$ correct, whether or not the person is HIV positive, so the results are independent.
$textbf{b.}$ There will be approximately 10 times more people that are going to be told they are sick and are actually not than a number of people who are sick.
$textbf{c.}$ $91%$
$textbf{d.}$ Percentage of false positives would reduce.
$textbf{e.}$ Yes.
b. Sample is biased because most people to work are not at home during daytime.
c. The weekly sugar, the number of times they brush their teeth a week, etc.
The question was biased because there is already a misleading introduction that has a negative effect on the survey itself.
#### b.
The sample is considered bias because the respondents were households during the daytime, wherein those who are in work cannot participate in the survey. With this, the results would not be accurate as there could be workers who also loves to bake.
#### c.
There are other factors to consider that the number of cavities might decrease or increase not mainly with the habit of eating apples. The results could vary. There is a possibility that even with a patient who eats an apple a day would still have more cavities than those who eat apple seldom.
$$a=b^x Leftrightarrow x=log_ba$$
Where $a,bin R^+$ and $bneq 1$
$$a=log_b(24)Rightarrow b^a=24$$
$$3x=log_{2y}(7)Rightarrow (2y)^{3x}=7$$
$$3y=7^{5x}Rightarrow 5x=log_{2}(3y)$$
$$4p=(2q)^{6}Rightarrow 6=log_{2q}(4p)$$
$$f(x)=frac{2}{7-x},~~~x in D.$$
$(a)~~$ Now notice that denominator of the given function $~~f~~$ is $~~7-x.$
Now if we put $~~7~~$ in the function $~~f(x)~~$the denominator become $~~0~~$ and the function $~~f~$ becomes $~~dfrac{2}0,~~$ which is basically undefined on real line.
So the value of $~~f(7)~~$ cannot be determined.
Now notice that
$$f(x)=frac{g(x)}{h(x)},~~~text{ where }~h(x)=7-x,~g(x)=2.$$
Now note that $~~g(x)~~$ is defined on the real line, since $~~g~~$ is a constant function. Also, $~~h(x)~~$ is defined on the real line and $~~h(7)=0.$
Since $~~h(x)~~$ is the denominator of the given function $~~f(x)~~$ and $~~7~~$ is the only zero of $~~f,~~$ $~f~$ cannot be defined on $~~x=7.$
Therefore, the domain $~~D~~$ of the function $~~f~~$ is given by
$$D=mathbb R -{7}.$$
Let $~~y~~$ be an element of $~~mathbb R~~$ such that $~~y=f(x).$
Then we have
$$
begin{aligned}
y=f(x) implies & y=frac{2}{7-x}\
implies & y(7-x)=2\
implies & 7y-yx=2\
implies & 7y = yx+2\
implies & 7y-2=xy\
implies & x=frac{7y-2}{y}.
end{aligned}
$$
Now notice that denominator of $~~x~~$ is $~~1+y.$
So, the value of $~~x~~$ can be determined if and only if $~~y neq 0.$
Hence, $~~y in mathbb R~~$ belongs to the range of $~~f,~~$ then $~~y neq 0.$
Hence, the range $~~S~~$ of $~~f~~$ is given by
$$S=mathbb R -{0}.$$
This completes the solution.
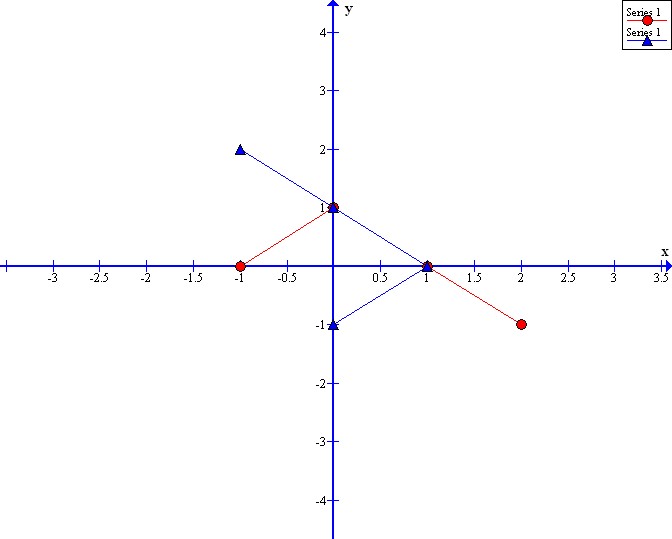
$$f(x)=-x+6.$$
Let $~~f^{-1}~~$ be the inverse of the function $~~f.~~$ Then we have
$$left(fcirc f^{-1}right)(x)=left(f^{-1}circ fright)(x)=x.$$
$$
begin{aligned}
y=-x+6 implies & y+x=(-x+6)+x\
implies & y+x=(-x+x)+6\
implies & y+x=0+6\
implies & (y+x)-y=6-y\
implies & (y-y)+x=6-y\
implies & x=6-y.
end{aligned}
$$
Now we claim that $~~f^{-1}(x)=6-x.$
$$
begin{aligned}
left(fcirc f^{-1}right)(x) &=fleft(f^{-1}(x)right)\
&=f(6-x)\
&=-(6-x)+6\
&=-6+x+6\
&=(-6+6)+x\
&=0+x\
&=x,\ \
left(f^{-1}circ fright)(x) &=f^{-1}left(f(x)right)\
&=f^{-1}(-x+6)\
&=6-(-x+6)\
&=6+x-6\
&=(6-6)+x\
&=0+x\
&=x.
end{aligned}
$$
$$left(fcirc f^{-1}right)(x)=left(f^{-1}circ fright)(x)=x.$$
Hence, inverse of $f~~$ is defined by
$$f^{-1}(x)=6-x.$$
This completes the solution.
$2 sqrt {21-x}=5+sqrt {3x-6}$
$4(21-x)=25+10sqrt {3x-6}+(3x-6)$ (Square each side)
$84-4x-25-3x+6=10 sqrt {3x-6}$ (Grouping similar terms)
$-7x+65=10 sqrt {3x-6}$
$(-7x+65)^2=100(3x-6)$ (Square each side)
$49x^2-910x+4225=300x-600$
$49x^2-910x-300x+4225+600=0$ (Grouping similar terms)
$49x^2-1210x+4825=0$
Solving the equation using quadratic formula:
$x_{1, 2}=dfrac {-b pm sqrt {b^2-4ac}}{2a}$
$x_{1, 2}=dfrac {1210 pm sqrt {1,464,100-945,700}}{98}$
$x_{1, 2}=dfrac {1210 pm sqrt {518,400}}{98}$
$x_{1}=dfrac {1210-720}{98}$ $x_{2}=dfrac {1210+720}{98}$
$x_{1}=dfrac {1210-720}{98}$ $x_{2}=dfrac {1210+720}{98}$
$x_{1}=5$ $x_{2}=dfrac {965}{49}$
For $x=5$
$2 sqrt {21-x}-sqrt {3x-6}$
$=2 sqrt {21-5}-sqrt {3(5)-6}$
$=2 sqrt {16}-sqrt {9}$
$=8-3=5$ checkmark
$x=5$ is a real solution.
For $x=dfrac {965}{49}$
$2 sqrt {21-dfrac {965}{49}}-sqrt {3 left(dfrac {965}{49} right)-6}$
$=2 sqrt {dfrac {1029}{49}-dfrac {965}{49}}-sqrt {left(dfrac {2895}{49} right)-left(dfrac {294}{49} right)}$
$=2 sqrt {dfrac {64}{49}}-sqrt {dfrac {2601}{49}}$
$=2 times dfrac {8}{7}-dfrac {51}{7}$
$=dfrac {16}{7}-dfrac {51}{7}$
$=-dfrac {35}{7}=-5$
$x=dfrac {965}{49}$ is an extraneous solution.
* $bullet$ Base of each consecutive triangle is increased by 1
* $bullet$ Perpendicular of each consecutive triangle is increased by $sqrt3$
* $bullet$ Hypotenuse of each consecutive triangle is increased by 2
Hence, below are next two triangles:
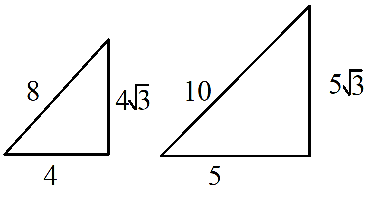
* $bullet$ Perpendicular of each triangle is $sqrt3 times textrm{base}$.
Hence, perpendicular is $xsqrt3$
* $bullet$ Hypotenuse of each triangle is $2 times textrm{base}$.
Hence, perpendicular is $2x$
The difference in proportions is
$$
25% – 15% = 10% = boldsymbol{0.1}.
$$
$textbf{b.}$
$textit{i.}$
She managed to hit $25%$ of 40 putts with her new club which is $textbf{10 putts}$. She also hit $15%$ of 40 putts with her new club which is $textbf{6 putts}$. In total, 16 putts went into the hole.
$textit{ii.}$
Numbers 1 to 16 will represent punts that went into the hole, and other numbers represent punts that did not go into the hole.
Let’s use MS Excel software to run the simulation. Putts which went into the hole are colored $color{#4257b2}text{blue}$ and those which did not go into the hole are colored $color{#c34632}text{red}$.
The difference of zero means that there is no difference which club is used. Zero is a plausible result since it is in the interval of confidence.
$textbf{d.}$
Since the difference could be negative, we can say that there might not be a true difference between the clubs.
$textbf{b.}$
$textit{i.}$ 16
$textit{ii.}$ Numbers 1-16 represent hits, while numbers 17-80 represent misses.
$textit{iii.}$ Run the simulation. We got the difference of proportions of $-0.7$.
$textbf{c.}$ Zero means that there is no significant difference between clubs used.
$textbf{d.}$ It’s possible that there is no difference between clubs.
Create the area model:
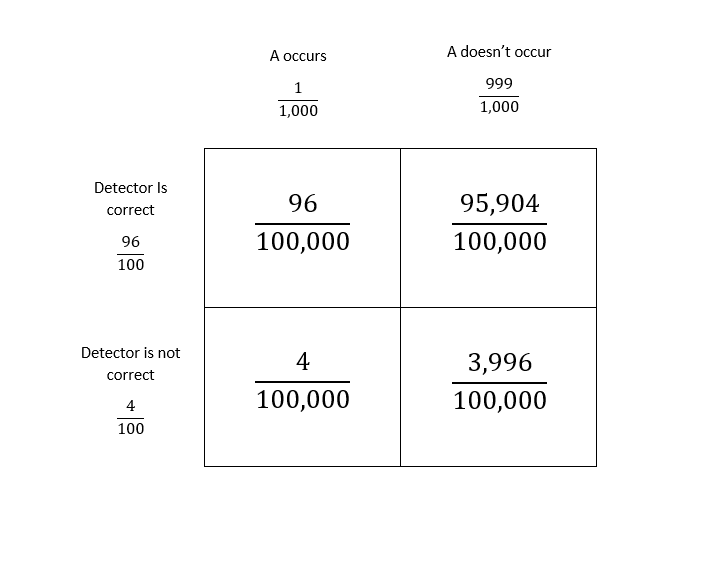
Probability that the alarm is activated is
$$
frac{96}{100,000}+frac{3,996}{100,000}=frac{4,092}{100,000}.
$$
Probability that the alarm is activated, but the event A did not occur is $frac{3,996}{100,000}$.
The required conditional probability is
$$
frac{frac{3,996}{100,000}}{frac{4,092}{100,000}}=frac{3,996}{4,092}approx boldsymbol{97.6%}.
$$
$textbf{c.}$
The accuracy of a detector is the same whether the even occurred or not. Hence, the results are independent.
$textbf{b.}$ $97.6%$
$textbf{c.}$ Yes.
$$begin{aligned}
y &= log_{b} (x)\
end{aligned}$$
As we can see, the graph is decreasing which means, the base is;
0 < b < 1.
$$begin{aligned}
-2 < log_{b}(2) < -1\\
log_{b}(b^{-2}) < log_{b}(2) 2 > dfrac{1}{b}\\
1 > 2b^{2} > b\\
b^{2} 0\\
b 0\\
dfrac{1}{2} < b < dfrac{1}{sqrt{2}}\\
0.5 < b < 0.7\\
end{aligned}$$
5x-1=6+4x
$$
x=7
$$
$$begin{aligned}
f(x) &= 2 sqrt{dfrac{x-3}{4}} + 1\
end{aligned}$$
$$begin{aligned}
y &= 2 sqrt{dfrac{x-3}{4}} + 1\
end{aligned}$$
Next, replace all x’s with y and all y’s with x.
$$begin{aligned}
x &= 2 sqrt{dfrac{y-3}{4}} + 1 \
end{aligned}$$
$$begin{aligned}
x -1 &= 2 sqrt{dfrac{y-3}{4}}\
dfrac{x-1}{2} &= dfrac{sqrt{y-3}}{4}\
end{aligned}$$
$$begin{aligned}
(dfrac{x-1}{2})^{2} &= (dfrac{y-3}{4})^{2}\
dfrac{(x-1)^{2}}{4} &= dfrac{y-3}{4}\
y – 3 &= (x-1)^{2}\
y &= (x-1)^{2}\
end{aligned}$$
Finally replace $y$ with $f^{-1}(x)$.
$$begin{aligned}
f^{-1} = (x-1)^{2} + 3\
end{aligned}$$
Domain of $f(x)$ is (3, infty),
while the domain of $f^{-1}$ is (1, infty).

Q(t)=Q_{o}r^{t}=110000(1.025)^{t}
$$
Q(10)=110000(1.025)^{10}=$140810
$$
Q(t)=200000=110000(1.025)^{t}
$$
log_{1.025}left( dfrac{200000}{110000}right)=t
$$
1.025^{t}=dfrac{200000}{110000}
$$
log(1.025^{t})=logleft(dfrac{200000}{110000} right)
$$
Q(t)=Q_{o}r^{t}=182500(0.95)^{t}
$$
Q(2)=182500(0.95)^{2}=$164706
$$
