
All Solutions
Page 535: Questions
Draw a Venn diagram with two overlapping circles. There are 4 regions: students who have the new $pi$Phone, students who have laptop computer, students who have both, and students who have neither.
From the given, 110 students had neither the new $pi$Phone nor the laptop computer. So, $175-110=65$ students have either a $pi$Phone, a laptop, or both. The completed Venn diagram is shown below with explanation in parts b to d.
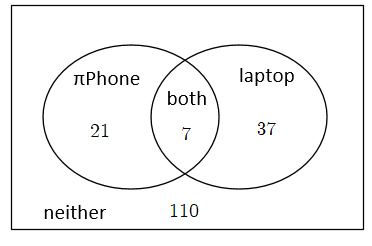
Let $x$ be the number of students who have both $pi$Phone and laptop so that $28-x$ is the number of students who have $pi$Phone only and $44-x$ is the number of students who have laptop only. The sum of these 3 is 65 (from part a) so we write:
$$
x+(28-x)+(44-x)=65
$$
Solve for $x$:
$$
begin{align*}
-x+72&=65\
-x&=-7\
x&=7
end{align*}
$$
So, 7 students have both $pi$Phones and laptops.
$textbf{c.}$
65. From part (a), we subtracted 110 from 175.
$textbf{d.}$
Because there are students who own both $pi$Phones and laptops.
b. 7 students ; Let $x$ be the number of students who have both $pi$Phone and laptop so that $28-x$ is the number of students who have $pi$Phone only and $44-x$ is the number of students who have laptop only. The sum of these 3 is 65.
c. 65
d. Because there are students who own both $pi$Phones and laptops.
The following table is completed Raul’s table with the number of students in all cells.\
begin{center}
begin{tabular}{ |c|c| c| c| c| c |c| }
hline
$$ & $text{laptop}$ & $text{no laptop}$ \
hline
$pitext{Phone}$ & $7$ & $21$ \
hline
$text{no }pitext{Phone}$ & $37$ & $110$ \
hline
end{tabular}
end{center}
It is called a two-way table because it is used for examining relationships between categorical variables.
#### (c)
This type of table provides a basic picture of the interrelation between two variables and can help find interactions between them, that is an advantage.
#### (d)
$i)$ The probability that a student at his high school has a $pi$Phone or a laptop is the following:
$$
dfrac{7+21+37}{175}=dfrac{65}{175}=dfrac{13}{35}
$$
$ii)$ The probability that a student has a $pi$Phone and a laptop is the following:
$$
dfrac{7}{175}
$$
$$
dfrac{7}{44}=0.2
$$
And the probability that a non-laptop-owner owning a $pi$Phone is the following.
$$
dfrac{21}{131}=0.16
$$
We can notice that those probabilities are close to each other, so, there is no association between owning a laptop and $pi$Phone.
textbf{a.}
$$
$$
color{white}tag{1}
$$
Fill in the table as shown:
$$
begin{align*}
text{A/Boy}&=24\
text{A/Girl}&=7\
text{not A/Boy}&=116-24=92\
text{not A/Girl}&=29-7=22
end{align*}
$$
So, the completed two-way table will be:
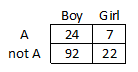
Although it looks like boys are likely to receive an A, the number of boys vs. girls in the class are not the same so we cannot conclude this.
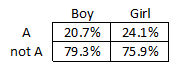
By finding the percentage of those who received A, we have:
$$
text{boys: }dfrac{24}{116}approx 20.7%text{ and }text{girls: }dfrac{7}{29}approx 24.1%
$$
By comparing, there is an association between gender and the grade received. Girls are more likely to receive an A.
$$
textbf{c.}
$$
$$
color{white}tag{1}
$$
Fill in the table as shown:
$$
begin{align*}
text{A/Boy}&=20.7%\
text{A/Girl}&=24.1%\
text{not A/Boy}&=100%-20.7%=79.3%\
text{not A/Girl}&=100%-24.1%=75.9%
end{align*}
$$
So, the completed relative frequency table will be:
b. Yes ; girls
c. A/Boy: 20.7%, A/Girl: 24.1%, not A/Boy: 79.3%, not A/Girl: 75.9%
We can see this from the following table, where there are calculated percents for columns.\
begin{center}
begin{tabular}{ |c|c| c| c| c| c |c| }
hline
$$ & $text{has DapT}$ & $text{ no DapT}$ \
hline
$text{Type O}$ & $44%$ & $44%$ \
hline
$text{Type A}$ & $41%$ & $42%$ \
hline
$text{Type B}$ & $10%$ & $10%$ \
hline
$text{Type} AB$ & $4%$ & $4%$ \
hline
end{tabular}
end{center}
The probability of living alone is the following:
$$
dfrac{1.45+4.06+3.55+5.57+6.69+4.81+6.5}{312.59}=0.105
$$
#### (b)
The probability of being $65$ or over is the following:
$$
dfrac{4.81+6.5+16.59+11.26}{312.59}=0.125
$$
#### (c)
The probability of being under $65$ is the following:
$$
1-0.125=0.875
$$
Here, we subtracted probability of being $65$ or over from $1$.
#### (d)
The probability of being under $35$ and living alone is the following:
$$
dfrac{1.45+4.16}{312.59}=0.018
$$
#### (e)
Qui made a mistake in that he counted twice $1.45$ million and $4.16$ million people in the top row.
begin{center}
begin{tabular}{ |c|c| c| c| c| c |c |c |c |c| }
hline
$$ & $text{under }25$ & $25text{ to }34$ & $35text{ to }44$ & $45 text{ to }54$ & $55text{ to }64$ & $65text{ to }74$ & $text{ over }75$\
hline
$text{living alone}$ & $1%$ & $10%$ & $9%$ & $13%$ & $18%$ & $22%$ & $37%$ \
hline
$text{living with oders}$ & $99%$ & $90%$ & $91%$ & $87%$ & $82%$ & $78%$ & $63%$ \
hline
end{tabular}
end{center}
A two-way table which represents the given situation is the following:\
begin{center}
begin{tabular}{ |c|c| c| c| c| c |c| }
hline
$$ & $text{Exercise}$ & $text{Does not exercise}$ \
hline
$text{Eats fruits and veggies}$ & $0.25$ & $0.08$ \
hline
$text{Does not eat fruits and veggies}$ & $0.1$ & $0.57$ \
hline
end{tabular}
end{center}
The required probability will be the following:\
$$0.25$$\
subsection*{(c)}
The required probability will be the following:\
$$0.43$$\
subsection*{(d)}
Here is a relative frequency table:\
begin{center}
begin{tabular}{ |c|c| c| c| c| c |c| }
hline
$$ & $text{Exercise}$ & $text{Does not exercise}$ \
hline
$text{Eats fruits and veggies}$ & $71%$ & $12%$ \
hline
$text{Does not eat fruits and veggies}$ & $29%$ & $88%$ \
hline
end{tabular}
end{center}
We can conclude that there is an association between eating fruits and vegetables and exercise.\
Here is a relative frequency table:\
begin{center}
begin{tabular}{ |c|c| c| c| c| c |c| }
hline
$$ & $text{early curfew}$ & $text{late curfew}$ \
hline
$text{does chores}$ & $50%$ & $0%$ \
hline
$text{does not do chores}$ & $50%$ & $100%$ \
hline
end{tabular}
end{center}
subsection*{(b)}
We can conclude that there is an association between chores and curfew because students who had an early curfew did chores $50%$ of the time, while none of the students who had a late curfew did chores.\
subsection*{(c)}
Here is new realtive frequency table:\
begin{center}
begin{tabular}{ |c|c| c| c| c| c |c| }
hline
$$ & $text{does chores}$ & $text{does not do chores}$ \
hline
$text{early curfew}$ & $100%$ & $50%$ \
hline
$text{late curfew}$ & $0%$ & $50%$ \
hline
end{tabular}
end{center}
We can conclude that there is still an association.\
Here is a new relative frequency table:\
begin{center}
begin{tabular}{ |c|c| c| c| c| c |c| }
hline
$$ & $text{early curfew}$ & $text{late curfew}$ \
hline
$text{does chores}$ & $33%$ & $33%$ \
hline
$text{does not do chores}$ & $67%$ & $67%$ \
hline
end{tabular}
end{center}
The conclusion is that there is no association.\
subsection*{(e)}
It is interesting that there are similar values of a relative frequency in rows.\
begin{tabular}{|c|c|c|c|}
hline
& Sunday Paper & Weekly Paper & Both papers \ hline
Percentage of subscribed population & 65 & 37 & 25 \ hline
Percentage of unsubscribed population & 35 & 63 & 75 \ hline
end{tabular}\\
$$
begin{align*}
P&=65%+37%-25%\
&=102%-25%\
&=77%\
&=textcolor{#4257b2}{0.77}
end{align*}
$$
$textbf{(c)}$ Probability($P$) that neighbour is subscribed to sunday paper is:
$$
begin{align*}
P&=dfrac{textrm{Percentage of population subscribed to Sunday paper}}{textrm{Percentage of population subscribed to any paper}}\
&=dfrac{65}{77}\
&approx textcolor{#4257b2}{0.8441}
end{align*}
$$
$$
x-0.05xleq xleq x+0.05x
$$
$$
0.95xleq xleq 1.05x
$$
Here, we get two possible ranges:
$$
196.190leq xleq216.842
$$
196.190leq xleq216.842
$$
$$
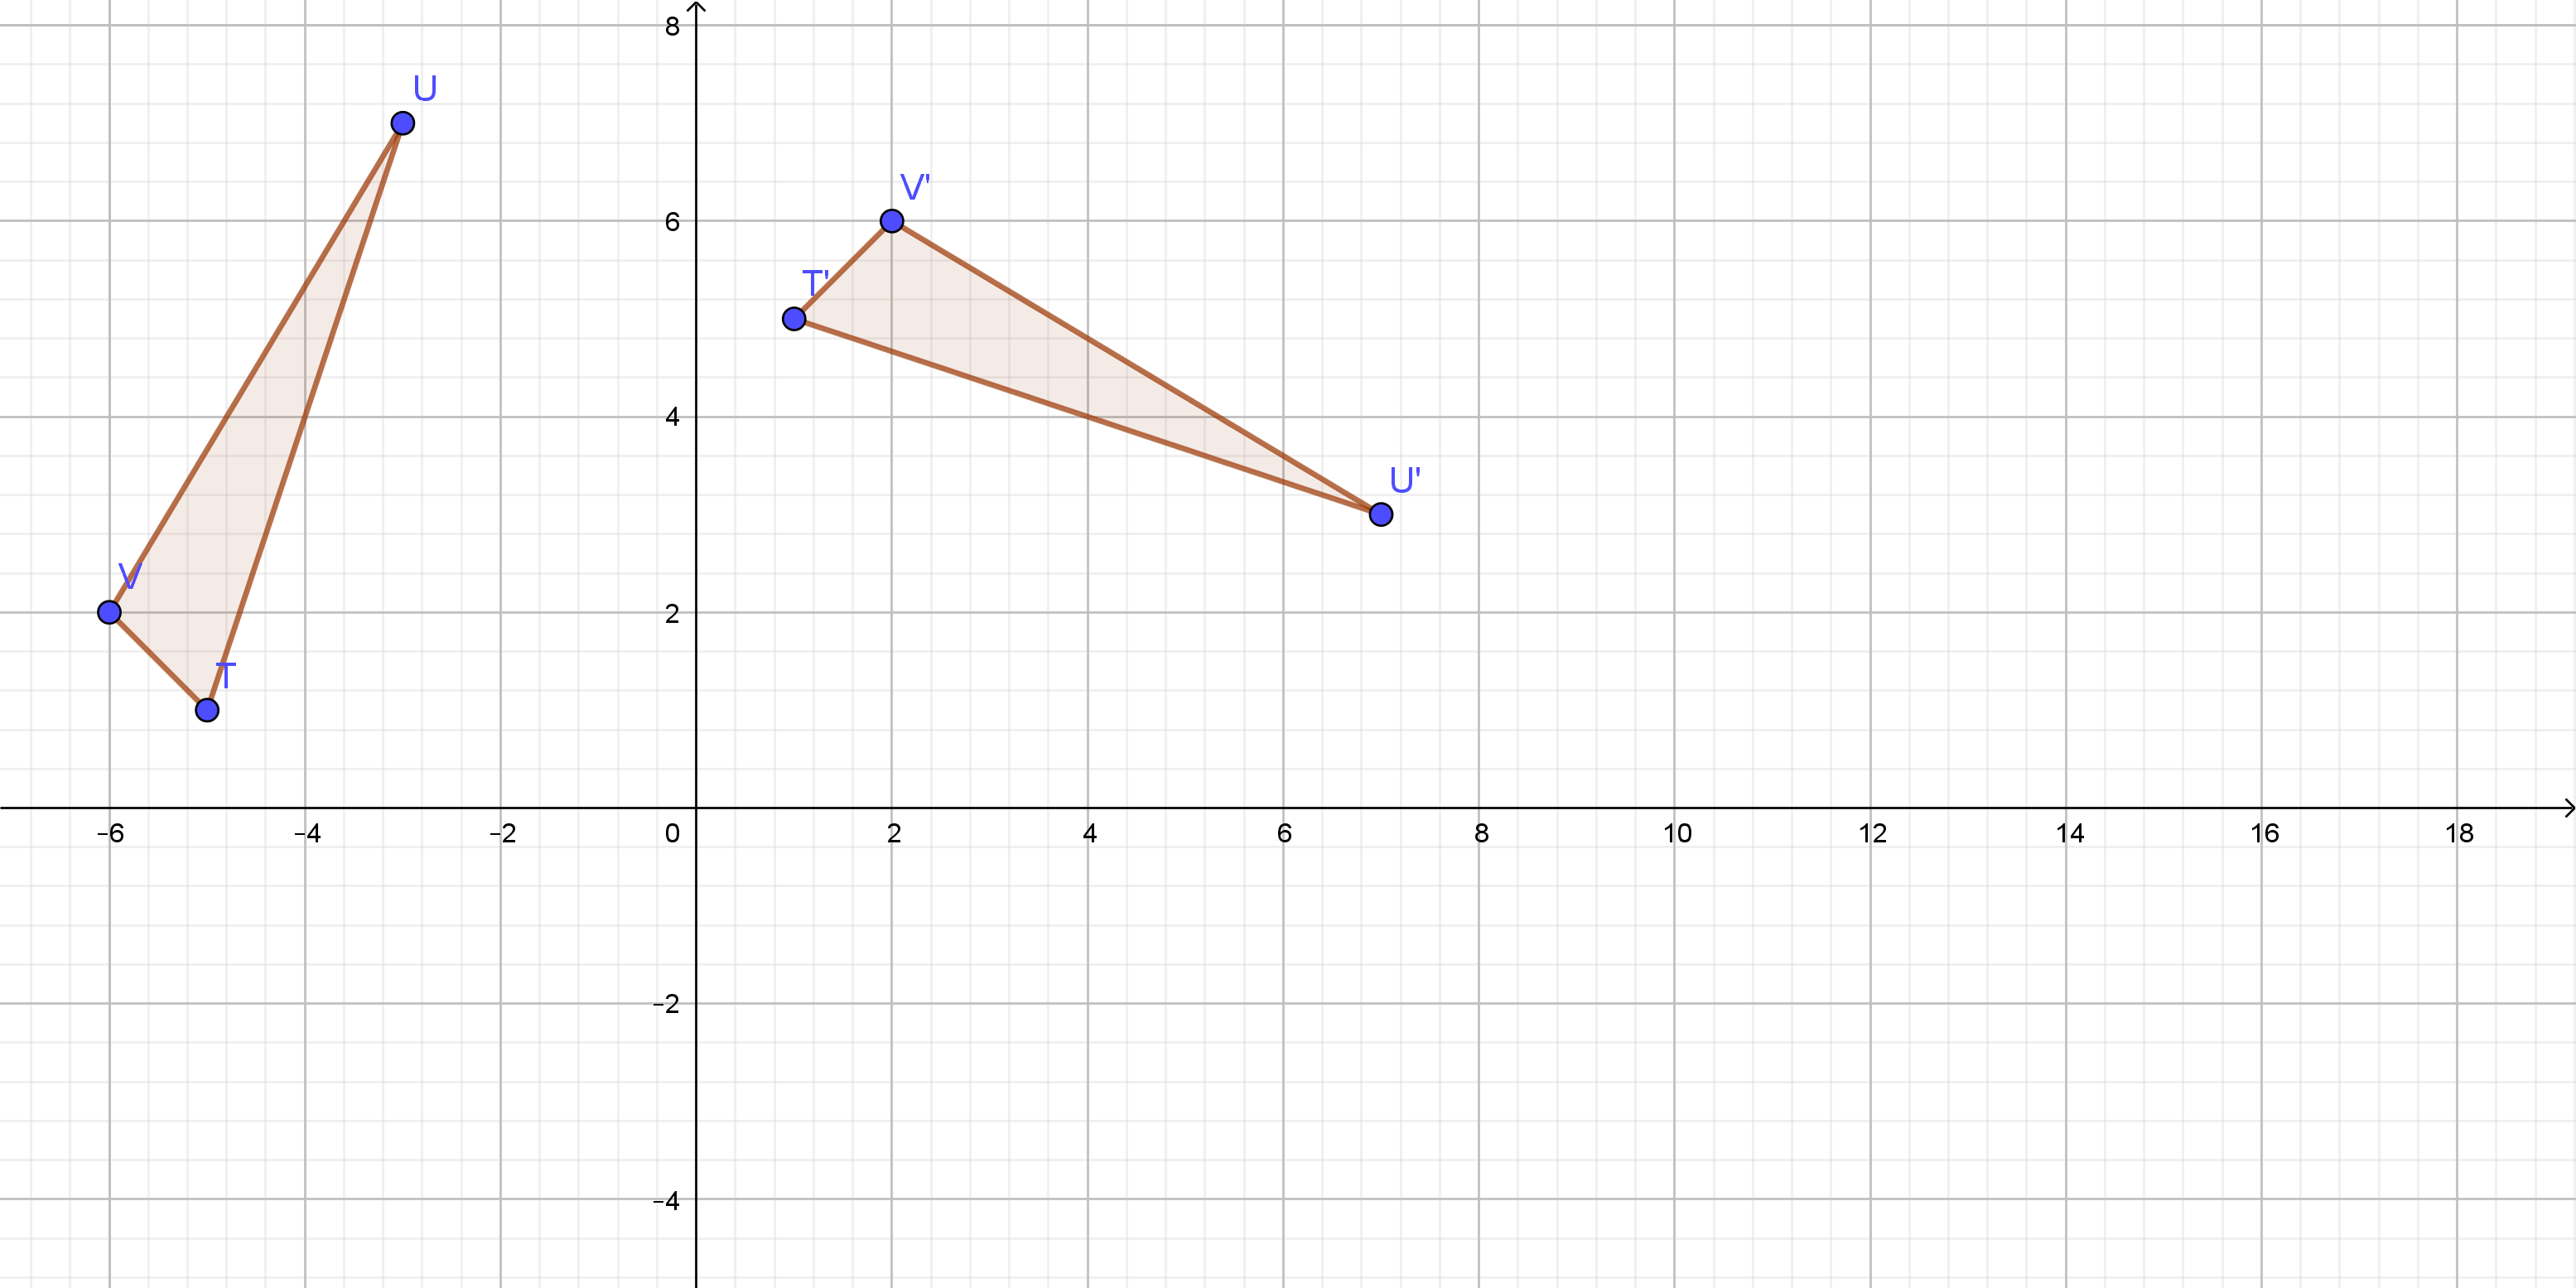
T(-5,1), U(-3,7), V(-6,2)
$$
T(-5,1), U(-3,7), V(-6,2)
$$
$$
color{#4257b2}text{(a)} I=dfrac{3}{4} md+18 text{ Solve for} d
$$
Isolate the variables on left side as follows:
$$
dfrac{3}{4} md=I-18 md=(I-18)cdotdfrac{4}{3} md=dfrac{4-4cdot18}{3}
$$
$$
d=left(dfrac{4 I-72}{3}right)cdot m
$$
$$
color{#4257b2}text{(b)} S=25P+q text{ Solve for} q
$$
Isolate the variables on the left side as follows:
$$
q=S-25 P
$$
$$
color{#4257b2}text{(c)} PV=nRT text{ Solve for} n
$$
Isolate the variables on the left side as follows:
$$
n=dfrac{PV}{RT}
$$
(c) $n=dfrac{PV}{RT}$
Here is required a two-way table.\
begin{center}
begin{tabular}{ |c|c| c| c| c| c |c| }
hline
$$ & $text{purchase washer}$ & $text{did not purchase washer}$ \
hline
$text{purchase dryer}$ & $44$ & $20$ \
hline
$text{did not purchase dryer}$ & $44$ & $69$ \
hline
end{tabular}
end{center}
The probability that the next customer who comes to his department will purchase a washer or dryer is the following:\
$$dfrac{44+44+20}{177}=0.61$$\
subsection*{(b)}
The probability that if a customer bought a washer, he or she also bought a dryer is the following:\
$$dfrac{44}{88}=0.5$$\
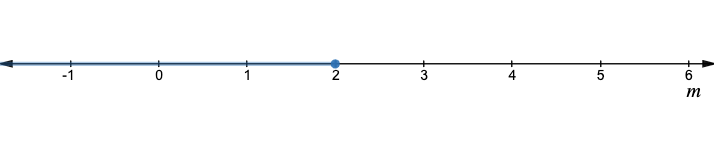
The absolute value of the difference of the mileage and $31$ mph (since this can be a negative difference) is “at most” or “less than or equal to” 5 mph so we write:
$$
color{#c34632}|m-31|leq 5
$$
Replace the inequality symbol with $=$ so we have the equation:
$$
| m-31|=5
$$
Since the right side is positive, then there are two solutions. We write and solve the two equations:
$$
begin{align*}
m-31&=-5 & m-31&=5\
m&=26 & m&=36
end{align*}
$$
Hence, the number line will be divided into 3 regions:
$$
mleq 26, 26leq mleq 36,text{ and }mgeq 36
$$
For each region, assign a test point. If the test point satisfies the inequality, the region it belongs to is a solution.
For $mleq 26$, I used $m=0$:
$$
begin{align*}
| 0-31|&stackrel{?}{leq}5\
31¬{leq} 5
end{align*}
$$
For $26leq mleq 36$, I used $m=31$:
$$
begin{align*}
|31-31|&stackrel{?}{leq}5\
0&leq 5hspace{5mm}checkmark
end{align*}
$$
For $mgeq 36$, I used $m=37$:
$$
begin{align*}
| 37-31|&stackrel{?}{leq}5\
6¬{leq} 5
end{align*}
$$
So, the solution of the inequality is:
$$
color{#c34632}26leq mleq 36
$$
Car average is $31$ mile per hour.
Various average is $5$ mile per hour.
Maximum value is $31+5=36$ Minimum value is $31-5=26$
The average car speed is
$xge26$ mile per hour or $xle36$ mile per hour
text{color{#4257b2}$xge26$ mile per hour or $xle36$ mile per hour}
$$
$$
text{color{#4257b2}In triangle $MWY$}
$$
$$
(WY)^2=(MY)^2-(MW)^2 (WY)^2=(32)^2-(10)^2
$$
$$
(WY)^2=1024-100 (WY)^2=924
$$
Use square root for both side as follows:
$$
sqrt{(WY)^2}=sqrt{924} WY=30.39
$$
$$
angle Y=180text{textdegree}-angle M-angle W angle Y=180text{textdegree}-90text{textdegree}-75text{textdegree}=15text{textdegree}
$$
$$
WY=30.39 MW=10 MY=32
$$
$$
angle Y=15text{textdegree} angle M=75text{textdegree} angle W=90text{textdegree}
$$
$$
text{color{#4257b2}In triangle $JTQ$}
$$
$$
dfrac{MW}{JT}=dfrac{WY}{TQ}=dfrac{MY}{JQ}=dfrac{2}{1}
$$
$$
JT=dfrac{WY}{2}=dfrac{10}{2}=5
$$
$$
TQ=dfrac{MW}{2}=dfrac{30.39}{2}=15.19
$$
$$
JQ=dfrac{MY}{2}=dfrac{32}{2}=16
$$
$$
angle Y=angle Q=15text{textdegree} angle M=angle J=75text{textdegree} angle W=angle T=90text{textdegree}
$$
WY=30.39 MW=10 MY=32
$$
$$
angle Y=15text{textdegree} angle M=75text{textdegree} angle W=90text{textdegree}
$$
$$
TQ=15.19 JT=5 JQ=32
$$
$$
angle Q=15text{textdegree} angle J=75text{textdegree} angle T=90text{textdegree}
$$
We have that the area of the bacteria covering the Petri dish is doubling each day and Inez started the bacteria colony on February $9$ and predicts that it will cover the entire Petri dish by February $21$, so, the conclusion is that on the February $15$ the Petri dish will be half-covered by the bacteria.
#### (b)
An equation for a geometric sequence that represents the percentage covered by the bacteria is the following:
$$
{y}=begin{cases}
a, x=0 \
a(1.5)^x, x>1 \
end{cases}
$$
Here, $x$ represent the number of days and $y$ is a percentage covered by the bacteria.
We will substitute $12$ for $x$ and $1$ for $y$ and solve equation from part b) for $a$ and get the following:
$$
100=a(1.5)^{12}
$$
$$
a=0.77%
$$
So, on the starting day, $0.77%$ of Petri dish was covered.
#### (d)
We will substitute $6$ for $x$ in previous equation and solve equation for $y$ and get:
$$
y=0.0077(1.5)^6
$$
$$
y=8.77%
$$
$$
{y}=begin{cases}
a, x=0 \
a(1.5)^x, x>1 \
end{cases}
$$
; c) $0.77%$; d) $8.77%$
For given $a_n=3cdot5^{n-1}$
We can find the first four terms by putting values of n=1,2,3,4
n=1,
$$
begin{align*}
a_1&=3cdot5^{1-1}\
&=3cdot5^0\&=3cdot1\&=3
end{align*}
$$
n=2,
$$
begin{align*}
a_2&=3cdot5^{2-1}\&=3cdot5^1\&=3cdot5\&=15
end{align*}
$$
n=3,
$$
begin{align*}
a_3&=3cdot5^{3-1}\&=3cdot5^2\&=3cdot25\&=75
end{align*}
$$
n=4,
$$
begin{align*}
a_4&=3cdot5^{4-1}\&=3cdot5^3\&=3cdot125\&=375
end{align*}
$$
Now, first term is already given and next 3 terms can we found out by putting the values of n =1,2,3 in the above equation
$$
a_1=10
$$
Putting n=1 in the equation we get
$$
begin{align*}a_2&=-5cdot{a_1}\
a_2&=-5cdot10\&=-50end{align*}
$$
For n=2, we get
$$
begin{align*}
a_3&=-5cdot{a_2}\a_3&=-5cdot-50\&=250end{align*}
$$
For n=3, we get
$$
begin{align*}
a_4&=-5cdot{a_3}\a_4&=-5cdot250\&=-1250end{align*}
$$
b. 10, -50, 250, -1250
Assume Denali start with $x$ and Quinn start with $2x$
$$
2x+(x-4)=50 2x+x-4=50 3x-4=50
$$
Isolate the variables on left side as follows:
$$
3x=50+4 3x=54
$$
Divide both of sides by $3$ as follows:
$$
x=dfrac{54}{3} x=18
$$
Denali start with $18$ pieces.
Quinn start with $36$ pieces.
text{color{#4257b2}Large $18$ pieces}
$$
One of you suppose to write down all data and maybe the best way is to graph them as a scatterplot.
Two-variable data measures two characteristics. This type of data is generally presented as ordered pairs, scatter plot…
Numerical data have the meaning as a measurement and it can be broken into two types: discrete and continuous.
Categorical data represent characteristics, it can take on numerical values also.
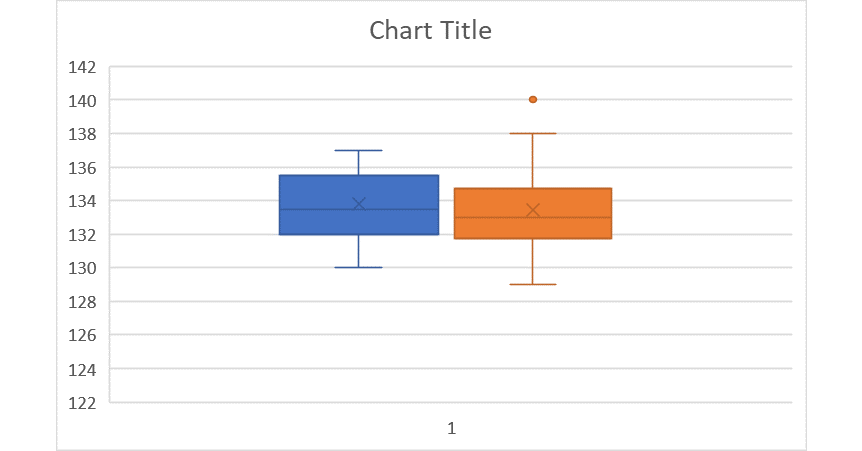
There for Minimum: 46.4 , Maximum: 55.9
There for Median: 50.4
There for First Quartile: 48.5,Third Quartile: 52.5
First Quartile: 48.5
Median: 50.4
Third Quartile: 52.5
Maximum: 55.9
$$
color{#4257b2}text{(a)} 2(x+1)+3=3(x-1)
$$
Multiply from left to right as follows:
$$
2x+2+3=3x-3 2x+5=3x-3
$$
Isolate the variables on left side as follows:
$$
2x-3x=-3-5 -x=-8 x=8
$$
$$
color{#4257b2}text{(b)} |2x+1|=10
$$
Equal $2x+1=10$ as follows:
$$
2x+1=10 2x=10-1 2x=9 x=dfrac{9}{2}
$$
Equal $-2x-1=10$ as follows:
$$
-2x-1=10 -2x=10+1 -2x=11 x=-dfrac{11}{2}
$$
$$
x=dfrac{9}{2} text{When}2x+1ge0 2xge0-1 xge-dfrac{1}{2}
$$
$$
x=-dfrac{11}{2} text{When}2x+1<0 2x<0-1 x<-dfrac{1}{2}
$$
The value of $x$ is equal $x=dfrac{9}{2}$ or $x=-dfrac{11}{2}$
color{#4257b2}text{(c)} |3.2x-4|=-5.7
$$
Equal $3.2x-4=-5.7$ as follows:
$$
3.2x-4=-5.7 3.2x=-5.7+4 3.2x=-1.7 x=-dfrac{1.7}{3.2}
$$
Equal $-3.2x+4=-5.7$ as follows:
$$
-3.2x+4=-5.7 -3.2x=-5.7-4 -3.2x=-9.7 x=dfrac{9.7}{3.22}
$$
$$
x=-dfrac{1.7}{3.2} text{When}3.2x-4ge0 3.2xge4 xgedfrac{4}{3.2}
$$
$$
x=dfrac{9.7}{3.2} text{When}3.2x-4<0 3.2x<4 x<dfrac{4}{3.2}
$$
The value of $x$ is equal $x=-dfrac{1.7}{3.2}$ or $x=dfrac{9.7}{3.2}$
(b) $x=-dfrac{11}{2}$ or $x=dfrac{9}{2}$
(c) $x=-dfrac{1.7}{3.2}$ or $x=dfrac{9.7}{3.2}$
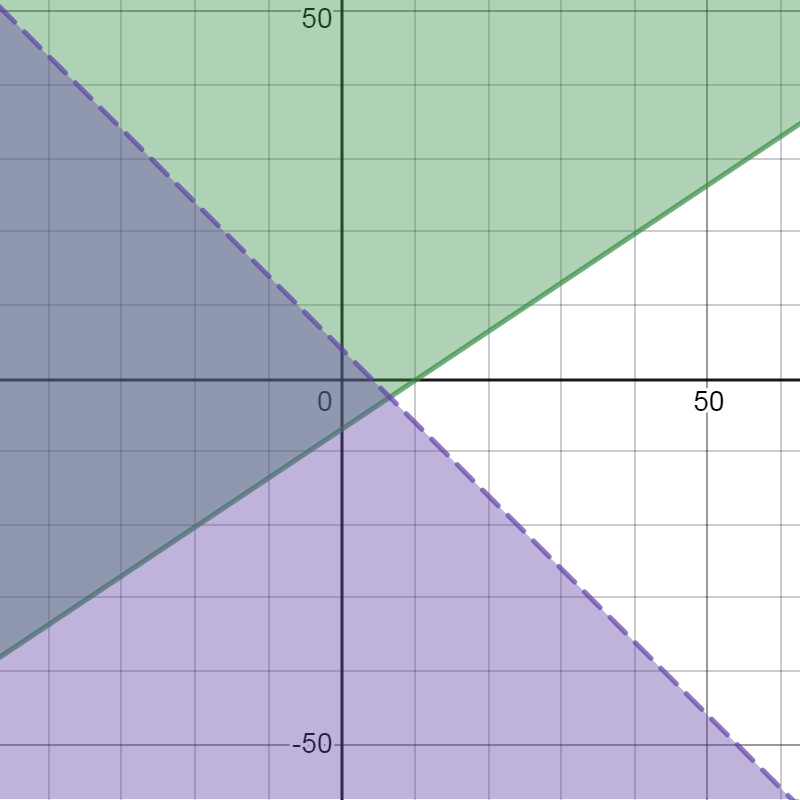
A system of inequalities that represents possible combinations of toys would be the following, where $x$ represents a number of sold cars and $y$ represents the number of sold trucks.
$$
x+yleq200
$$
$$
2x+3ygeq500
$$
#### (b)
On the following picture, there is a graphed set of solutions of previous inequalities.
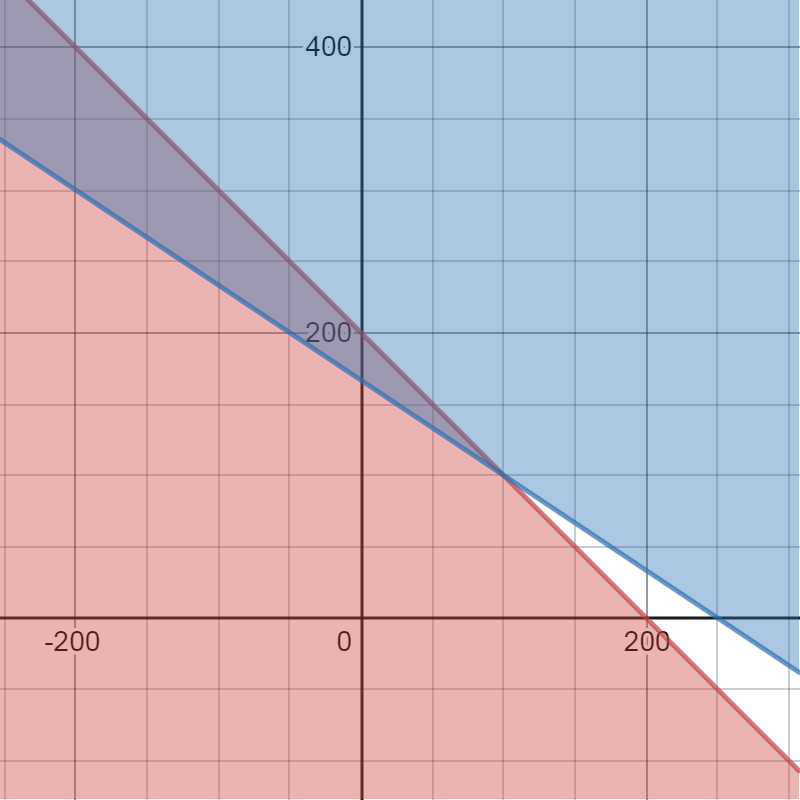
$$
x+yleq200
$$
$$
2x+3ygeq500
$$
b) They can stay in business.
For the same set of data, the mean and the median are both mesures of center which have very different values especially when the data set contains outliers.
The mean is the average of the data set while the median is the middle value of the data set when ordered. For example, the data set is:
$$
1,2,10,11,12
$$
The mean is:
$$
dfrac{1+2+10+11+12}{5}=dfrac{36}{5}=7.2
$$
while the median is 10.
Because the president uses the maximum value of average and fans use the minimum value of it.
The range of average value can be represented by
$$
dfrac{2,000,000+850,000}{2}=dfrac{2,850,000}{2}=1,425,000text{ dollars a year}
$$
text{color{#4257b2}Large $1,425,000$ dollars a year}
$$
Rate in pulse is $72$ beats per minute
Hour $=60$ minute
Rate in pulse is $=72cdot60=4,320$ beats per hour
Day $=24$ hour
Rate in pulse is $=4320cdot24=103,680$ beats per day
Year $=365$ day
Rate in pulse is $=103680cdot365=37,843,200$ beats per year
text{color{#4257b2}$37,843,200$ beats per year}
$$
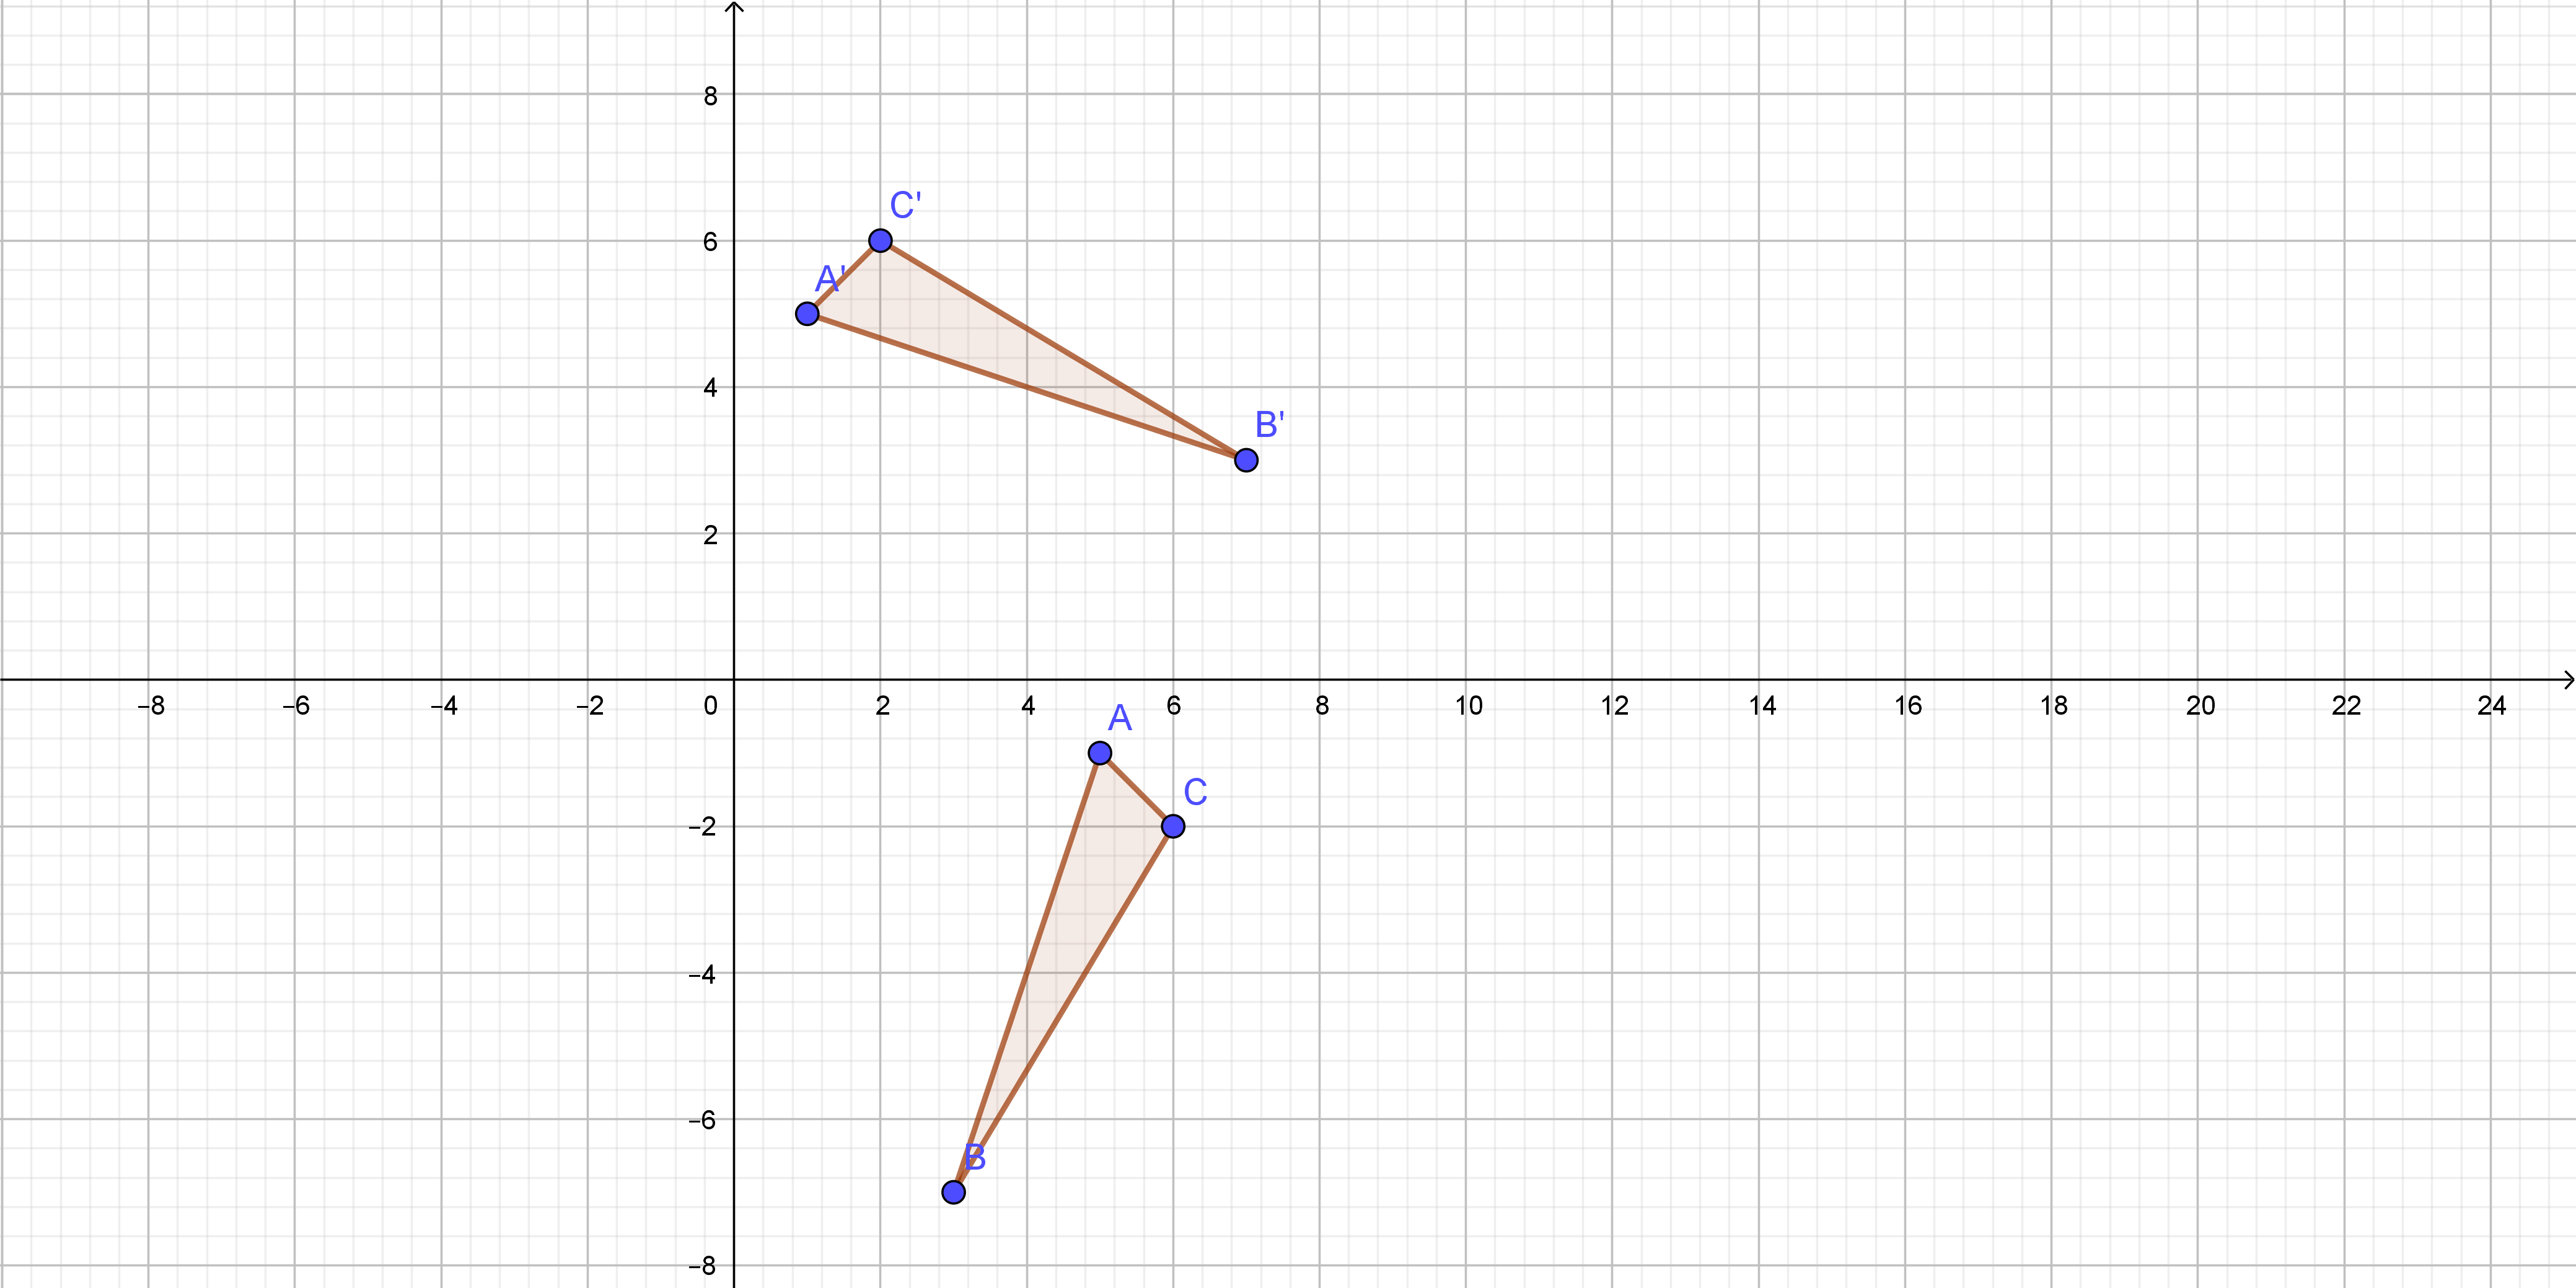
Using $A(3,5)$ and $B(-2,6)$,
$$
m_{AB}=dfrac{Delta y}{Delta x}=dfrac{6-5}{-2-3}=dfrac{1}{-5}=-dfrac{1}{5}
$$
Using $B(-2,6)$ and $C(-5,7)$,
$$
m_{BC}=dfrac{Delta y}{Delta x}=dfrac{7-6}{-5-(-2)}=dfrac{1}{-3}=-dfrac{1}{3}
$$
Since the slopes are not equal, then the points are not on the same line.
To find the maximum and the minimum , find largest and smallest numbers in the list. Since the list is ordered from smallest to largest , the smallest will be first and the largest will be last number.
There for Minimum: 1.58 , Maximum: 4.29
The median is the number in the middle of the list, so here, in a data set with 26 numbers, the median would be the mean of the 13th and 14th.
There for Median: 2.91
The first quartile is the median of the first half of the data. In this case, it would be the 7th number. The third quartile is the median of the second half of the data. In this case it would be the 20th number
There for First Quartile: 2.50,Third Quartile: 3.49
Answer :
Minimum: 1.58
First Quartile: 2.50
Median: 2.91
Second Quartile: 3.49
Maximum: 4.29
The shape is single-peaked and symmetric with no apparent outlines.
On the following picture, there is a graphed Venn diagram which represents required probabilities.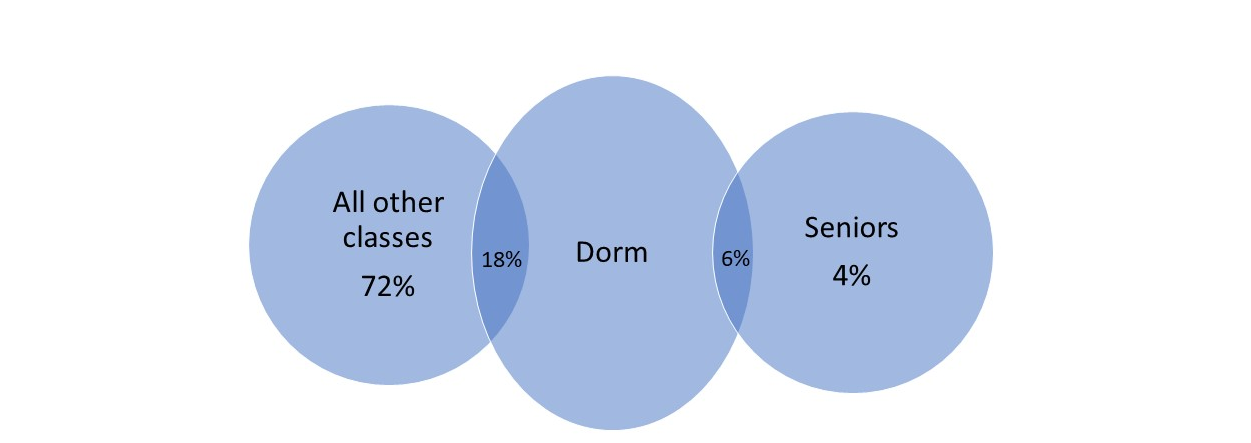
The probability that a randomly selected resident of the Oceanview dorm is a senior is the following:
$$
text{probability}=dfrac{0.06}{0.24}=0.25
$$
Assume the number of t-shirt is $x$ and the number of hat is $y$
Cost of t-shirt is $8$ and cost of hat is $5$
Total cost is $475$
$$
475ge8x+5y {color{#4257b2}8x+5yle475}
$$
{color{#4257b2}8x+5yle475}
$$
$$
text{(a)} dfrac{6 x^2 y^3}{3xy}=2xy^2
$$
$$
text{(b)} (-m n)^3=- (m)^3 (n)^3
$$
$$
text{(c)} (m n)^{-3}=dfrac{1}{(m n)^3}=dfrac{1}{m^3}cdotdfrac{1}{n^3}
$$
$$
text{(d)} dfrac{3.2times10^{-2}}{8times10^3}=dfrac{8times0.4times10^{-2}}{8times10^3}
$$
$$
=0.4times10^{-2}times10^{-3}=0.4times10^{-5}
$$
text{color{#4257b2}(a) $2x y^2$ (b) $- (m)^3 (n)^3$
\ \
(c) $dfrac{1}{m^3}cdot{1}{n^3}$ (d) $0.4times10^{-5}$}
$$
$$
5x-3y=11 3y=5x-11 y=dfrac{5}{3} x-dfrac{11}{3}
$$
Select the line has slope is $k=dfrac{5}{3}$, so follow the following steps:
$$
color{#4257b2}text{(a)} 5x-3y=4
$$
$$
3y=5x-4 y=dfrac{5}{3} x-dfrac{4}{3} text{Slope}=dfrac{5}{3}
$$
Since slopes are equal, so this is correct selection.
$$
color{#4257b2}text{(b)} 5x+3y=-2
$$
$$
3y=-5x-2 y=-dfrac{5}{3} x-dfrac{2}{3} text{Slope}=-dfrac{5}{3}
$$
Since slopes are not equal, so this is not correct selection.
$$
color{#4257b2}text{(c)} 3x-5y=11
$$
$$
5y=3x-11 y=dfrac{3}{5} x-dfrac{11}{5} text{Slope}=dfrac{3}{5}
$$
Since slopes are not equal, so this is not correct selection.
$$
color{#4257b2}text{(d)} 3x-5y=-1
$$
$$
5y=3x+1 y=dfrac{3}{5} x+dfrac{1}{5} text{Slope}=dfrac{3}{5}
$$
Since slopes are not equal, so this is not correct selection.
text{color{#4257b2}(a) $5x-3y=4$}
$$
To get the maximum amount of fruit to the market, we should use the median for the ”average”.
#### (b)
The right ”whisker” is missing because there is no variability outside the upper quartiles.
#### (c)
The reason for this may be that the mean is actually average and here we, as average, reported median.
When we want to find the average of some data, we should use the mean and when we want to calculate the middle value in the list of numbers, we would use the median.
$$
textbf{For Fancyville:}
$$
$$
text{mean}=dfrac{230+270+dots+250+210}{14}=dfrac{7095}{14}approx 507tocolor{#c34632}$507000
$$
When arranged in order,
$$
150,160,210,230,240,250,270,280,305,320,340,440,1100,2800
$$
Since there are 14 (even) data values, the median is the average of the 7th and 8th values:
$$
text{median}=dfrac{270+280}{2}=275to color{#c34632}$275000
$$
$$
textbf{For Smallville:}
$$
$$
text{mean}=dfrac{255+289+275+247+299 +281+272}{7}=dfrac{1918}{7}=274 tocolor{#c34632}$274000
$$
When arranged in order,
$$
247,255,272,275,281,289,299
$$
Since there are 7 (odd) data values, the median is 4th value:
$$
text{median}=275to color{#c34632}$275000
$$
Both towns have the same median but Smallville has a smaller mean. Hence, “typical” home costs less in Smallville.
Smallville: mean $= $274000$, median $=$275000$
Smallville
The shape of the data is used to describe the different types of graphs.
It can be symmetric, can have picks, can be skewed, uniform.
A measure of spread is used to describe the variability in a sample or population.
An outliner is a data point that differs significantly from other observations.
A histogram is a type of bar graph that shows how many of something occurred, also called the frequency, while a scatter plot is used for comparing pairs of values to see if they are related.
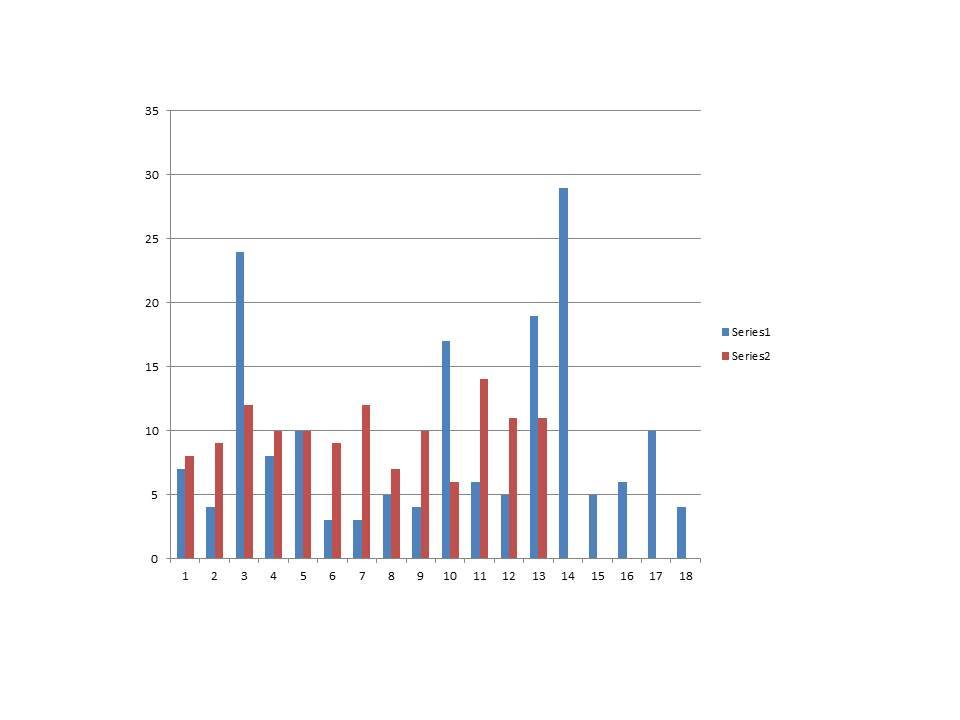
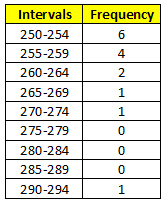
For the histogram: Using an interval of 5, make a frequency table for the given data values as shown:
$$
begin{align*}
&text{min} & &=250\
&text{Q1} & &=253\
&text{median} & &=257\
&text{Q3} & &=263\
&text{max} & &=291
end{align*}
$$
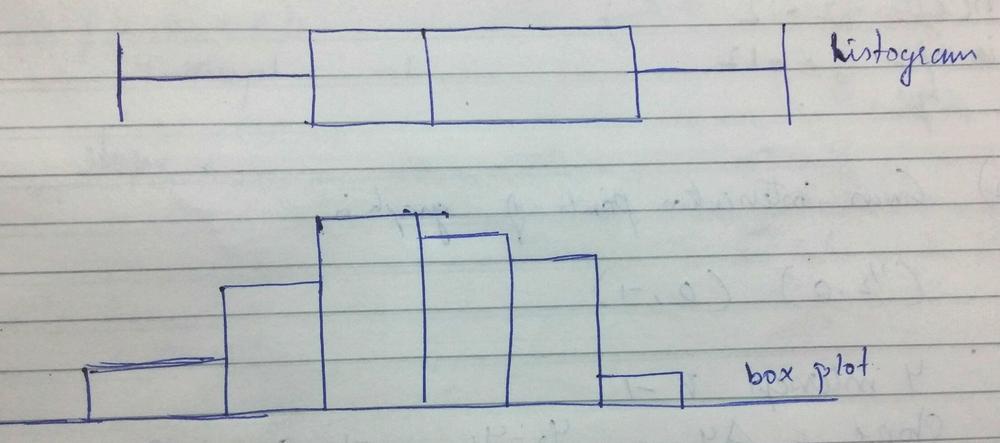
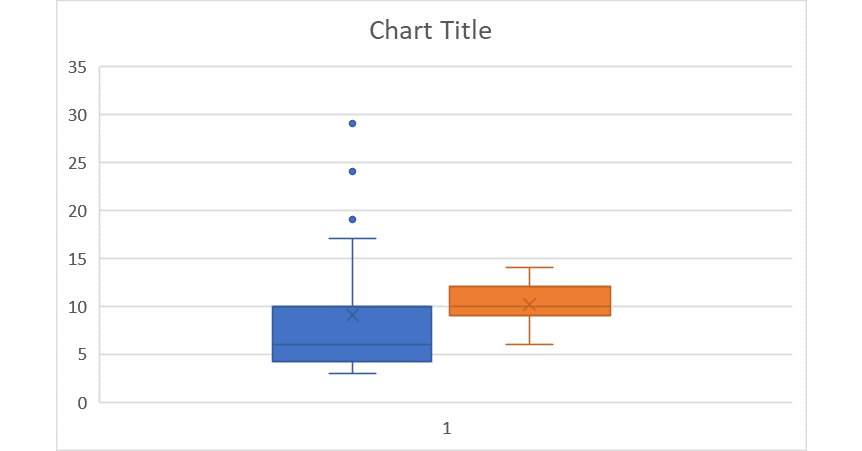
The histogram and the boxplot are shown below:
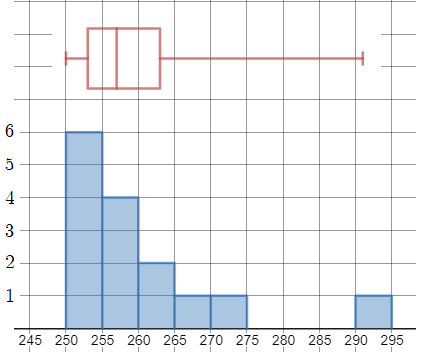
The center is at about 257 to 260 (look at the median). The histogram is single-peaked and skewed. The IQR (interquartile range is Q3 $-$ Q2 = $263-253=10$. There is one outlier which is 291.
$textbf{c.}$
First, we find the mean (or average) of the data:
$$
dfrac{250+251+253+dots+265+270+291}{15}=dfrac{3896}{15}approx 259.7
$$
The median and the mean have values that are close to each other so we can use either. However, the median has no decimal so it is more appropriate to report. Also, there is an outlier so it affects the mean more than the median.
b. The center is at about 257 to 260. The histogram is single-peaked and skewed. The IQR is 10. There is one outlier which is 291.
c. median
$$
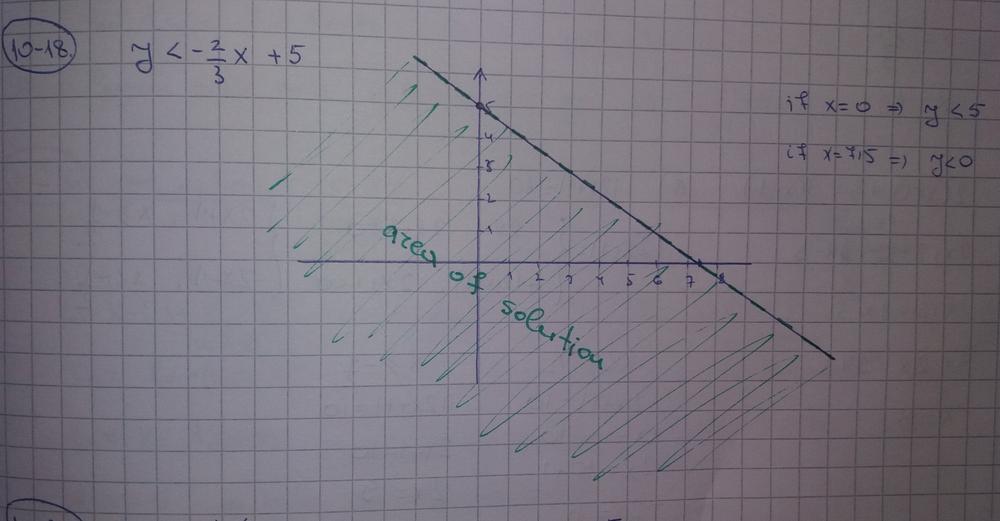
m=dfrac{Delta y}{Delta x }=dfrac{2-0}{0-3}=dfrac{2}{-3}=-dfrac{2}{3}
$$
Since $b=2$, then the equation is:
$$
y=-dfrac{2}{3}x+2
$$
Since the line is dashed, the points on the line itself are not solutions in the inequality. So, either use $$.
We can then assign a point that is on the shaded region, say $(0,0)$ and determine what inequality to use:
$$
begin{align*}
y&=-dfrac{2}{3}x+2\
0&stackrel{?}{=}-dfrac{2}{3}(0)+2\
0&stackrel{?}{=}0+2\
0&stackrel{?}{=}2
end{align*}
$$
The appropriate inequality to use is $<$ since $0< 2$. Hence, the inequality for the graph is:
$$
color{#c34632} y<-dfrac{2}{3}x+2
$$
y<-dfrac{2}{3}x+2
$$
Also, we can notice that on the side whose length is $8$ are angles whose measures are $90^{circ}$ and $30^{circ}$, so, those angles and side of the first triangle are corresponding to side and angles of other triangle and according to this statement, those triangles are congruent.
$$
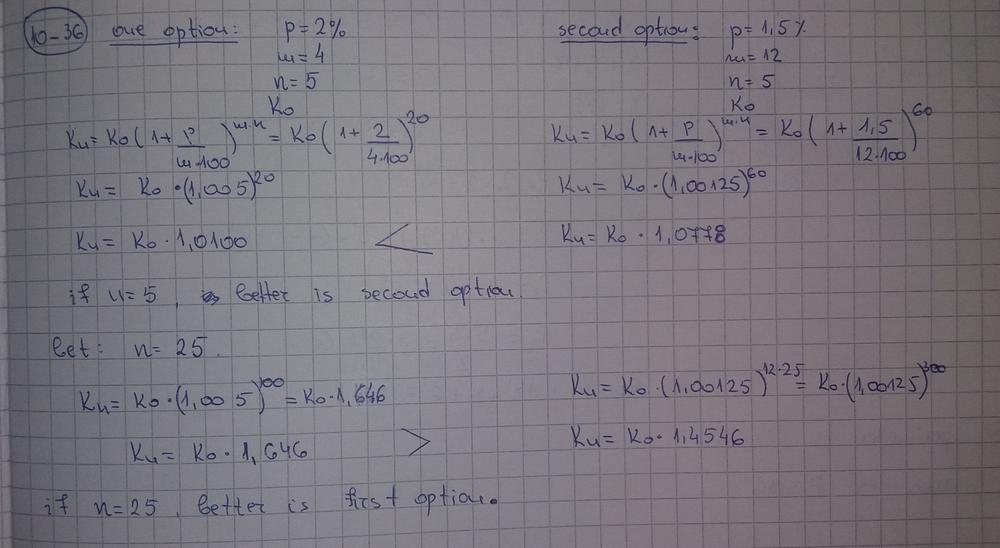
A=P(1+5cdot0.025)=P(1.125)
$$
$$
A=P(1+25cdot0.025)=1.625P
$$
Now, we will calculate the amount of money after $5$ and $25$ years using compound interest:
$$
A=P(1.02)^{5cdot4}=1.49P
$$
$$
A=P(1.02)^{25cdot4}=7.24P
$$
We can notice the following:
$$
1.125P<1.49P
$$
$$
1.625P<7.24P
$$
So, the conclusion is that compound account is better.
Here we have an arithmetic sequence where the first term is $5$ and the difference between terms is $3$, so, we get that $n$-th term is:
$$
a_{n}=a_{1}+(n-1)d
$$
$$
a_{n}=5+3(n-1)
$$
We have the following points, they are first two terms: $(1,5)$ and $(2,8)$, so, the slope of required line is:
$$
text{slope}=dfrac{8-5}{2-1}=3
$$
#### (b)
Here, the first two terms of this sequence are $(1,3)$ and $(2,9)$, so, the slope of required line:
$$
text{slope}=dfrac{9-3}{2-1}=6
$$
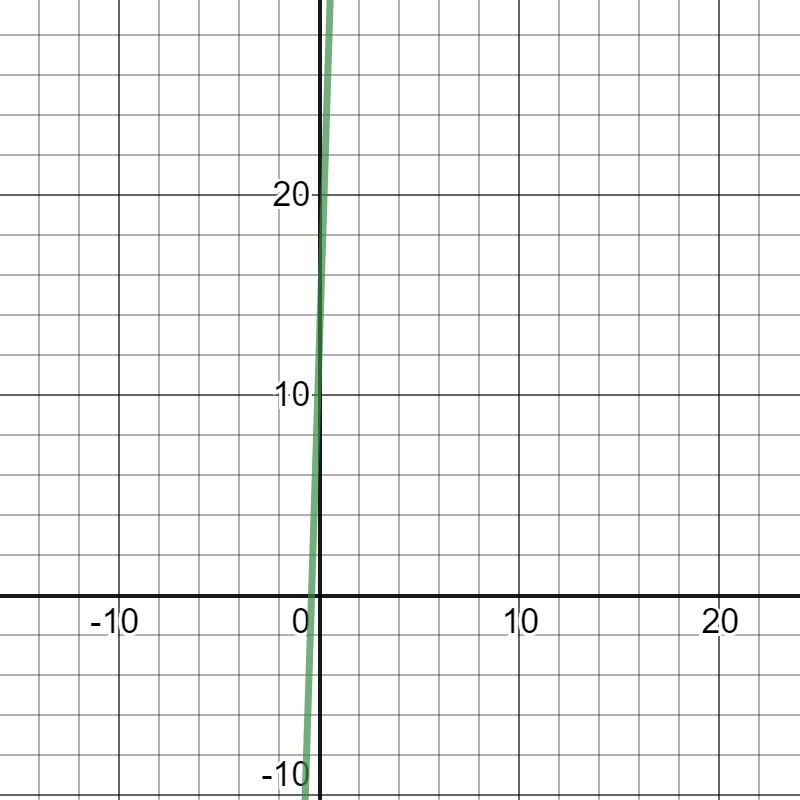
Here, the first two terms of this sequence are $(1,26)$ and $(2,21)$, so, the slope of required line is:
$$
text{slope}=dfrac{21-26}{2-1}=-5
$$
#### (d)
Here, the first two terms of this sequence are $(1,7)$ and $(2, 8.5)$, so, the slope of required line is:
$$
text{slope}=dfrac{8.5-7}{2-1}=1.5
$$
{color{#4257b2}text{ a) }}
$$
$$
begin{align*}
&text{We use this rule}\
&color{#c34632}mathrm{For:}left(gleft(xright)right)^2=fleft(aright)mathrm{:the:solutions:are:}gleft(xright)=sqrt{fleft(aright)},::-sqrt{fleft(aright)} \\
&x+4=sqrt{49} tag{First}\
&x+4=sqrt{7^2} tag{Factor the number} \
&x+4=7 tag{Simplify}\
&x+4-4=7-4 tag{Subtract 4 from both sides}\
&color{#c34632}x=3 \\
&:x+4=-sqrt{49} tag{Second}\
&x+4=-7 tag{Simplify}\
&x+4-4=-7-4 tag{Subtract 4 from both sides}\
&color{#c34632}x=-11 \\
&boxed{{color{#c34632} x=3, x=-11 } }
end{align*}
$$
{color{#4257b2}text{ b) }}
$$
$$
begin{align*}
&text{Square both sides}\
&left(3sqrt{x+2}right)^2=12^2\\
&9x+18=144 tag{Expand} \
&9x+18-18=144-18 tag{Subtract 18 from both sides}\
&9x=126 tag{Simplify}\
&frac{9x}{9}=frac{126}{9} tag{Divide both sides by 9}\\
&boxed{{color{#c34632} x=14 } }
end{align*}
$$
{color{#4257b2}text{ c) }}
$$
$$
begin{align*}
&text{Multiply}\
&frac{2}{x}cdot :10x+frac{3}{10}cdot :10x=frac{13}{10}cdot :10x\\
&20+3x=13x tag{Simplify} \
&20+3x-20=13x-20 tag{Subtract 20 from both sides}\
&3x=13x-20 tag{Simplify}\
&3x-13x=13x-20-13x tag{Subtract 13x from both sides}\
&-10x=-20 tag{Simplify}\
&frac{-10x}{-10}=frac{-20}{-10} tag{Divide both sides by -10}\\
&boxed{{color{#c34632} x=2 } }
end{align*}
$$
{color{#4257b2}text{ d) }}
$$
$$
begin{align*}
&text{Add 2 to both sides}\
&5left(2x-1right)-2+2=13+2\\
&5left(2x-1right)=15 tag{Simplify} \
&frac{5left(2x-1right)}{5}=frac{15}{5} tag{Divide both sides by 5}\
&2x-1=3 tag{Simplify}\
&2x-1+1=3+1 tag{Add 1 both sides}\
&2x=4 tag{Simplify}\
&frac{2x}{2}=frac{4}{2}tag{Divide both sides by 2}\\
&boxed{{color{#c34632} x=2 } }
end{align*}
$$
color{#4257b2} text{a)}x=3, x=-11
$$
$$
color{#4257b2} text{b)}x=14
$$
$$
color{#4257b2} text{c)}x=2
$$
$$
color{#4257b2} text{d)}x=2
$$
Let:
$$
begin{align}
3x-3&=y\
6x-5y&=12
end{align}
$$
Since $y$ is already isolated in eq. (1), we use the Substitution Method and substitute it to eq. (2) then solve for $x$:
$$
begin{align*}
6x-5(3x-3)&=12\
6x-15x+15&=12\
-9x+15&=12\
-9x&=-3\
x&=dfrac{1}{3}
end{align*}
$$
Solve for $y$ using eq. (1):
$$
begin{align*}
3left(dfrac{1}{3}right)-3&=y\
1-3&=y\
-2&=y
end{align*}
$$
So, the solution of the system is:
$$
color{#c34632}left(dfrac{1}{3},-2right)
$$
Let:
$$
begin{align}
3x-2y&=30\
2x+3y&=-19
end{align}
$$
I chose to use Elimination Method but first, we must have one variable having the same or opposite coefficients. I decided to eliminate $y$ so we multiply eq. (1) by 3 and eq. (2) by 2 to obtain the equations:
$$
begin{align}
9x-6y&=90\
4x+6y&=-38
end{align}
$$
Add eq. (3) and eq. (4) to eliminate $y$ and solve for $x$:
$$
begin{align*}
13x&=52\
x&=4
end{align*}
$$
Solve for $y$ using eq. (1):
$$
begin{align*}
3(4)-2y&=30\
12-2y&=30\
-2y&=18\
y&=-9
end{align*}
$$
So, the solution of the system is:
$$
color{#c34632}(4,-9)
$$
b. $(4,-9)$
$$
color{#4257b2}text{(a)} 3x-3=y 6x-5y=12
$$
$$
3x-y=3 6x-5y=12
$$
Multiply the first eq. by $-2$ to get $-6x+2y=-6$
Using elimination property for the new equations as follows:
$$
(6x-6x)+(-5y+2y)=(12-6) -3y=6
$$
Divide both side by $-3$ as follows:
$$
y=dfrac{6}{-3} y=-2
$$
Substitution the value of $y=-2$ for first equation as follows:
$$
3x-(-2)=3 3x+2=3 3x=3-2
$$
$$
3x=1 x=dfrac{1}{3}
$$
$text{color{#4257b2}Check:}$ Substitute the value of $x=dfrac{1}{3}, y=-2$ in the equation as follows:
$$
3cdotdfrac{1}{3}-(-2)=3 \ 1+2=3 3=3
$$
Since the left side is equal the right side, so the answer is correct.
color{#4257b2}text{(b)} 3x-2y=30 2x+3y=-19
$$
Multiply the first equ. by $3$ to get $6x-6y=60$
Multiply the second equ. by $2$ to get $4x+6y=-38$
Using elimination property for the new equations as follows:
$$
(6x+4x)+(-6y+6y)=(60-38) 10x=22
$$
Divide both side by $10$ as follows:
$$
x=dfrac{22}{10} x=2.2
$$
Substitution the value of $x=2.2$ for first equation as follows:
$$
(3cdot2.2)-2y=30 6.6-2y=30 2y=6.6-30
$$
$$
2y=-23.4 y=-dfrac{23.4}{2} y=-11.7
$$
$text{color{#4257b2}Check:}$ Substitute the value of $x=2.2, y=-11.7$ in the equation as follows:
$$
(3cdot2.2)-(2cdot-11.7)=30 6.6+23.4=30 30=30
$$
Since the left side is equal the right side, so the answer is correct.
(b) $x=2.2 y=-11.7$
$$
color{#4257b2}text{(a)} -2 |x|=-8
$$
Equal $-2cdot x=-8$ as follows:
$$
-2x=-8 2x=8
$$
$$
x=dfrac{8}{2} x=4
$$
Equal $-2cdot -x=-8$ as follows:
$$
2x=-8 x=-dfrac{8}{2} x=-4
$$
The values of $x$ are equal
$$
x=4 text{ when} xge0
$$
$$
x=-4 text{ when} x<0
$$
$$
color{#4257b2}text{(b)} |x-3.2|=4.7
$$
Equal $x-3.2=4.7$ as follows:
$$
x=4.7+3.2 x=7.9
$$
Equal $-x+3.2=4.7$ as follows:
$$
-x=4.7-3.2 x=1.5
$$
The values of $x$ are equal
$$
x=7.9 text{ when} x-3.2ge0 xge3.2
$$
$$
x=1.5 text{ when} x-3.2<0 xge3.2
$$
color{#4257b2}text{(c)} |9+6x|=4
$$
Equal $9+6x=4$ as follows:
$$
6x=4-9 6x=-5 x=-dfrac{5}{6}
$$
Equal $-9-6x=4$ as follows:
$$
-6x=4+9 -6x=13 x=-dfrac{13}{6}
$$
The values of $x$ are equal
$$
x=-dfrac{5}{6} text{ when} 9+6xge0 6xge-9 xge-dfrac{9}{6}
$$
$$
x=-dfrac{13}{6} text{ when} 9+6x<0 6x<-9 x<-dfrac{9}{6}
$$
$$
color{#4257b2}text{(d)} |-7x-7|=1
$$
Equal $-7x-7=1$ as follows:
$$
-7x=1+7 -7x=8 x=-dfrac{8}{7}
$$
Equal $7x+7=1$ as follows:
$$
7x=1-7 7x=-6 x=-dfrac{6}{7}
$$
The values of $x$ are equal
$$
x=-dfrac{8}{7} text{ when} -7x-7ge0 -7xge7 xge-1
$$
$$
x=-dfrac{6}{7} text{ when} -7x-7<0 -7x<7 x<-1
$$
(c) $x=-dfrac{5}{6} x=-dfrac{13}{6}$ (d) $x=-dfrac{8}{7} x=-dfrac{6}{7}$
Here, we can notice that side $BD$ belongs to both triangles and one included angle is $90^{circ}$, so, the conclusion is that there have to be sides $overline{AD}$ and $overline{CD}$ are equal in lengths.
So, the conclusion is that the required information is a).
Required transformation would be the following:
$$
(-3x)^2=(-3)^2x^2=9x^2
$$
#### (b)
Required transformation would be the following:
$$
(3x)^{-2}=dfrac{1}{(3x)^2}=dfrac{1}{3^2x^2}=dfrac{1}{9x^2}
$$
#### (c)
Required transformation would be the following:
$$
dfrac{2cdot3^2x^2}{3x^3}=dfrac{18x^2}{3x^3}=dfrac{6}{x}
$$
#### (d)
Required transformation would be the following:
$$
2cdot3^2x^2cdot3^2x^2=162x^4
$$
We get the following system of equations using all given information:
$$
3.6(x-y)=1800
$$
$$
3(x+y)=1800
$$
We will multiply the first equation by the $3$ and second by $3.6$ and get:
$$
10.8x-10.8y=5400
$$
$$
10.8x+10.8y=6480
$$
Now, we will add those equations:
$$
21.6x=11880
$$
$$
x=550
$$
$$
y=50
$$
So, the speed of plane is $550$ mph and speed of wind is $50$ mph.
On the following pictures, there is a combination of histogram and boxplot of each sugar.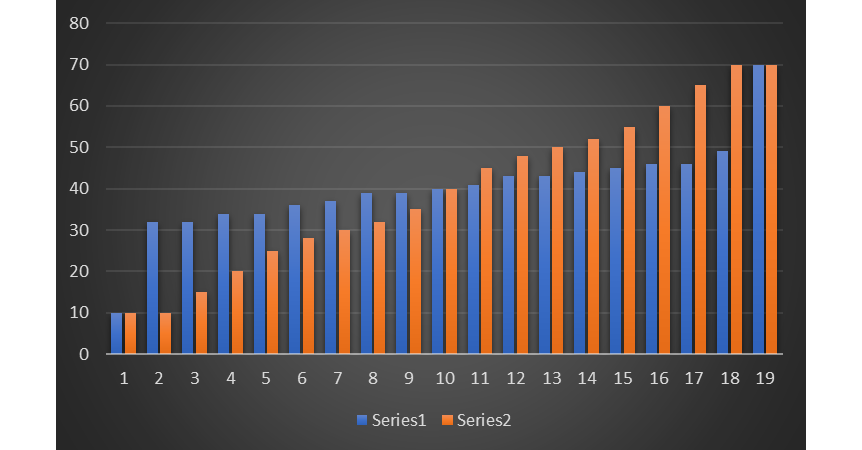
The mean of data of Sugar $P$ is $40$ and also the median is $40$.
#### (c)
The conclusion is that you can use a t-test in order to differentiate between these two data sets.
If the biologist wants to consistently grow large cells, he should use Sugar $P$.
Range of cell sites each sugar grown is $60$.
The range is often not a useful measure of spread because it is limited,
it does set the boundaries of the scores.
#### (b)
After you determine the distance each value is to the mean,
calculate the mean distance and get that for sugar $W$ it is $3.53$ and for sugar
$P$ it is $8.61$.
#### (c)
If we calculate the mean absolute deviation if the data has outliers,
it would have a large effect on our calculation.
It will give us the wrong idea about the center and spread.
#### (d)
The $IQR$ for sugar $W$ is $9.5$ and $IQR$ for sugar $P$ is $27$.
We can notice that $IQR$ for sugar $P$ is larger than $IQR$ for sugar $W$.
We can notice that the standard deviation of the sugar $P$ is much larger than the standard deviation of sugar $P$.
collect the data and calculate the standard deviation,
it is the average of all distances to the mean after
the distances have been made positive by squaring.
And then compare results with other teams.
And because of this, it is better to use the range as a way to report the spread of our team’s golfing data.
We can notice that the standard deviation of the sugar $P$ is much larger than the standard deviation of sugar $P$.
We will use the standard deviation as a measure of spread if we have the entire population or we have a sample of a larger population, but we are only interested in this sample and do not wish to generalize our findings to the population.
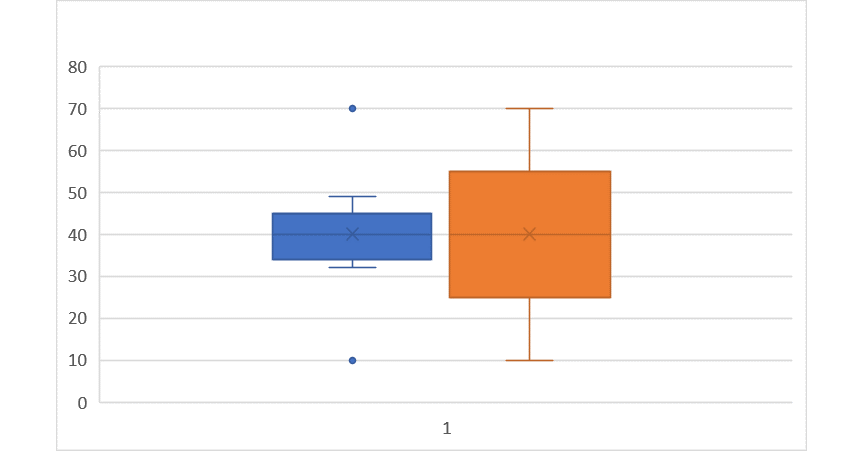
Below is given data in ascending order:
$$
10,10,15,20,25,30,31,32,34,35,36,39,40,40,43,44,45,45,46,50,50,55,60,65,65,69
$$
Precision of measurement is to a whole unit
Median of that data is the mean of measurement at $13^{textrm{th}}$ and $14^{textrm{th}}$ position i.e. $dfrac{40+40}{2}=$$text{textcolor{#4257b2}{ 40}}$
First quartile is median of lower 12 data values is the mean of measurement at $6^{textrm{th}}$ and $7^{textrm{th}}$ position i.e. $dfrac{30+31}{2}=$ $text{textcolor{#4257b2}{ 30.5}}$
Third quartile is median of upper 12 data values is the mean of measurement at $6^{textrm{th}}$ and $7^{textrm{th}}$ position i.e. $dfrac{50+50}{2}=$ $text{textcolor{#4257b2}{ 50}}$
Range of IQR is: $50-30.5=19.5$
Below is box plot for given data:
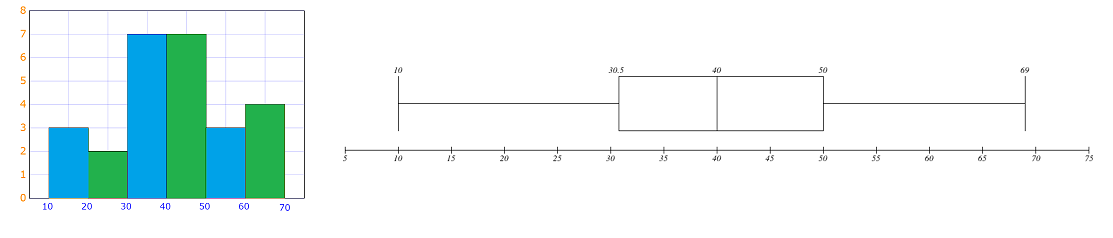
$$
color{#4257b2}text{(a) In the left figure.}
$$
We know all total angles of triangles is $180text{textdegree}$
$$
3x+5text{textdegree}+2x+18text{textdegree}+2x+17=180text{textdegree}
$$
Adds similar to group loke terms as follows:
$$
((3x+2x+2x)+(5+18+17)=180text{textdegree}
$$
$$
7x+40=180text{textdegree} 7x=180-40=140text{textdegree}
$$
Divide both of side by $7$ as follows:
$$
x=dfrac{140text{textdegree}}{7}=20text{textdegree} x=20text{textdegree}
$$
$$
color{#4257b2}text{(b) In the right figure.}
$$
We know all total angles of triangles is $180text{textdegree}$
$$
90text{textdegree}+30text{textdegree}+x=180text{textdegree}
$$
Adds similar to group loke terms as follows:
$$
x=180text{textdegree}-90text{textdegree}-30text{textdegree}
$$
$$
x=180text{textdegree}-120text{textdegree} x=60text{textdegree}
$$
On the following picture, there is a graph of this equation.
$$
color{#4257b2}text{(a)} (x+2)(x-5)
$$
Use distributive property as follows:
$$
x(x-5)+2(x-5)=(xcdot x)-(xcdot5)+(2cdot x)-(2cdot5)
$$
$$
x^2-5x+2x-10
$$
Add similar tiles to group like terms as follows:
$$
x^2+(-5x+2x)-10
$$
$$
x^2-3x-10
$$
$$
color{#4257b2}text{(b)} (y+2x)(y+3x)
$$
Use distributive property as follows:
$$
y(y+3x)+2x(y+3x)=(ycdot y)+(ycdot3x)+(2xcdot y)+(2xcdot3x)
$$
$$
y^2+3yx+2yx+6x^2
$$
Add similar tiles to group like terms as follows:
$$
y^2+6x^2+(3xy+2xy)
$$
$$
y^2+6x^2+5yx
$$
color{#4257b2}text{(c)} (3y-8)(-x+y)
$$
Use distributive property as follows:
$$
3y(-x+y)-8(-x+y)=(3ycdot -x)+(3ycdot y)-(8cdot -x)-(8cdot y)
$$
$$
=-3xy+3y^2+8x-8y
$$
$$
=3y^2+8x-8y-3xy
$$
$$
color{#4257b2}text{(d)} (x-3y)(x+3y)
$$
This is difference between completed square.
$$
(x-3y)(x+3y)=(xcdot x)-(3ycdot3y)
$$
$$
x^2-9y^2
$$
(c) $3y^2+8x-8y-3xy$ (d) $x^2-9y^2$
Jerry delivers a total of 91 papers:
$$
2(t)+1(s)=91
$$
$$
2t+s=91tag{1}
$$
It takes exactly one hour (60 minutes) to deliver all papers:
$$
t+s=60tag{2}
$$
Use the Elimination Method. Subtract each side of eq. (1) and eq. (2) to eliminate $s$ and solve for $t$:
$$
t=31
$$
Solve for $s$ using eq. (2):
$$
begin{align*}
31+s&=60\
s&=29
end{align*}
$$
Using the times to deliver, Jerry delivered:
$$
begin{align*}
&textit{Times}=(2text{ papers/minute})(31text{ minutes})=color{#c34632}62\
&textit{Star}=(1text{ paper/minute})(29text{ minutes})=color{#c34632}29
end{align*}
$$
Star: 29
Assume number of adults tickets is $x$.
Assume number of students tickets is $y$.
Cost of ticket of adults is $7$ dollars.
Cost of ticket of students is $5$ dollars.
$$
color{#4257b2}7x+5yge5000
$$
color{#4257b2}7x+5yge5000
$$
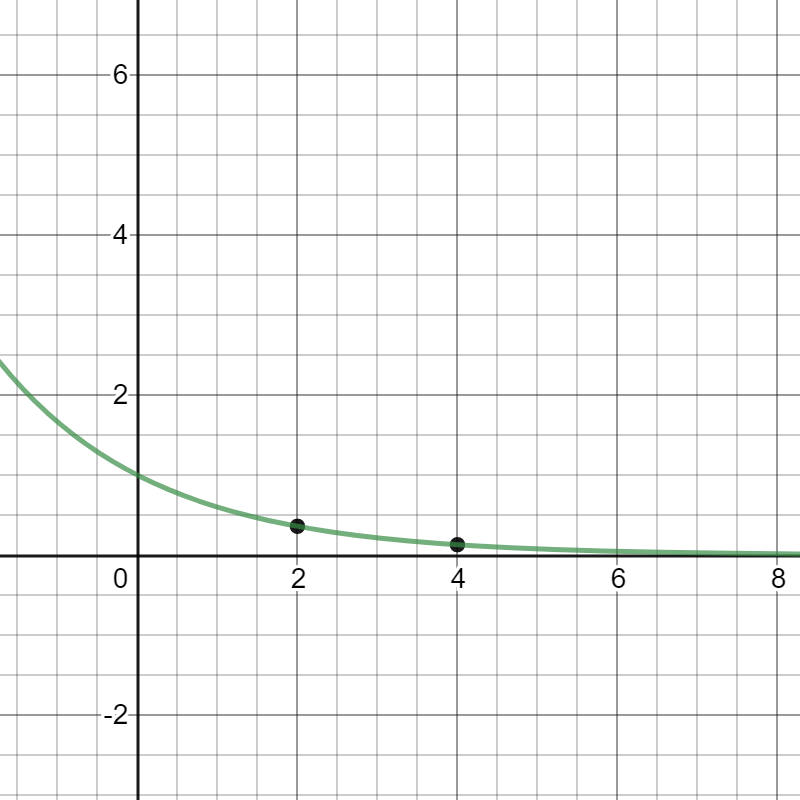
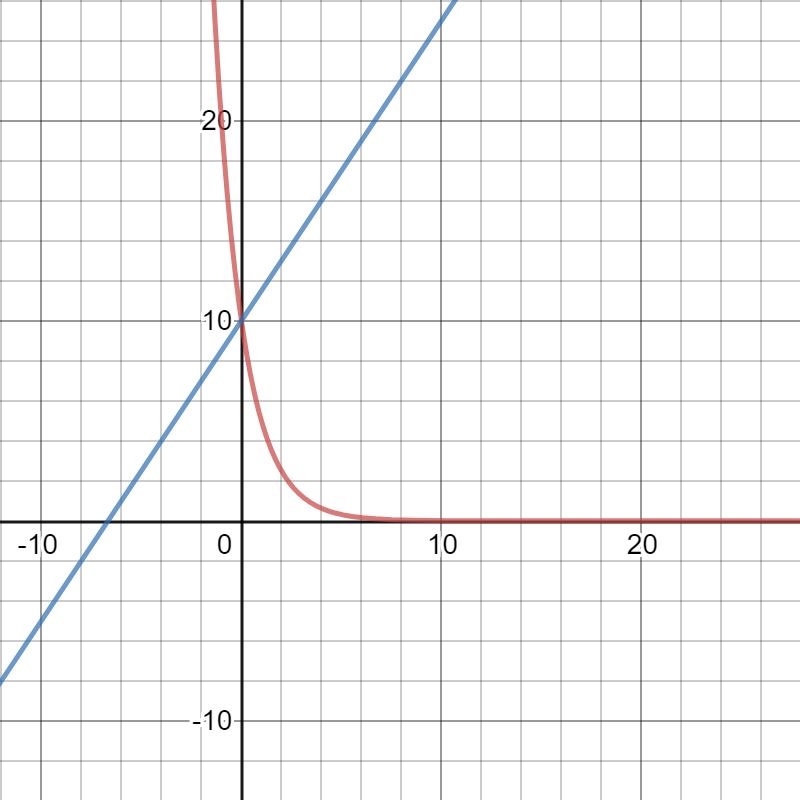
On the following picture, there are graphed given functions.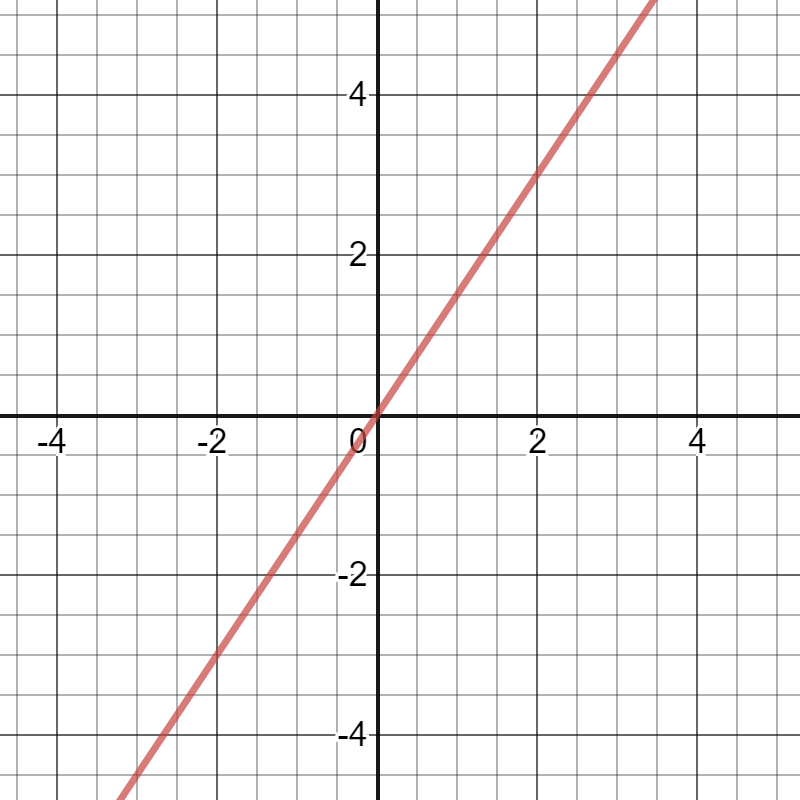
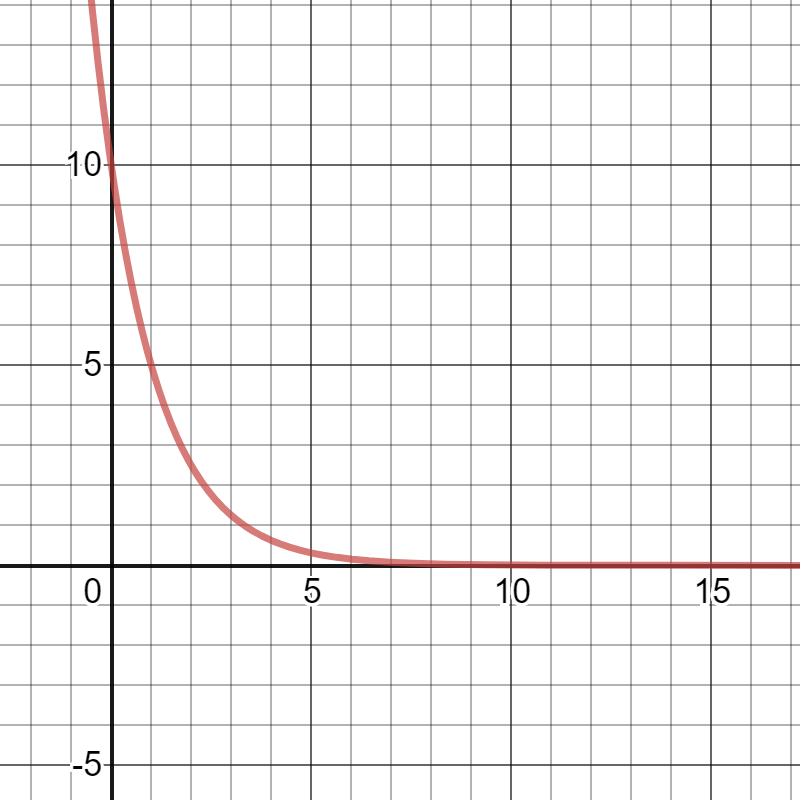
The conclusion is that we suppose to add $10$ to the expression of $l(x)$. This situation is graphed on the following picture.
In order to create a new slide that will drop swimmers off $3$ feet above the water, we got new functions $l(x)$ and $h(x)$, they are:
$$
l(x)=dfrac{3}{2}x+3
$$
$$
h(x)=3left(dfrac{1}{2} right)^x
$$
This situation is graphed on the following picture:
$h(x)=3left(dfrac{1}{2} right)^x$
This team needs to fix their problem in that way that they need to intersect $m(x)$ and $h(x)$ at point $(0,3)$, so, required expression would be $m(x)+1$.
#### (b)
This team needs to fix their problem on that way that they need to intersect $c(x)$ and $h(x)$ at point $(0,3)$, so, the required expression would be $c(x)-1$.
Adding the value of $k$ on the graph of $f(x)$ moving graph
across the $y$-axis up and down for $k$ units.
#### (b)
For example, observe function $g(x)=5x$, we can conclude
that adding $k$ has the same effect like in previous part.
#### (c)
Now, we can observe function $h(x)=8^x$, we can conclude
that adding $k$ has the same effect like in previous parts.
b) $g(x)=5x$; c) $h(x)=8^x$
Transformation $f(x)-1$ means that the graph of $f(x)$
will be translated $1$ unit down across the $y$-axis.
#### (b)
Transformation $f(x)+3$ means that the graph of $f(x)$
will be translated $3$ units up across the $y$-axis.
it affects that way that graph is translated for $k$ units across
the $y$-axis.
When $f(x)$ is linear function, $b+k$ becomes $y$-intercept.
When $f(x)$ is an exponential function, $a+k$ becomes $y$-intercept.
Here, the conclusion is that the graph of $f(x)$
is translated $7$ units down.
#### (b)
Here, the conclusion is that the graph of $g(x)$ is translated
$15$ units up.
Here, the conclusion is is that graph of $j(x)$ is translated $13$
units up.
#### (d)
Here, the conclusion is is that graph of $n(x)$ is translated $4$
units down.
c) Translation $13$ units up; d) Translation $4$ units down.
According to the SSA condition which specifies two sides and a non-included angle we can conclude that those triangles are congruent.
#### (b)
According to the SSA condition which specifies two sides and a non-included angle we can conclude that those triangles are congruent.
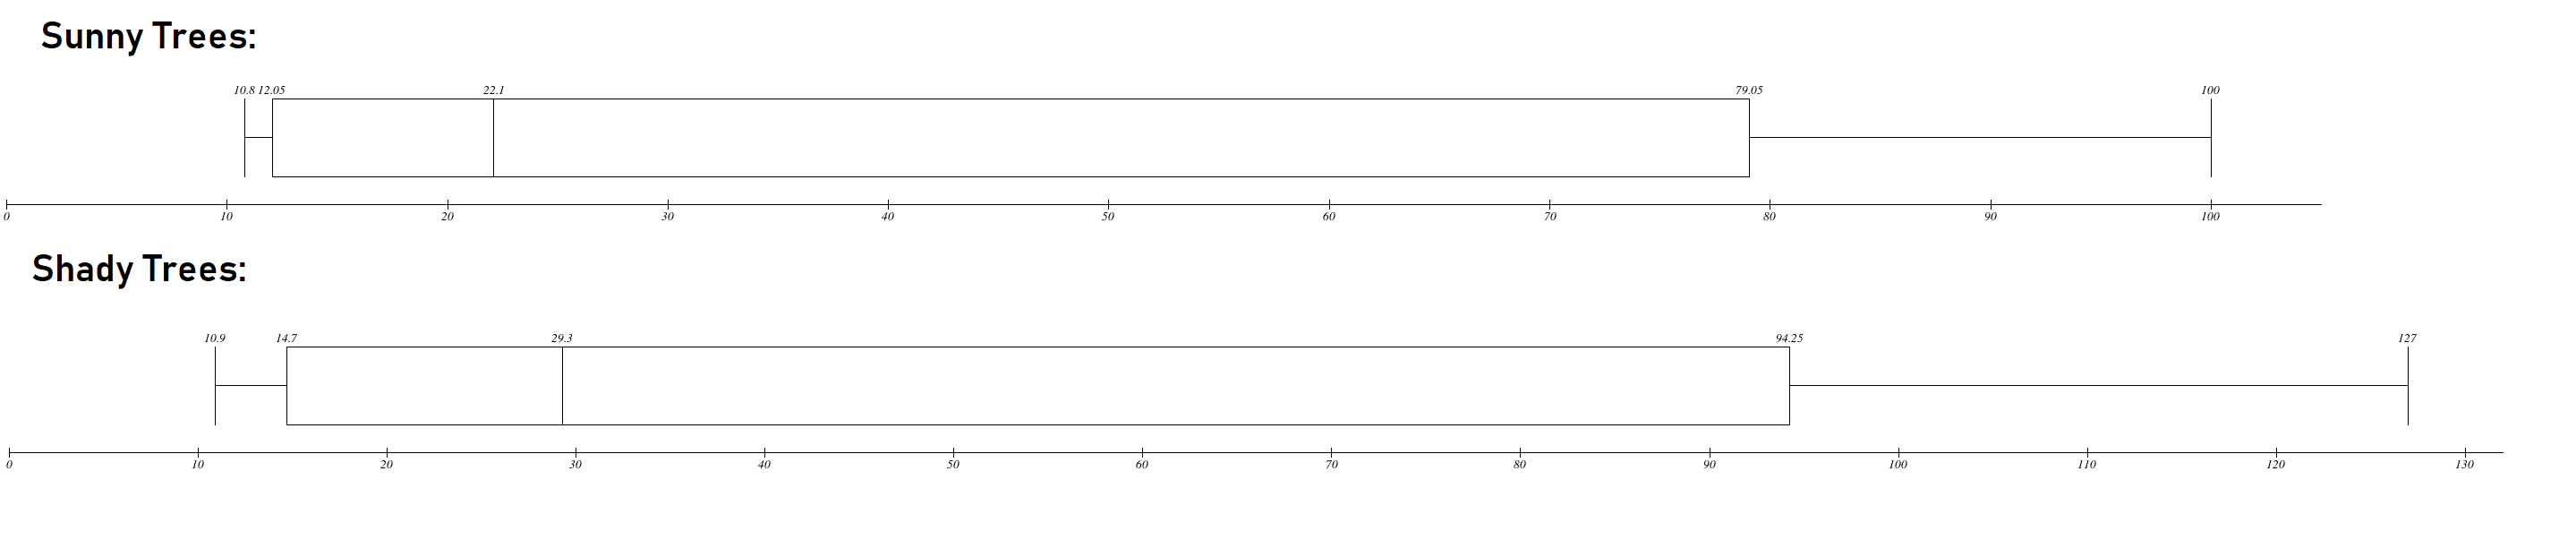
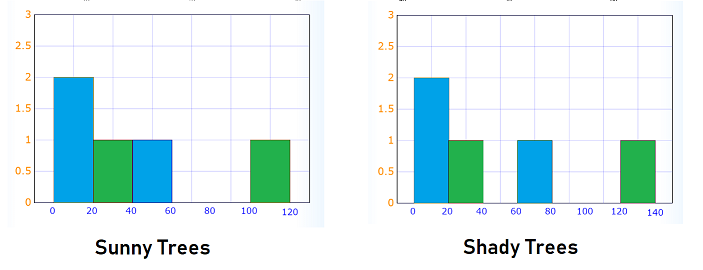
begin{tabular}{|c|c|c|}
hline
& Sunny Trees & Shady Trees \ hline
Minimum & 10.8 & 10.9 \ hline
First Quartile & 12.05 & 14.7 \ hline
Median & 22.1 & 29.3 \ hline
Third Quartile & 79.05 & 94.25 \ hline
Maximum & 100 & 127 \ hline
IQR Range & $79.05-12.05=67$ & $94.25-14.7=79.55$ \ hline
Range & $100-10.8=89.2$ & $127-10.9=116.1$ \ hline
end{tabular} \\
Observation of 100 bushels for sunny trees and 127 bushels for shady trees are outlier as they lies at an abnormal distance from other values in given data set\\
textbf{(b)} Below it can be observed that both data sets are distributed asymmetrically therefore textcolor{blue}{it is not appropriate} to summarize data with a mean and standard deviation.
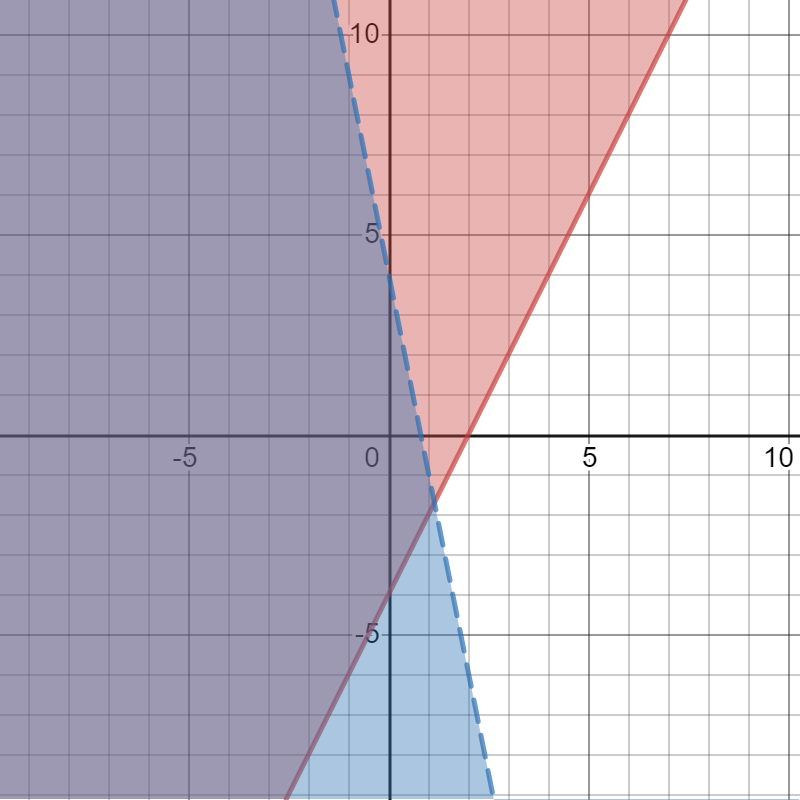
$text{(a)} y>-x+2 text{ Graph} 3$
$text{(a)} y<2x-3 text{ Graph} 1$
$text{(a)} ygedfrac{1}{2} x text{ Graph} 4$
$text{(a)} yle-dfrac{2}{3} x+2 text{ Graph} 2$
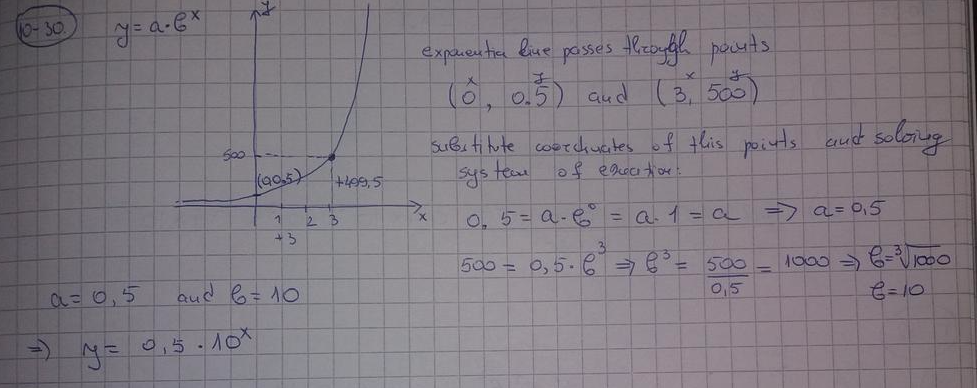
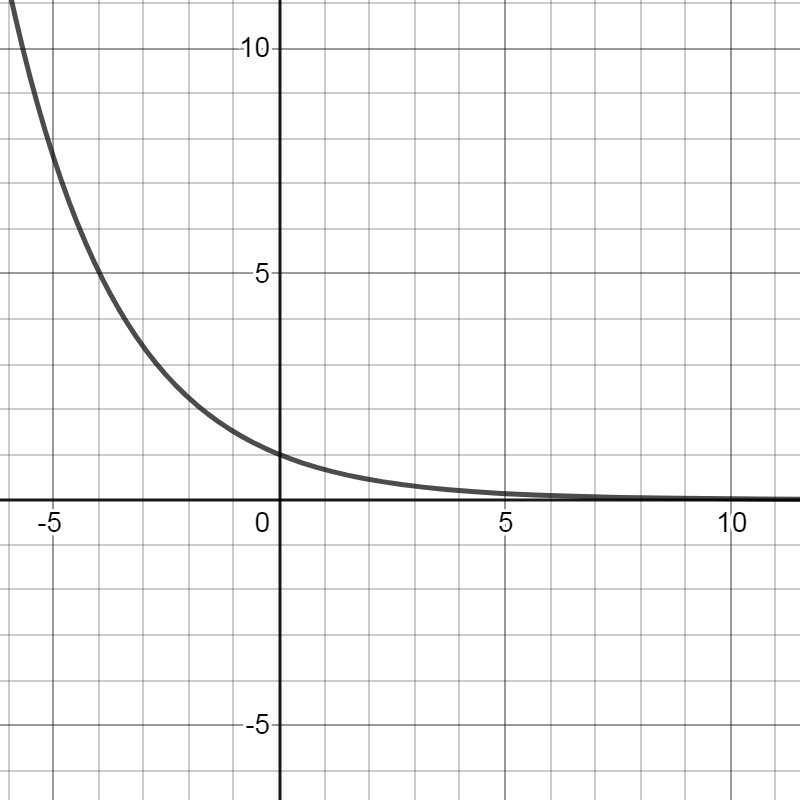
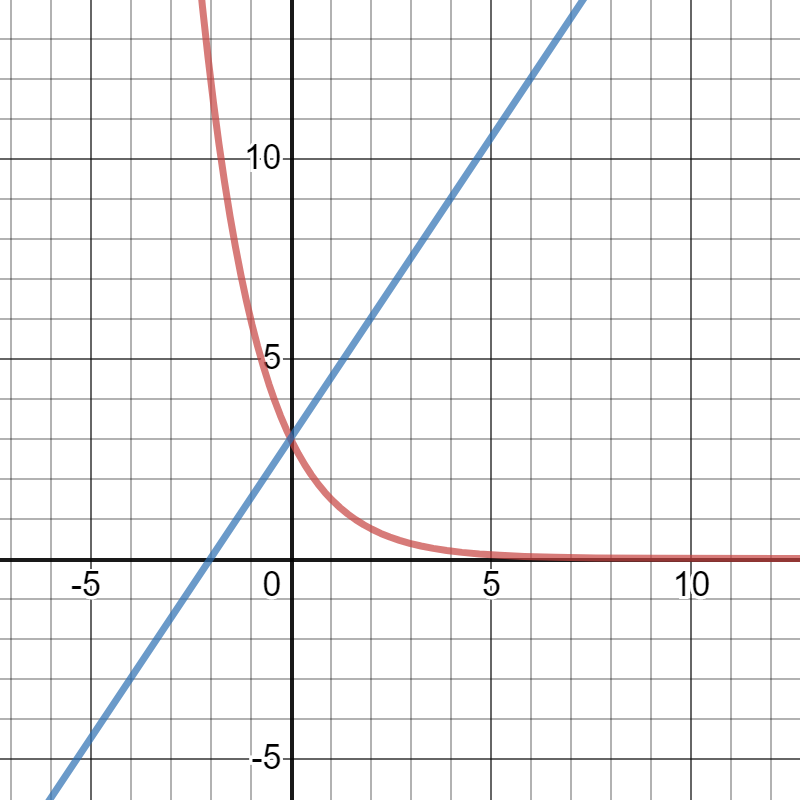
the point $(10,12)$ is on the graph.
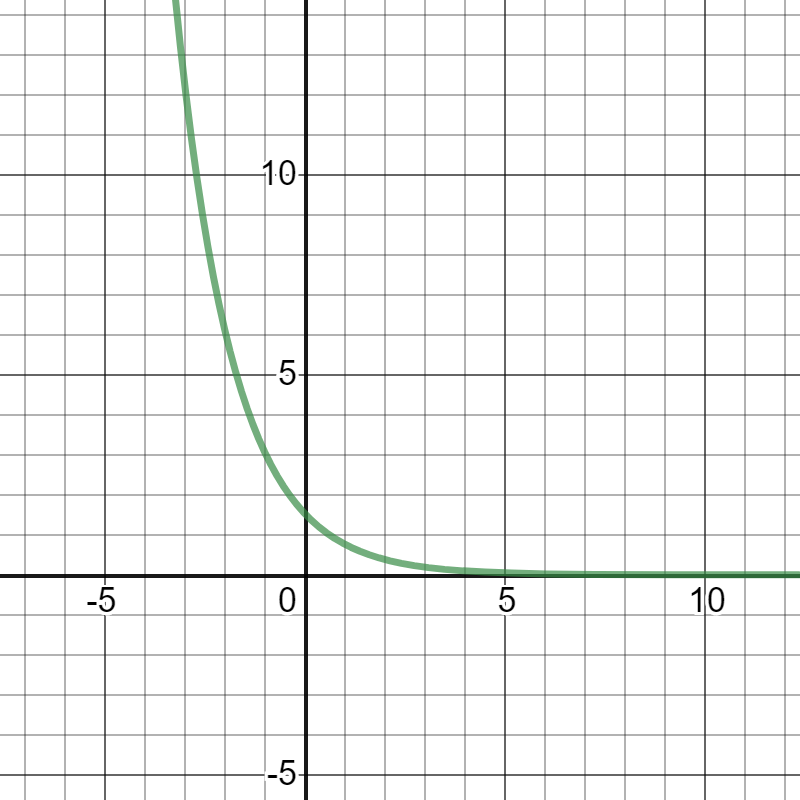
If $x=-5$, the output is $left(dfrac{1}{4} right)^{-5}=1024$,
so, the point $(-5, 1024)$ is on the graph.
On the following picture, there is graphed
given piece-wise function.
Distance Marisol waked is $2t$ wher $t$ is time.
Distance Mimi waked is $3(t-1)$ wher $t$ is time.
They arrival the mall at the same time, so:
$$
2t=3(t-1) 2t=3t-3
$$
Isolate the variables on the left side as follows:
$$
3t-2t=3 t=3
$$
Total distance is represented as follows:
$$
2t=2cdot3=6text{ miles}
$$
text{color{#4257b2}$6$ miles}
$$
A function $f(x)$ which represents the total cost of socks for
$x$ persons is the following:
$$
f(x)=10x+5.95
$$
On the following picture, there is graphed previous function.
A function $g(x)$ which represents the total cost of socks for
$x$ persons is the following:
$$
g(x)=22x+6.5
$$
On the following picture, there is graphed previous function.

In order to represent the total cost of headbands and a pair of socks,
we need just to add those functions and get function $h(x)$ which is:
$$
h(x)=f(x)+g(x)=10x+5.95+22x+6.5=32x+12.45
$$
On the following picture, there is graphed previous function.
We will substitute $400$ for $h(x)$ in the previous equation and solve it for $x$ and get:
$$
400=32x+12.45
$$
$$
32x=387.55
$$
$$
x=12.11
$$
So, about $13$ people at least have to order socks and headbands.
If the shipping and handling is free, the conclusion is that the graph of $f(x)+g(x)$ will be translated $12.45$ units down.
d) $13$ people; e) It will be translated $12.45$ units down
If $s(t)$ is the amount of money in account after $t$ months,
an equation for calculating $s(t)$ will be the following:
$$
s(t)=20000(1.002)^t
$$
#### (b)
If $w(t)$ is the amount of money in account after $t$ months,
an equation for calculating $W(t)$ will be the following:
$$
w(t)=3500(1.002)^t
$$
#### (c)
In order to keep track of the total amount of money,
Lauri just need add those equations from from parts a) and b)
and get new equation for calculating $T(t)$:
$$
T(t)=23500(1.002)^t
$$
In order to calculate how long time is needed until Lauri can begin her travels, we will substitute $35000$ for $T(t)$ in the previous equation and solve it for $t$:
$$
35000=23500(1.002)^t
$$
$$
1.489=(1.002)^t
$$
$$
t=199.25
$$
So, after about $200$ months, Lauri can begin her travels.
Required equation would be the following:
$$
C(t)=3000t+3500
$$
#### (b)
Required equation would be the following:
$$
T(t)=2500t+5000
$$
#### (c)
An equation for the total amount of money Lauri will have left after $t$
months of traveling will be the following:
$$
C(t)+T(t)=5500+8500
$$
#### (d)
We will right side from previous equation make equal to $35000$
and solve equation for $t$.
$$
35000=5500t+8500
$$
$$
26500=5500t
$$
$$
t=4.82
$$
So, it will take about $4$ months before Lauri spend all her savings.
c) $C(t)+T(t)$; d) About $4$ months
Transformation $f(x)+1$ means that the graph of $f(x)$
will be translated $1$ unit up across the $y$-axis.
#### (b)
Transformation $f(x)-2$ means that the graph of $f(x)$ will be
translated $2$ units down across the $y$-axis.
Here, the conclusion is that the Team $1$ is working
the best because of the range is smaller than a range
at the Team $2$ and means and medians are close
to each other.
#### (b)
The conclusion is that the Team $1$ had a smaller
standard deviation.
The absolute value of the difference of the width and $10$ cm (since this can be a negative difference) that are greater than 0.13 cm are rejected so we write:
$$
|w-10|> 0.13
$$
Replace the inequality symbol with $=$ so we have the equation:
$$
| w-10|=0.13
$$
Since the right side is positive, then there are two solutions. We write and solve the two equations:
$$
begin{align*}
w-10&=-0.13 & w-10&=0.13\
w&=9.87 & w&=10.13
end{align*}
$$
Hence, the number line will be divided into 3 regions:
$$
w< 9.87, 9.87<w10.13
$$
For each region, assign a test point. If the test point satisfies the inequality, the region it belongs to is a solution.
For $w}0.13\
10&> 0.13hspace{5mm}checkmark
end{align*}
$$
For $9.87<w}0.13\
0¬{>}0.13
end{align*}
$$
For $w>10.13$, I used $w=11$:
$$
begin{align*}
|11-10|&stackrel{?}{>}0.13\
1&> 0.13hspace{5mm}checkmark
end{align*}
$$
So, the solution of the inequality is:
$$
color{#c34632}w10.13
$$
So, $text{color{#c34632}parts with widths that are less than 9.87 cm or greater then 10.13 cm are rejected.}$
Part width is $10$ cm
Allowable error is $0.13$ cm
Maximum width allowable with error percentage is represented by:
$$
10+0.13=10.13text{ cm}
$$
Minimum width allowable with error percentage is represented by:
$$
10-0.13=9.87text{ cm}
$$
Any parts with width between $10.13$ cm and $9.87$ cm
is accepted. $xge9.87$ cm and $xle10.13$
Any parts with width more than $10.13$ cm is rejected. $xge10.13$
Any parts with width less than $9.87$ cm is rejected. $xle9.87$
text{color{#4257b2}$xge10.13$ and $xle9.87$}
$$
are on the following picture: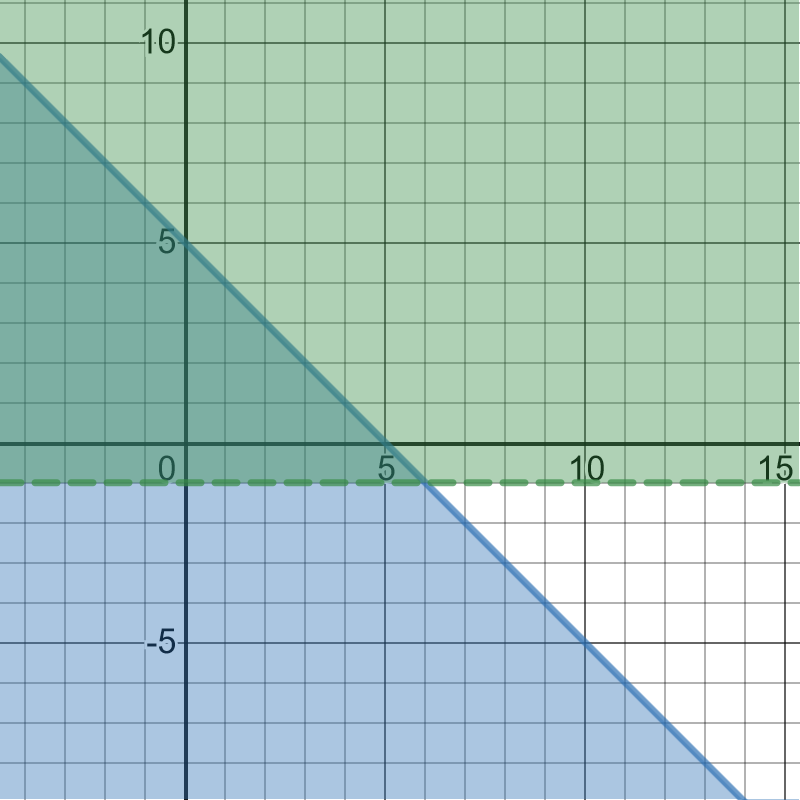
$because$ The triangles are similar $therefore$ $IJ=2 GH$=
$$
IJ=3x+14 GH=4x-3
$$
$$
3x+14=2(4x-3) 3x+14=(2cdot4x)-(2cdot3) 3x+14=8x-6
$$
Isolate the variables on the left side as follows:
$$
3x-8x=-6-14 -5x=-20 5x=20
$$
Divide both of sides by $5$ as follows:
$$
x=dfrac{20}{5} x=4
$$
Substitute value of $x=4$ as follows:
$$
IJ=3x+14=(3cdot4)+14=12+14=26 IJ=26
$$
$$
GH=4x-3=(4cdot4)-3=16-3=13 GH=13
$$
text{color{#4257b2}Large $GH=13$}
$$
$$
color{#4257b2}text{(a)} 9(x-4)=81
$$
Divide both of sides by $9$ as follows:
$$
x-4=dfrac{81}{9} x-4=9
$$
Add both of sides by $4$ as follows:
$$
x=9+4 x=13
$$
$text{color{#4257b2}Check:}$ Substitute the value of $x=13$ in the equation as follows:
$$
9(13-4)=81 9cdot9=81 81=81
$$
Since the left side is equal the right side, so the answer is correct.
$$
color{#4257b2}text{(b)} |x-6|=2
$$
Equal $x-6=2$ as follows:
$$
x=2+6 x=8
$$
Equal $-x+6=2$ as follows:
$$
-x=2-6 -x=-4 x=4
$$
The values of $x$ are equal
$$
x=8 text{ when} x-6ge0 xge6
$$
$$
x=4 text{ when} x-6<0 x<6
$$
$text{color{#4257b2}Check:}$ Substitute the value of $x=8, x=4$ in the equation as follows:
$$
|8-6|=2 |2|=2 2=2
$$
$$
|4-6|=2 |-2|=2 2=2
$$
Since the left side is equal the right side, so the answer is correct.
color{#4257b2}text{(c)} dfrac{1}{x}+5=dfrac{16}{3}
$$
Isolate the variables on the left side as follows:
$$
dfrac{1}{x}=dfrac{16}{3}-5 dfrac{1}{x}=dfrac{(16cdot1)-(5cdot3)}{3}
$$
$$
dfrac{1}{x}=dfrac{16-15}{3} dfrac{1}{x}=dfrac{1}{3}
$$
$$
dfrac{1}{x}=dfrac{1}{3} x=3
$$
$text{color{#4257b2}Check:}$ Substitute the value of $x=3$ in the equation as follows:
$$
dfrac{1}{3}+5=dfrac{16}{3} dfrac{(1cdot1)+(5cdot3)}{3}=dfrac{16}{3}
$$
$$
dfrac{1+15}{3}=dfrac{16}{3} dfrac{16}{3}=dfrac{16}{3}
$$
Since the left side is equal the right side, so the answer is correct.
color{#4257b2}text{(d)} 2|x+1|=-4
$$
$$
|x+1|=-dfrac{4}{2} |x+1|=-2
$$
Equal $x+1=-2$ as follows:
$$
x=-2-1 x=-3
$$
Equal $-x-1=-2$ as follows:
$$
-x=-2+1 -x=-1 x=1
$$
The values of $x$ are equal
$$
x=-3 text{ when} x+1ge0 xge-1
$$
$$
x=1 text{ when} x+1<0 x<-1
$$
(c) $x=3$ (d) $x=-3$ or $x=1$
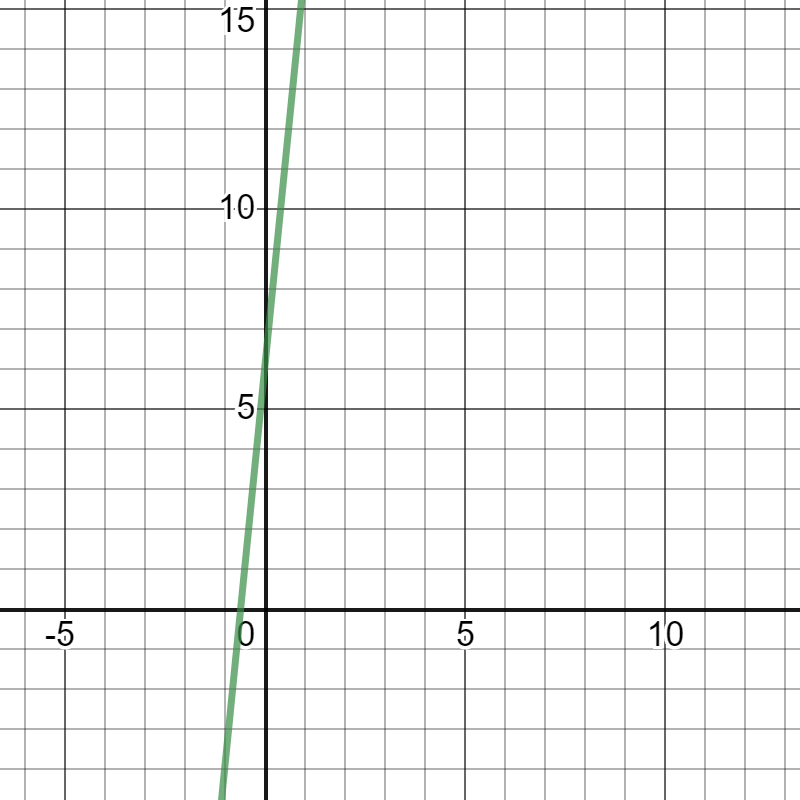
For example, let $y=3x+5$ be choosen linear function.\
Completed tables are the following.\
begin{center}
begin{tabular}{ |c|c| c| c| c| c |c| }
hline
$x$ & $y$ \
hline
$0$ & $5$ \
hline
$1$ & $8$ \
hline
$2$ & $11$ \
hline
$3$ & $14$ \
hline
end{tabular}
end{center}
begin{center}
begin{tabular}{ |c|c| c| c| c| c |c| }
hline
$x$ & $y$ \
hline
$0$ & $5$ \
hline
$2$ & $11$ \
hline
$4$ & $17$ \
hline
$6$ & $23$ \
hline
end{tabular}
end{center}
begin{center}
begin{tabular}{ |c|c| c| c| c| c |c| }
hline
$x$ & $y$ \
hline
$0$ & $5$ \
hline
$3$ & $14$ \
hline
$6$ & $23$ \
hline
$9$ & $32$ \
hline
end{tabular}
end{center}
In the first table, there are the first three values of $x$, including $0$
and the difference between the corresponding $y$-values is $3$.
In the second table, there are even values of $x$ and the difference
between the corresponding $y$-values is $6$.
In the third table, the difference between $x$-values is $3$
and the difference between the corresponding $y$-values is $9$.
#### (c)
Using results from the previous part, we can conclude that
Ashram’s statement is always true.
even values the difference is $3$ between $x$-values;
c) Ashram is correct.
Completed tables are the following:\
begin{center}
begin{tabular}{ |c|c| c| c| c| c |c| }
hline
$x$ & $y$ \
hline
$0$ & $b$ \
hline
$1$ & $m+b$ \
hline
$2$ & $2m+b$ \
hline
$3$ & $3m+b$ \
hline
end{tabular}
end{center}
begin{center}
begin{tabular}{ |c|c| c| c| c| c |c| }
hline
$x$ & $y$ \
hline
$0$ & $b$ \
hline
$2$ & $2m+b$ \
hline
$4$ & $4m+b$ \
hline
$6$ & $6m+b$ \
hline
end{tabular}
end{center}
begin{center}
begin{tabular}{ |c|c| c| c| c| c |c| }
hline
$x$ & $y$ \
hline
$0$ & $b$ \
hline
$3$ & $3m+b$ \
hline
$6$ & $6m+b$ \
hline
$9$ & $9m+b$ \
hline
end{tabular}
end{center}
In the first table, there are the first three values of $x$,
Including $0$, and the difference between corresponding
$y$-values is $m$.
In the second table, there are even values of $x$
and the difference between corresponding
$y$-values is $2m$.
In the third table, the difference between $x$-values is
$3$ and the difference between the corresponding
$y$-values is $3m$.
Using results from the previous part, we can conclude that
Ashram’s statement is always true.
begin{center}
begin{tabular}{ |c|c| c| c| c| c |c| }
hline
$x$ & $y$ \
hline
$x$ & $mx+b$ \
hline
$x+h$ & $m(x+h)+b$ \
hline
$x+2h$ & $m(x+2h)+b$ \
hline
$x+3h$ & $m(x+3h)+b$ \
hline
$x+4h$ & $m(x+4h)+b$ \
hline
end{tabular}
end{center}
and the difference between the corresponding
$y$-values is $mh$.
the difference between $y$-values is $mh$.
If $x$ value is $c$, corresponding $f(x)$-value
is $f(x)=mc+b$
If $x$ value is $d$, the corresponding $f(x)$-value
is $f(x)=md+b$
The slope of a line through those two points is:
$$
text{slope}=dfrac{md+b-(mc+b)}{d-c}=dfrac{m(d-c)}{d-c}=m
$$
So, we can notice that the slope of a line is constant.
#### (b)
Using points from the previous part,
formula for calculating slope is the following:
$$
text{slope}=dfrac{md+b-(mc+b)}{d-c}=dfrac{f(d)-f(c)}{d-c}
$$
#### (c)
$f(c)$ and $f(d)$ are values of the given function $f(x)$
in points $c$ and $d$.
#### (d)
We can notice that the slope is constant, we get:
$$
text{slope}=dfrac{f(d)-f(c)}{d-c}=dfrac{md+b-(mc+b)}{d-c}=m
$$
c) They are values of $f(x)$ in points $x$ and $d$;
d) slope$=m$
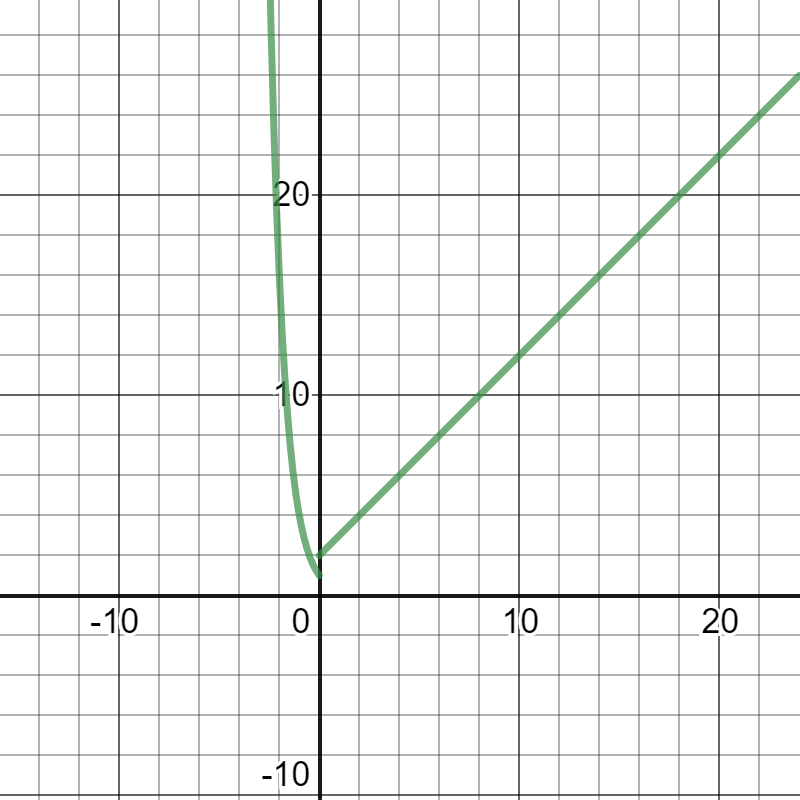
For example, let $y=5cdot4^x$ be choosen exponential function completed tables are following:\
begin{center}
begin{tabular}{ |c|c| c| c| c| c |c| }
hline
$x$ & $y$ \
hline
$0$ & $5$ \
hline
$1$ & $20$ \
hline
$2$ & $80$ \
hline
$3$ & $480$ \
hline
end{tabular}
end{center}
begin{center}
begin{tabular}{ |c|c| c| c| c| c |c| }
hline
$x$ & $y$ \
hline
$0$ & $5$ \
hline
$2$ & $80$ \
hline
$4$ & $1280$ \
hline
$6$ & $20480$ \
hline
end{tabular}
end{center}
begin{center}
begin{tabular}{ |c|c| c| c| c| c |c| }
hline
$x$ & $y$ \
hline
$0$ & $5$ \
hline
$3$ & $480$ \
hline
$6$ & $20480$ \
hline
$9$ & $1310720$ \
hline
end{tabular}
end{center}
In the first table, there are the first three values of $x$,
including $0$, and each following value of $y$ is $4$
times greater than the previous value.
In the second table, there are even values of $x$
and each following value of $y$ is $16$ times
greater than the previous value.
The conclusion is that exponential functions grow by
equal factors over equal intervals.
Completed tables are following:\
begin{center}
begin{tabular}{ |c|c| c| c| c| c |c| }
hline
$x$ & $y$ \
hline
$0$ & $a$ \
hline
$1$ & $ab^1$ \
hline
$2$ & $ab^2$ \
hline
$3$ & $ab^3$ \
hline
end{tabular}
end{center}
begin{center}
begin{tabular}{ |c|c| c| c| c| c |c| }
hline
$x$ & $y$ \
hline
$0$ & $a$ \
hline
$2$ & $ab^2$ \
hline
$4$ & $ab^4$ \
hline
$6$ & $ab^6$ \
hline
end{tabular}
end{center}
begin{center}
begin{tabular}{ |c|c| c| c| c| c |c| }
hline
$x$ & $y$ \
hline
$0$ & $a$ \
hline
$3$ & $ab^3$ \
hline
$6$ & $ab^6$ \
hline
$9$ & $ab^9$ \
hline
end{tabular}
end{center}
In the first table, there are first three values of $x$,
including $0$, and each following value of $y$
is $b$ times greater than previous.
In the second table there are even values of $x$
and each following value of $y$ is $b^2$
times greater than previous value.
In the third table, the difference between $x$-vales
is $3$ and each following value of $y$ is $b^3$
times greater than previous value.
#### (c)
The conclusion is that exponential functions grow
by equal factors over equal intervals.
begin{center}
begin{tabular}{ |c|c| c| c| c| c |c| }
hline
$x$ & $y$ \
hline
$x$ & $ab^x$ \
hline
$x+h$ & $ab^{x+h}$ \
hline
$x+2h$ & $ab^{x+2h}$ \
hline
$x+3h$ & $ab^{x+3h}$ \
hline
$x+4h$ & $ab^{x+4h}$ \
hline
end{tabular}
end{center}
Here, the difference between $x$-values is $h$ and each following value of $y$\
is $b^h$ times greater than the previous value.\
In this situation, $72$ represent translation of graph of function
$f(x)$ $72$ units up.
#### (b)
Here, we need to substitute $68$ for $f(x)$
and solve equation for $t$.
We can notice that the graph of $y$ is translated $1$ unit down, so, the corresponding graph is $3$.
#### (b)
We can notice that graph of $y$ is translated $3$ units up, so, corresponding graph is $1$.
#### (c)
We can notice that graph of $y$ is translated $2$ units up, so, corresponding graph is $2$.
On the following pictures, there are graphed
a combination of histogram and boxplots.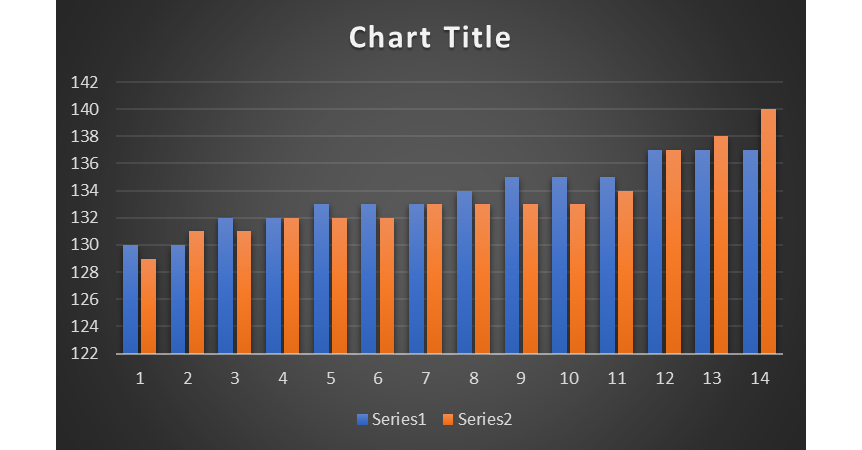
#### (b)
The conclusion is that Dancan should recommend chip $W$ because its standard deviation is less than the standard deviation for chip $Z$.
b) Chip $W$
The new expression is the following:
$$
3x-3-1=3x-4
$$
Here we have the translation for $1$ unit down.
#### (b)
The new expression is the following:
$$
3x-3+8=3x+5
$$
Here we have the transformation for $8$ units up.
The new expression is the following:
$$
3x-3-22=3x-25
$$
Here we have the transformation for $22$ units down.
#### (d)
The new expression is the following:
$$
3x-3+3=3x
$$
Here we have the transformation
for $3$ units up.
$$
begin{align*}
7x-2&< 3+2x\
7x-2x&< 3+2\
5x&<5\
x&<1
end{align*}
$$
$$
begin{align*}
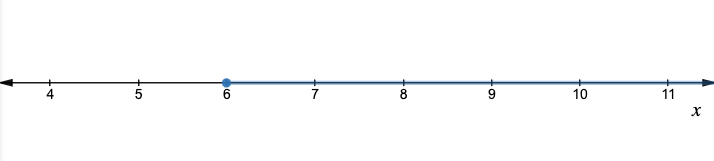
dfrac{1}{3}x &ge 2\
x &ge 2 cdot 3\
x &ge 6
end{align*}
$$
$$
begin{align*}
3(2m-1)- 5m &le -1\
6m -3 -5m &le -1\
m le -1+3\
m&le 2
end{align*}
$$
$$
begin{align*}
2k + 3&le 2k+1\
3&le 1~~~~cross
end{align*}
$$
This is impossible. Thus, there is no solution to inequality.
b. $xge 6$
c. $m le 2$
d. No solution
Here, two pairs of sides of those triangles are equal in the length
and the included angles are equal in measurement, so,
according to the $SAS$ condition, those triangles are congruent.
#### (b)
Here, three pairs of sides of those triangles are equal in the length,
so, according to the $SSS$ condition, those triangles are congruent.
Here, marked equal in the length sides and angles which are equal in measurement,
do not correspond either of congruent conditions, so, those triangles are not congruent.
#### (d)
Here, two sides and a non-included angle are equal, so, according to the $SSA$ condition,
those triangles are congruent.
The probability of selecting a yellow marble is the following:
$$
p=dfrac{y}{R+G+B+y}
$$
#### (b)
The probability of selecting a blue or green marble is the following:
$$
p=dfrac{B+G}{R+G+B+y}
$$
#### (c)
The probability of selecting a purple marble is $0$ because there are no purple marbles in the bag.
