
All Solutions
Page 193: Questions
begin{center}
begin{tabular}{|c||c|||}
hline
Distance from wall (inches)& Width of field of view (inches) \
hlinehline
$144$&$20.7$ \
hline
$132$&$19.6$ \
hline
$120$&$17.3$ \
hline
$108$&$16.2$ \
hline
$96$&$14.8$ \
hline
$84$&$13.1$ \
hline
$72$&$11.4$ \
hline
$60$&$9.3$ \
hline
end{tabular}
end{center}
vspace{ 3 mm}
{color{red}(b)} plotting the data: the association between the width of the field of view and distance from the wall is positive linear association.\
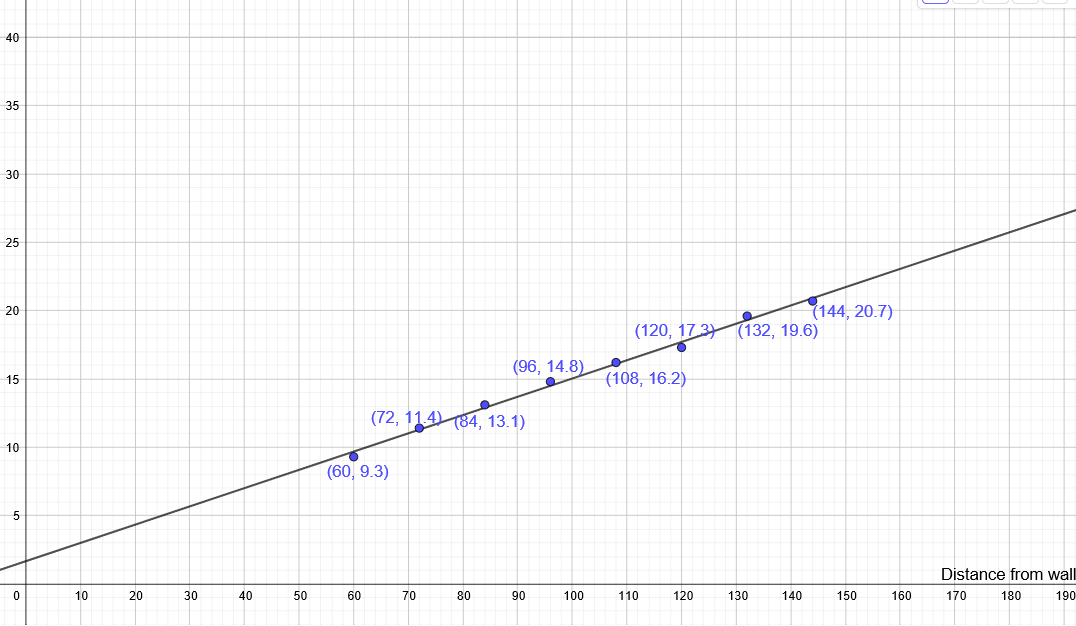
using the points $(72, 11.4)$ and $(108, 16.2)$
Subtitute with $Rightarrow y_2 = 16.2, y_1 = 11.4, x_2= 108$ and $x_1=72$ in the form of slope $color{#c34632}m = dfrac{y_2 – y_1}{x_2 – x_1}$
$Rightarrow m= dfrac{108-72}{16.2-11.4} = dfrac{36}{4.8} Rightarrow boxed{m=dfrac{2}{15}}$
Using the point $color{#4257b2} (72, 11.4)$ to get the $(b)$ by substituting with the value of slope in the equation $y= mx+b$ $Rightarrow 11.4= – dfrac{2}{15}(72)+b Rightarrow 11.4= 9.6+b$
Subtract $color{#4257b2} (9.6)$ from both sides $Rightarrow b= 11.4- 9.6 =1.8$
From gragh the $y$ intercept is around $2$
(b) positive linear association
(c) $m= dfrac{2}{15}$, $y$ intercept $=1.8$
$$
1.7+0.15(1800)=271.7
$$
So, Robbie’s field of view will be $271.7$ in at the south end of the field.
Now, we will substitute $6120$ in for $x$ and get the following:
$$
1.7+0.15cdot6120=919.7
$$
So, Robbie’s field of view will be $919.7$ in at the north end of the field.
Here, you can draw your own football field and use the previous task in order to solve it.
But, let’s imagine that we have already graphed some football field with some dimensions, and using those dimensions, for example, we get the following area of the field of view:
$$
0.8(6.8+23)cdot115=2741.6
$$
So, $textbf{the area is $2741.6$ square yards.}$
#### (b)
The percent of the field which Robbie be able to see would be the following:
$$
dfrac{2741.6}{115cdot52}=0.4584
$$
So, $textbf{Robbie would be able to see $45.84%$ of the field}$.
In this case, Robbie will see $22.9$ yards or:
$$
dfrac{22.9}{52}=0.44
$$
Or, $44.04%$ of the field.
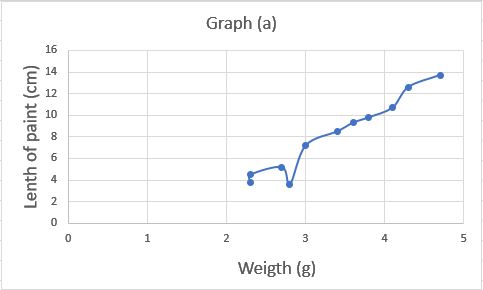
The point $2.3$ is an outlier, which means that the pencil having length of paint approximately 2.3 cm is not following the trend.
$textbf{(b)}$ In Sam’s classroom, there can be some fancy pencil’s with different materials of paint on it which puts some extra weight on it, which are related to a particular special brand and so that these are creating the outlier. Moreover, the length of these special pencil is close to 2.3 cm.
$textbf{(c)}$
Given that the equation of the line of best fit is $w=1.4+0.25l$ where $w$ is the weight of the pencil in grams and l is the length of paint on the pencil.
Slope in the above context represent the change in the weight of pencil per cm change in the length of the paint on the pencil.
(d) For the weight of the pencil with length of paint $11.5$ cm, we need to plug the value $l=11.5$ into the given equation of line of best fit.
$$
begin{align*}
w&=1.4+0.25l\
w&=1.4+0.25(11.5)\
w&=1.4+2.875\
w&=4.275 text{grams}
end{align*}
$$
(e) $y$-intercept in this context represents the weight of the pencil with the length of paint on it equal to zero.
$textbf{(b)}$ In Sam’s classroom, there can be some fancy pencil’s with different materials of paint on it which puts some extra weight on it, which are related to a particular special brand and so that these are creating the outlier.
$textbf{(c)}$Slope in the above context represent the change in the weight of pencil per cm change in the length of the paint on the pencil.
$textbf{(d)}$ 4.275 grams
$textbf{(e)}$ $y$-intercept in this context represents the weight of the pencil with the length of paint on it equal to zero.
{color{#4257b2}text{a)}}
$$
$$
begin{align*}
left(3xy^3right)left(-2yright)& {=}quad : -3xy^3cdot :2ytag{Remove parentheses}\
&=-6xy^3y tag{Multiply the numbers} \
&=-6x:y^{3+1} \
&={color{#c34632}-6xy^4}
end{align*}
$$
{color{#4257b2}text{b)}}
$$
$$
begin{align*}
left(x^3y^2right)left(x^{-2}y^{-2}right)& {=}quad : x^3y^2x^{-2}y^{-2}tag{Remove parentheses}\
&=:x^{3-2}y^{-2}y^2 \
&=xy^0=1cdot 😡 \
&={color{#c34632}x}
end{align*}
$$
$$
color{#c34632} text{ }mathrm{Apply:exponent:rule}:quad :a^bcdot :a^c=a^{b+c}
$$
$$
text{ }
$$
$$
text{ }
$$
{color{#4257b2}text{c)}}
$$
$$
begin{align*}
frac{6x^{-2}}{3x^2}& {=}quad : frac{2x^{-2}}{x^2}tag{Divide the numbers}\
&frac{x^{-2}}{x^2}=frac{1}{x^{2-left(-2right)}}=frac{1}{x^4} tag{Simplify} \
&={color{#c34632}frac{2}{x^4}}
end{align*}
$$
$$
color{#c34632} text{ }mathrm{Apply:exponent:rule}:quad frac{x^a}{x^b}:=:frac{1}{x^{b-a}}
$$
$$
text{ }
$$
$$
text{ }
$$
{color{#4257b2}text{d)}}
$$
$$
begin{align*}
left(-2xright)^{-3}& {=}quad :frac{1}{left(-2xright)^3}\
&=frac{1}{-left(2xright)^3} \
&=frac{1}{-2^3x^3}\
&={color{#c34632}-frac{1}{8x^3}}
end{align*}
$$
$$
color{#c34632}text{ }mathrm{Apply:exponent:rule}:quad left(-aright)^n=-a^n,:mathrm{if:}nmathrm{:is:odd}
$$
$$
color{#c34632} text{ }mathrm{Apply:exponent:rule}:quad left(acdot :bright)^n=a^nb^n
$$
$$
text{ }
$$
color{#4257b2} text{ a) }-6xy^4
$$
$$
color{#4257b2} text{ b) }x
$$
$$
color{#4257b2}text{ c) }frac{2}{x^4}
$$
$$
color{#4257b2} text{ d) }-frac{1}{8x^3}
$$
$$
text{ }
$$
$$
text{ }
$$
We can related the length of the sides of a right angled triangle with the pythagoras equation.
$$
text{hypotenuse}=sqrt{text{base}^2+text{height}^2}
$$
In the given context, we need to find the distance between the ball carrier and the defender which is making the base of the said triangle. This can be proceeded as shown below
$$
begin{align*}
text{hypotenuse}&=sqrt{text{base}^2+text{height}^2}\
45&=sqrt{text{base}^2+ 40^2}tag{square both side}\
45^2&=text{base}^2+ 40^2tag{subtract $40^2$ from each side}\
45^2-40^2&=text{base}^2 tag {take square root on each side}\
sqrt{425}&=text{base}\
text{base}&=20.615text{ yards}
end{align*}
$$
Therefore, the distance between the ball carrier and the defender is 21.615 yards.
$$
begin{align*}
text{time}&=dfrac{text{Distance}}{text{Speed}}\
text{time}&=dfrac{144 text{ miles}}{ dfrac{75text{ miles}}{1 text{ hour}}}\
&=(dfrac{144 text{ miles}}{75text{ miles}})cdot (dfrac{1 text{ hour}}{1})\
&=1.92 text{hour}
end{align*}
$$
$bullet$ Now, given that the distance via scenic route is 122 miles and average freeway speed is 65 miles per hour. Time taken to reach San Diego via scenic route can be found out as shown below
$$
begin{align*}
text{time}&=dfrac{text{Distance}}{text{Speed}}\
text{time}&=dfrac{122 text{ miles}}{ dfrac{65text{ miles}}{1 text{ hour}}}\
&=(dfrac{122 text{ miles}}{65text{ miles}})cdot (dfrac{1 text{ hour}}{1})\
&=1.87 text{hour}
end{align*}
$$
We can see that the time taken to reach San Diego via scenic route along the coast is lesser than the time to reach via freeway. Hence, scenic route along the coast is better route.
$$
begin{align*}
200x+50&=8000tag{Divide each side by 10 for a simpler equation}\
dfrac{200x}{10}+ dfrac{50}{10}&=dfrac{8000}{10}\
20x+5&=800tag{subtract 5 from each side}\
20x+5-5&=800-5\
20x&=795tag{divide each side by 20}\
dfrac{20x}{20}&=dfrac{795}{20}\
x&=39.75
end{align*}
$$
$textbf{(b)}$For simpler equation multiply each term by least common multiple of 4x and 8, which is 8x
$$
begin{align*}
dfrac{21}{4x}+ dfrac{9}{8}&=2tag{multiple each term by $8x$}\
dfrac{21}{4x}cdot 8x+ dfrac{9}{8}cdot 8x&=2cdot 8x\
42+9x&=16x tag{subtract $9x$ from each side}\
42+9x-9x &=16x-9x\
42&=7xtag{divide each side by 7}\
dfrac{42}{7}&=dfrac{7x}{7}\
x&=6
end{align*}
$$
$textbf{(b)}$ $x=6$
We can find the equation by putting the given values in the table and solving for the constants.Then we can check the validity by checking for an additional point. It is satisfies then the equation is correct otherwise we can increase the degree of the equation like $f(x)=ax^2+bx+c$ and so on.
$bullet$ Solving assuming linearity.
$$
begin{align*}
f(x)&=ax+c\
(-7)&=a(2)+c tag{putting $2,-7$ from the table}\
(18)&=a(-3)+c tag{putting $2,-7$ from the table}
end{align*}
$$
Now, we have two equations in two variables, which can be solved as shown below.
$$
begin{align}
-7&=2a+c\
18&=-3a+c
end{align}
$$
Subtract equation $(2)$ from the equation $(1)$ we get
$$
begin{align*}
-7&=2a+c\
-7-18&=2a-(-3a) +c-c\
-25&=5atag{divide each side by 5}\
a&=-5
end{align*}
$$
Now, putting $a=-5$ in equation $(1)$, we get
$$
begin{align*}
-7&=2a+c\
-7&=2(-5)+ctag {add +10 each side}\
-7+10&=-10+10+c\
3&=c\
c&=3
end{align*}
$$
So, the final equation becomes
$$
boxed{f(x)=-5x+3}
$$
Now, checking our final equation for the data point $(0,3)$ for verification.
$$
begin{align*}
f(x)&=-5x+3\
(3)&=-5(0)+3\
3&=3
end{align*}
$$
We can see that our equation is valid.
Now, we can solve for outputs by putting the given inputs into this equation. The table is shown below.\\
begin{tabular}{ |p{2cm}|p{1cm}|p{1cm}|p{1cm}|p{1cm}|p{1cm}|p{1cm}|p{1cm}|p{1cm}|p{3cm}|}
hline
input(x) &2 &10&6&7&-3&0&-10&100&x \
hline
output(f(x)) &-7 &-47&-27&-32&18&3&53&-497&$f(x)=-5x+3$ \
hline
end{tabular}
$$
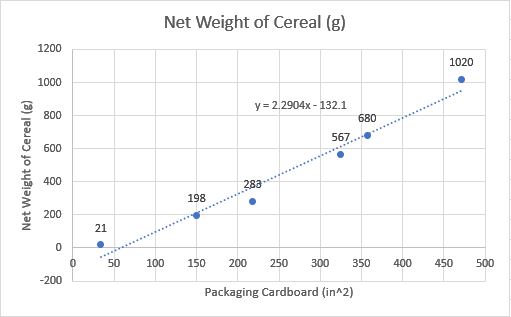
begin{align*}
y&=2.2904x-132.1\
y&=2.2904(260)-132.1\
y&=463.404
end{align*}
$$
Therefore, 260 $text{in}^2$ of cardboard packaging can hold 463.404 grams of Cereal.
260 $text{in}^2$ of cardboard packaging can hold 463.404 grams of Cereal.
We see from the graph that slope, m = $frac{triangle y}{triangle x}= 2.290$ and y-intercept,b = -132.10
Hence equation is
y=2.90x-132.10
Hence 260$in^2$ cardboard is expected to hold 463.4 g cereals.
$bullet$ $y$- intercept represents the amount of Cereal that can be packaged using 0 $text{inch}^2$ of Cardboard. Practically this should be 0 as there is no material and hence no box. But the value given by $y$-intercept is $-132.1$ grams, which doesn’t make sense.
$bullet$ $y$- intercept represents the amount of Cereal that can be packaged using 0 $text{inch}^2$ of Cardboard. Practically this should be 0 as there is no material and hence no box. But the value given by $y$-intercept is $-132.1$ which doesn’t make sense.
From the given equation in the question we can find the residual as
$$
text{residual}=355-463.4=-108.4
$$
The distance between the actual points (given data) and the line of best fit represents the residual. Hence, on the graph we can represent this distance as residual.
On the graph, the distance between the actual points (given data) and the line of best fit represents the residual.
$$
begin{align*}
y&=2.2904x-132.1\
y&=2.2904(471)-132.1\
y&=1078.7784-132.1\
y&=946.678 text{grams}
end{align*}
$$
Therefore, By the prediction of the line of best fit, 471 $text{in}^2$ of cardboard packaging can hold 946.678 grams of Cereal.
But the from the actual values from the table, 471 $text{in}^2$ of cardboard packaging can hold 1020 grams of Cereal.
Therefore, the residual is given by
$$
text{residual}=1070-946.678=123.322text{ grams}
$$
The residual is indicated on the graph attached below.
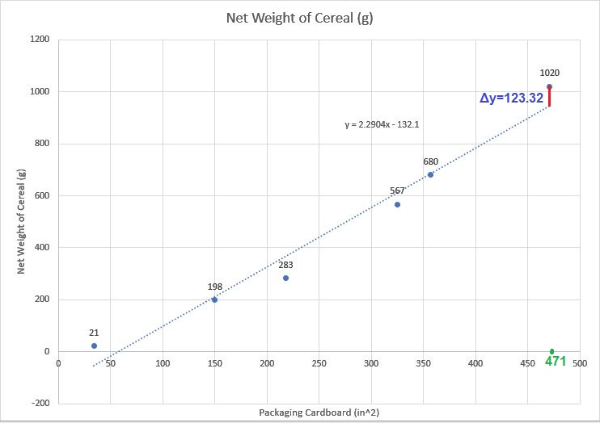
The graph is attached inside with residual indicated in blue colour.
$$
begin{align*}
y&=2.2904x-132.1\
y&=2.2904(600)-132.1\
y&=1374.24-132.1\
y&=1242.14 text{ grams}
end{align*}
$$
Therefore,it is predicted by the equation that a 600 $text{in}^2$ of cardboard packaging can hold 1242.14 grams of Cereal.
Given that we have 1005 grams of residual for the 600 $text{in}^2$ box. As we know the formula for the residual is
$$
text{residual}=text{actual}-text{predicted}
$$
So, the actual weight can be found out by putting the available values in the equation above
$$
begin{align*}
text{residual}&=text{actual}-text{predicted}\
(1005)&=text{actual}-(1242.14) tag{add 1242.14 to each side}\
1005+1242.14 &= text{actual}-1242.14+1242.14\
1005+1242.14 &= text{actual}\
text{actual}&=2247.14 text{ grams}
end{align*}
$$
$textbf{(b)}$ The reason for such large residual is that the volume of the box made by the cardboard material is increasing cubically so it can accomodate more stuff. The relation is not linear as we were assuming. The linear relation is close for small values and as we can see that the difference becomes greater with large values
$textbf{(b)}$ The reason for such large residual is that the volume of the box made by the cardboard material is increasing cubically so it can accomodate more stuff. The relation is not linear as we were assuming. The linear relation is close for small values and as we can see that the difference becomes greater with large values
A cereal with negative residual calories is better for Armen’s diet as he should lower the amount of sugar intake with fulfilling his calorie requirement.
$textbf{(b)}$The slope in this problem represents the amount of sugar in grams present in Armen’s diet per unit calorie in his diet.
A negative $y$-intercept in this context represent that if the number of calories in Armen’s diet is taken zero then the amount of sugar in his diet should be negative $(-16.9 text{ grams})$
This makes sense as a diet contains many other things than the sugar which contribute for the calorie. So even if there is not any sugar present in the diet there will be some calories already. So to obtain the 0 calories we need to put a negative value of sugar in the diet. Well, this is a hypothetical condition.
A cereal with negative residual calories is better for Armen’s diet as he should lower the amount of sugar intake with fulfilling his calorie requirement.
$textbf{(b)}$The slope in this problem represents the amount of sugar in grams present in Armen’s diet per unit calorie in his diet.
A negative $y$-intercept in this context represent that if the number of calories in Armen’s diet is taken zero then the amount of sugar in his diet should be negative $(-16.9 text{ grams})$
Residuals are the difference values between the actual values for a situation and the predicted values from the equation devised to represent the situation mathematically.
The formula for residual is given by
$$
text{Residual}=text{Actual}-text{Predicted}
$$
Lesser the value of residual, closer the prediction will be to the actual value. So, a best fit line with small magnitudes or zero magnitude of residuals represents the situation more accurately.
$$
p=150+0.041a
$$
where $p$ is the price of the home in thousands of dollars and $a$ is the area of the house in square feet.
Also, Home prices in Fancyville can be modeled using the equation
$$
p=250+0.198a
$$
In the advertisement for a 2800 square foot home was selling for $280,000. We can put the value of$p=280$as$p$is in thousands and$a=2800$ into both the equations then check which of the equation closely satisfies these values and in this manner we can predict the city.
$$
begin{align*}
p&=150+0.041a\
(280)&=150+0.041(2800)\
(280) &=150+114.8\
280&approx264.8
end{align*}
$$
So, Smallville can be the possible city as the price values are very close
$$
begin{align*}
p&=250+0.198a\
(280)&=250+0.198(2800)\
(280) &=150+554.4 \
280&ne 704.4
end{align*}
$$
So, Fancyville cannot be the possible city as there is too much difference in the prices.
$$
begin{align*}
&2times 10^3 cdot 4times 10^7 \
&=(2cdot 4)times (10^3cdot 10^7)\
&=8times 10^{(3+7)}\
&=8times 10^{10}
end{align*}
$$
$bullet$ Cadel is right about the answer and this can be explained as shown above.
$bullet$ Lauren is right about the way but her multiplication is incorrect as when we multiply the terms with the exponents then the powers get added as mentioned in the earlier part ($a^mcdot a^n=a^{m+n}$), not that each term gets multiplied like she did in her answer.
So, Cadel is correct and Lauren is incorrect
The correct answer is $8times 10^{10}$
$textbf{(a)}$
$$
begin{align*}
&f(x)-2\
&=(16)-2\
&=14
end{align*}
$$
$textbf{(b)}$ We can not calculate $f(2x)$ from the given information as it is not sufficient. The catch here is that $f(2x)ne 2cdot f(x)$
$textbf{(c)}$
$$
begin{align*}
&3f(x)+2\
&=3cdot (16)+2\
&=48+2\
&=50
end{align*}
$$
$textbf{(b)}$ We can not calculate $f(2x)$ from the given information as it is not sufficient. The catch here is that $f(2x)ne 2cdot f(x)$
$textbf{(c)}$ 50
$Rightarrow$
$$
begin{align*} x+x+17&=41 \
2x+17&=41
end{align*}
$$
Therefore, the situation can be represented by the equation $2x+17=41$ where, $x$ represents the age of blue van in years.
$$
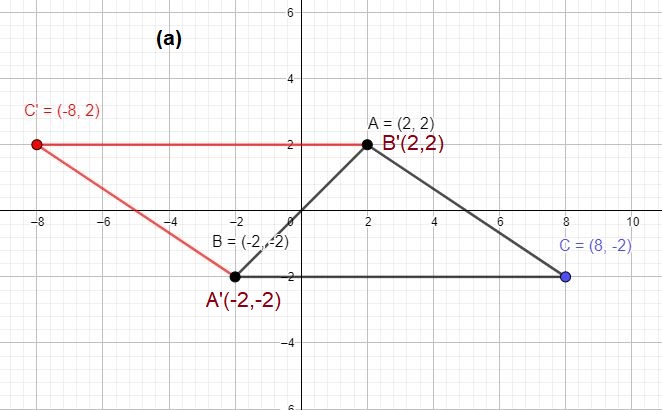
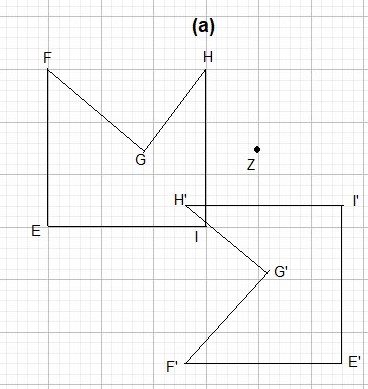
text{A}(2,2) rightarrow A'(-2,-2)
$$
$$
text{B}(-2,-2) rightarrow B'(2,2)
$$
$$
text{C}(8,-2) rightarrow C'(-8,2)
$$
The possible transformation for this is rotation with centre as mid-point of side AB.
The shape, size and area is preserved in this transformation.
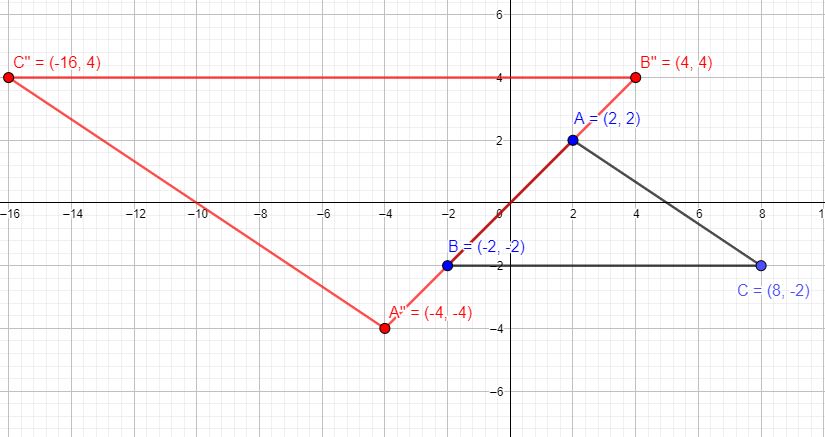
$$
text{A}(2,2) rightarrow A”(-4,-4)
$$
$$
text{B}(-2,-2) rightarrow B”(4,4)
$$
$$
text{C}(8,-2) rightarrow C”(-16,4)
$$
The possible transformation for this is rotation with centre as mid-point of side AB and multiplication with a factor 2.
No, this is not a type of rigid transformation.
Only the shape is preserved in this transformation but size and area are different
$$
text{A}(2,2) rightarrow A'(-2,-2)
$$
$$
text{B}(-2,-2) rightarrow B'(2,2)
$$
$$
text{C}(8,-2) rightarrow C'(-8,2)
$$
$textbf{(b)}$ By applying the transformation $(x,y) rightarrow (-2x,-2y)$ on $Delta$ABC the resultant coordinates are shown below
$$
text{A}(2,2) rightarrow A”(-4,-4)
$$
$$
text{B}(-2,-2) rightarrow B”(4,4)
$$
$$
text{C}(8,-2) rightarrow C”(-16,4)
$$
For the graph and the explanation see inside.
$$
a(b pm c)=ab pm ac
$$
$$
5x(x-6)
$$
$$
5x cdot x-5x cdot 6=5x^2-30x
$$
$$
-9y(6-3y)
$$
$$
-9y cdot 6+9y cdot 3y=-54y+27y^2=27y^2-54y
$$
We can find the ratio for a number of people, let’s say for all the students in the classroom. Then we take average of this ratio so that the measuring and human error is minimised and we get a very close value to the actual ratio.
The assumption is that we are considering the ratio of the height to the length of the ulna bone of the early humanoid is close to the ratio of the height to the length of the ulna bone of the recent humans.
After we collected the data, we got the best fit line. The residual will be the difference between the actual and predicted value.
#### (b)
On the following picture, there are drawn all lines which are required.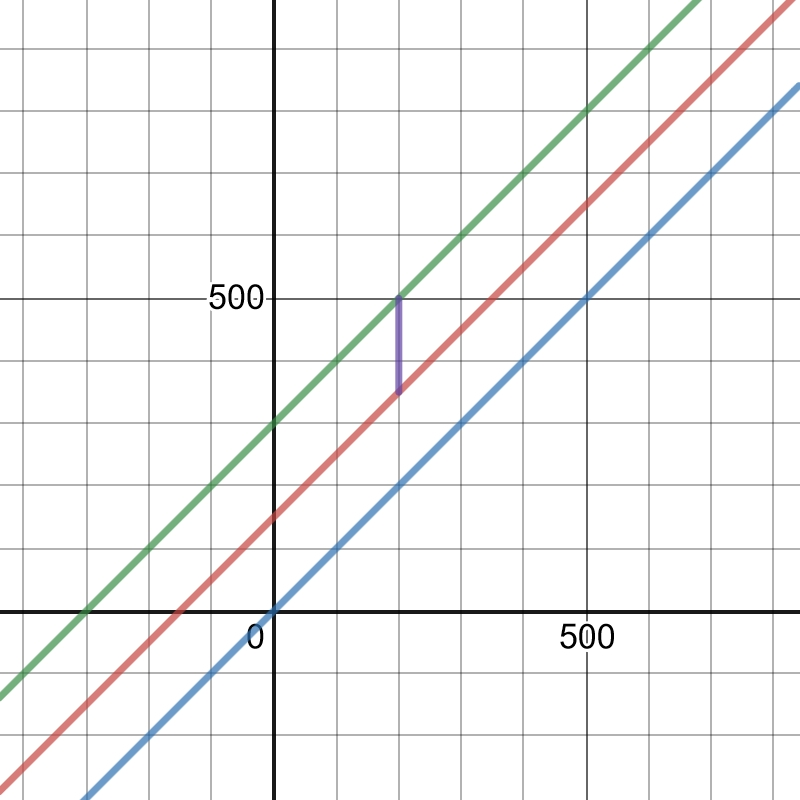
For example, the lowest value can be $150$ and the highest value can be $174.5$ cm.
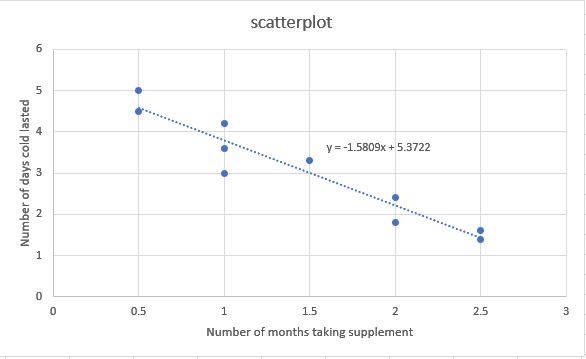
$$
begin{align*}
y&=-1.581x+5.372\
y&=-1.581(1.5)+5.372\
y&=3.0005\
y&approx 3 text{ days}
end{align*}
$$
$textbf{(c)}$ The actual value from the table is, cold lasted 3.3 days for a patient taking supplement for 1.5 months. So the residual is given by
$$
begin{align*}
text{residual}&=text{actual}-text{predicted}\
text{residual}&=3.3-3\
text{residual}&=0.3
end{align*}
$$
The residual for this case is 0.3 days. The positive value of residual here signifies that actually the cold last for 0.3 days longer than the predicted value by the equation of line of best fit.
$textbf{(d)}$ The $y$-intercept in this context represents the number of days cold lasts for a patient who have not taken the supplement (taken for 0 month)
$textbf{(b)}$ 3 days
$textbf{(c)}$ 0.3 days
$textbf{(d)}$ The $y$-intercept in this context represents the number of days cold lasts for a patient who have not taken the supplement (taken for 0 month).
$$
y-y_1=mcdot (x-x_1)
$$
So, the equation of a line of slope $-dfrac{2}{3}$ passing through a point $(-12,16)$ is given by
$$
begin{align*}
y-(16)&=-dfrac{2}{3}cdot (x-(-12))\
y-16&=-dfrac{2}{3}cdot x -dfrac{2}{3}cdot 12\
y-16&=-dfrac{2}{3}cdot x-8\
y&=-dfrac{2}{3}cdot x-8+16\
&boxed{y=-dfrac{2}{3}cdot x+8}
end{align*}
$$
$textbf{(b)}$ The $x$-intercept is the value of the variable $x$ when variable $y=0$, so we can find the $x$-intercept by plugging $y=0$ into the equation of line derived above.
$$
begin{align*}
y&=-dfrac{2}{3}cdot x+8\
0&=-dfrac{2}{3}cdot x+8\
-8&=-dfrac{2}{3}cdot x\
-dfrac{3}{2} cdot -8&=-dfrac{3}{2}-dfrac{2}{3}cdot x\
-3cdot -4&=1cdot x\
12&=x\
&boxed{x=12}
end{align*}
$$
$textbf{(b)}$ $x=12$
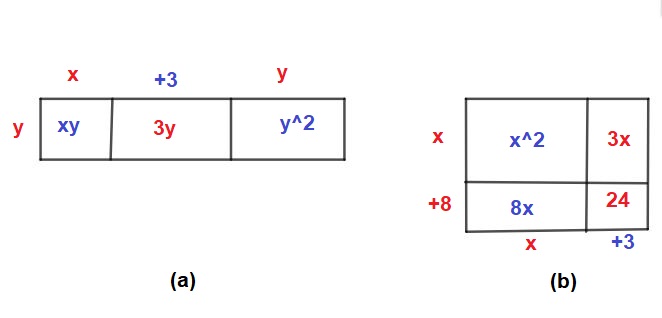
$$
begin{align*}
text{Area}&=xy+3y+y^2\
&=y^2+xy+3y
end{align*}
$$
$bullet$ Area as product of the dimensions
$$
begin{align*}
text{Area}&=(y)cdot(x+3+y)\
&=ycdot x+ycdot 3+ycdot x y\
&=xy+3y+y^2\
&=y^2+xy+3y
end{align*}
$$
We can see that Area from both the cases are the same hence, we can write it as shown below.
$$
text{Area}=(y)cdot(x+3+y)=y^2+xy+3y
$$
$$
textbf{(b)}
$$
$bullet$ Area as sum of its parts
$$
begin{align*}
text{Area}&=x^2+3x+8x+24\
&=x^2+11x+24
end{align*}
$$
$bullet$ Area as product of the dimensions
$$
begin{align*}
text{Area}&=(x+8)cdot(x+3)\
&=xcdot(x+3)+8cdot (x+3)\
&=x^2+3x +8x+24\
&=x^2+11x+24
end{align*}
$$
We can see that Area from both the cases are the same hence, we can write it as shown below.
$$
text{Area}=(x+8)cdot(x+3)=x^2+11x+24
$$
$textbf{(b)}$ $text{Area}=(x+8)cdot(x+3)=x^2+11x+24$
$$
f(x)=3-|x|
$$
$$
g(x)=3^x+5
$$
Now plugging in values into given functions and calculating:
b) $g(4)=3^4+5=81+5=86$
c) $f(0)=3-0=3$
d) $f(2)=3-|2|=3-2=1$
e) $g(1)=3^1+5=3+5=8$
f) $g(0)=3^0+5=1+5=6$
b) $g(4)=86$
c) $f(0)=3$
d) $f(2)=1$
e) $g(1)=8$
f) $g(0)=6$
$$
begin{align*}
dfrac{2}{7}x+2&=dfrac{3}{10}tag{multiply each term by 70}\
dfrac{2}{7}x cdot 70 +2cdot 70 &=dfrac{3}{10}cdot 70 \
2xcdot dfrac{70}{7} +140&= 3cdot dfrac{70}{10}\
20x+140&=21tag{subtract 140 from each side}\
20x+140-140&=21-140\
20x&=-119tag{divide each side by 20}\
&boxed{x=-dfrac{119}{20}}
end{align*}
$$
Now, checking our solution in the original equation
$$
begin{align*}
dfrac{2}{7}x+2&=dfrac{3}{10}\
dfrac{2}{7}(-dfrac{119}{20})+2&=dfrac{3}{10}\
-dfrac{2}{20}cdot dfrac{119}{7}+ 2cdot dfrac{10}{10}&=dfrac{3}{10}tag{take $dfrac{1}{10}$ common }\
dfrac{1}{10}(-dfrac{119}{7}+20)&=dfrac{3}{10}tag{multiply each side by 10}\
( dfrac{-119+140}{7})&=3\
dfrac{21}{7}&=3\
3&=3
end{align*}
$$
We can see that the solution $x=-dfrac{119}{20}$ is satisfying the original equation, hence verified.
$$
begin{align*}
dfrac{9}{50}+dfrac{6x}{25}&=dfrac{3}{10}tag{multiply each term by 50}\
dfrac{9}{50}cdot 50+dfrac{6x}{25}cdot 50&=dfrac{3}{10}cdot 50\
9cdot dfrac{50}{50} +6xcdot dfrac{50}{25}&= 3cdot dfrac{50}{10}\
9+12x&=15tag{subtract 9 from each side}\
9-9+12x&=15-9\
12x&=6tag{divide each side by 6}\
&boxed{x=dfrac{1}{2}}
end{align*}
$$
Now, checking our solution in the original equation
$$
begin{align*}
dfrac{9}{50}+dfrac{6x}{25}&=dfrac{3}{10}\
dfrac{9}{50}+dfrac{6(dfrac{1}{2})}{25}&=dfrac{3}{10}\
dfrac{9}{50}+dfrac{3}{25}&=dfrac{3}{10}\
dfrac{9}{50}+dfrac{6}{50}&=dfrac{3}{10}\
dfrac{9+6}{50}&=dfrac{3}{10}\
dfrac{15}{50}&=dfrac{3}{10}\
dfrac{3}{10}&=dfrac{3}{10}
end{align*}
$$
We can see that the solution $x=dfrac{1}{2}$ is satisfying the original equation $dfrac{9}{50}+dfrac{6x}{25}=dfrac{3}{10}$, hence verified.
$textbf{(b)}$ $x=dfrac{1}{2}$
$textbf{(b)}$ $x+y$ represents the total number of the drinks sold on a given day
$textbf{(c)}$ $xS+yL$ represents the total volume of the drink sold on a given day. because $xS$ is the volume of total number of small drinks on a given day and similarly $yL$ is the volume of total number of large drinks on a given day.
$textbf{(b)}$ $x+y$ represents the total number of the drinks sold on a given day
$textbf{(c)}$ $xS+yL$ represents the total volume of the drink sold on a given day
Slope of a line which passes through a pair or points $(x_1,y_1)$ and $(x_2,y_2)$ is given by
$$
text{slope}=dfrac{y_2-y_1}{x_2-x_1}
$$
Now, we have our set of points as $(671,185)$ and $(2825,1496)$ . Let $(x_1,y_1)=(671,185)$ and $(x_2,y_2)=(2825,1496)$, therefore slope of line passing through these point is
$$
begin{align*}
text{slope}&= dfrac{1496-185}{2825-671}\
&=dfrac{1311}{2154}\
&=0.6086
end{align*}
$$
The equation of a line of given slope $m$ passing through a point $(x_1,y_1)$ is given by
$$
y-y_1=mcdot (x-x_1)
$$
Therefore, the equation of a line of slope $0.6086$ passing through a point $(671,185)$ is given by
$$
begin{align*}
y-(185)&=0.6086cdot (x-(671))\
y-185&=0.6086cdot x +0.6086cdot -671\
y-185&=0.6086cdot x -408.3706\
y&=0.6086cdot x -408.3706+185\
y&=0.6086cdot x -222.3706
end{align*}
$$
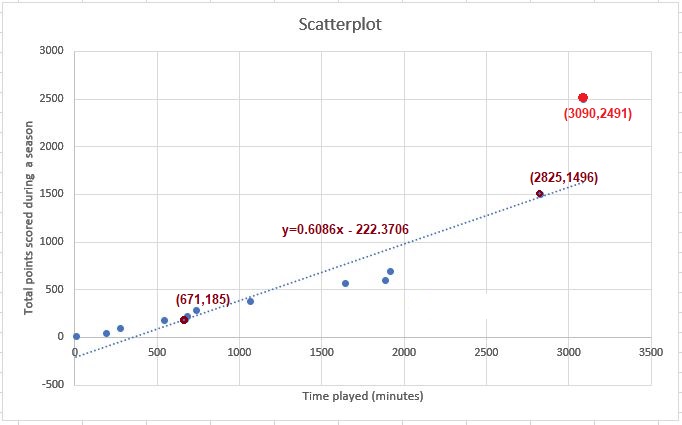
The residual is defined as shown below
$$
text{Residual}=text{actual value}-text{predicted value}
$$
The actual value of point from the table is $2491$ and predicted value can be calculated from equation of the line of best fit by putting $x=3090$ in it.
$$
begin{align*}
y&=0.6086cdot x -222.3706\
y&=0.6086cdot (3090) -222.3706\
y&=1880.574 -222.3706\
y&=1658.2034
end{align*}
$$
Therefore, the residual for the data point $(3090,2491)$ is
$$
text{Residual}=2491-1658.2034=832.7966
$$
$textbf{(c)}$ A positive value of residual means that the actual value of points scored by a player is more than the value predicted by the equation of line of best fit. Therefore, a player will be proud of a more positive value of residual.
$textbf{(d)}$ For calculating the points scored Antonio Kusoc we need to put the value of $x$ equal to 2103 minutes in the equation of line of best fit. This can be solved as shown below
$$
begin{align*}
y&=0.6086cdot x -222.3706\
y&=0.6086cdot (2103) -222.3706\
y&=1279.8858 -222.3706\
y&=1057.5152
end{align*}
$$
Therefore, Antonio Kusoc will score around 1058 points during a season
$textbf{(b)}$ $text{Residual}=832.7966$
$textbf{(c)}$ A positive value of residual means that the actual value of points scored by a player is more than the value predicted by the equation of line of best fit. Therefore, a player will be proud of a more positive value of residual.
$textbf{(d)}$ Antonio Kusoc will score around 1058 points during a season
The different model will give different estimates for the number of points scored by Antonio Kusoc. Moreover, the values of residuals will also differ for the different models.
A model which gives least value for the sum of the squares of residuals, will be the best fit data and will predict the scores of the players more accurately.
squares of the residuals using the following formula:
$$
RSS=sum_{i=0}^{n} {(y_i – (alpha+beta x_i))^2}
$$
Where $x,y$ are set of values $alpha,beta$ are constant values and $n$ is set value of count.
RSS=sum_{i=0}^{n} {(y_i – (alpha+beta x_i))^2}
$$
begin{tabular}{ |p{2cm}|p{1.5cm}|p{1.5cm}|p{1.5cm}|p{1.5cm}|p{1.5cm}|p{1.5cm}|p{1.5cm}|}
hline
multicolumn{8}{|c|}{Residuals} \
hline
862.117&24.712&-318.864&-203.163&-244.489&-681.994&-48.6155&\
hline
209.5771&46.662&17.37&17.3705&143.792&66.628&-5.303&131.152\
hline
end{tabular}
\\
The sum of the squares of the residuals is 1,502,806.\\
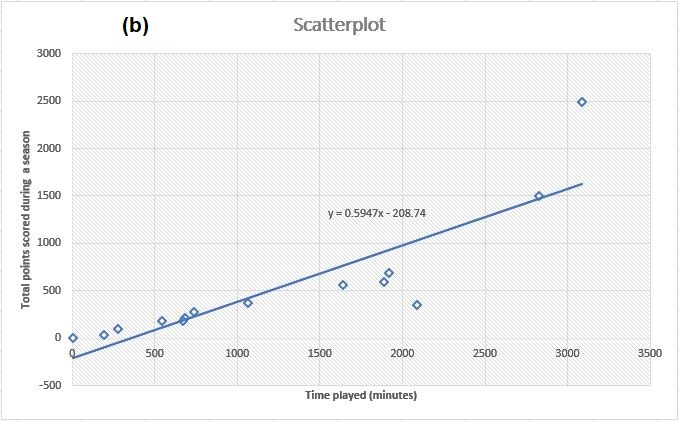
textbf{(d)} For the scores of Antonio Kusoc we need to put $x=2103$ in the equation $y=0.5947x-208.47$.
begin{align*}
y&=0.5947x-208.47\
y&=0.5947(2103)-208.47\
y&=1250.6541-208.47\
y&=1042.1841
end{align*}
Therefore, the predicted points for the Antonio Kusoc from the LSRL is approximately 1042.\\
textbf{(e)} The slope in this context represents the number of points scored by a player per minute.\
The $y$-intercept in this context tells the points scored by a players if he plays for 0 minutes. Practically it should be zero but due to imperfections in the modelling there is some non zero value for $y$-intercept.\
The LSRL model is not reasonable for players that played less than 350 minutes as for those players it is showing the number of points scored as negative which is not possible.\
$textbf{(d)}$ The predicted points for the Antonio Kusoc from the LSRL is approximately 1042.
$textbf{(e)}$The LSRL model is not reasonable for players that played less than 350 minutes as for those players it is showing the number of points scored as negative which is not possible.
For more explanation see inside
First, we need to find e Tool on the Internet. In order to show the line of the best fit and residuals and to hide the squares and the least squares regression line, we can use the buttons on the right side of the screen.
#### (b)
In order to show the line of the best fit and squares and hide the least squares regression line, again, we need to use buttons on the right side. After that, we can use the mean line button.
#### (c)
In order to find the LSRL, we need to press the LS button.
Y-intercept gives the cost of hamburger when there is no meat patty in it that means only the cost of the bun. Here, in this case, it’s $0.253 and this does make sense in this situation.\\
textbf{(b)} Let’s find out the cost of a hamburger with the 3-ounce patty in it, by the given LSRL equation by putting a value of$x=3
$$
begin{align*}
y &=0.253 + 0.735times(3)\
y&=0.253+2.205\
y&=$2.458\
y&approx $2.46
end{align*}
But the cost of a hamburger with 3-ounce patty is given $3.20. Hence the residual is
$$
$$(3.20-2.46)=$0.74$ $which signifies that the LSRL equation gives the cost of a hamburger with 3-ounce patty $0.74 lower than the actual available hamburger price in the market. \\
textbf{(c)} 1 pound is equivalent to 16 ounce. Assuming that all the weight is of meat patty by neglecting the weight of the bun, we can find the cost of hamburger with 16-ounce patty by putting$x=16$ in the LSRL equation as shown below.
$$
begin{align*}
y &=0.253 + 0.735times(16)\
y&=0.253+11.76\
y&=$12.013
end{align*}
$$
The cost of 1 pound hamburger is close to $12.013 which is lower than the cost of a hamburger in his friend’s town. Therefore, we can say that the price is reasonable in Charlie’s town.
Y-intercept gives the cost of hamburger when there is no meat patty in it that means only the cost of a bun.
(b) LSRL equation gives the cost of hamburger with 3-ounce patty $0.74 lower than the actual available hamburger price in the market.
(c) The cost of 1 pound hamburger is close to $12.013 which is lower than the cost of a hamburger in his friend’s town. Therefore, we can say that the price is reasonable in Charlie’s town.
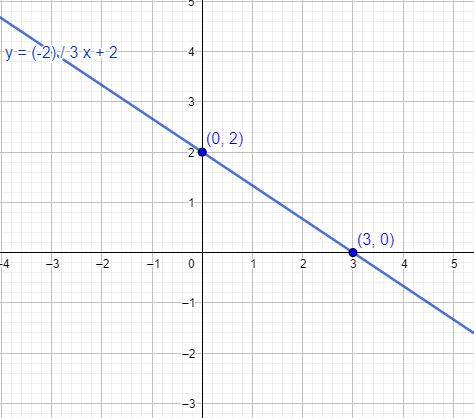
The equation $2x+3y=6$ can be rearranged and can be written in the general form so that we can compare it with the general form equation of line for the slope and the $y$-intercept.
$$
begin{align*}
2x&+3y=6tag{add -2x to each side}\
2x-2x+3y&=-2x+6\
3y&=-2x+6tag{divide each term by 3}\
dfrac{3y}{3}&=dfrac{-2}{3}x+dfrac{6}{3}\
y&=-dfrac{2}{3}x+2
end{align*}
$$
On comparing the equation $y=-dfrac{2}{3}x+2$ with $y=mx+c$ we can say that
$$
text{Slope}=-dfrac{2}{3}
$$
$$
ytext{-intercept}=2
$$
from drawing graph for the line we need to locate at least 2 points on the graph through which we can draw the line.
The $y$-intercept is where $x=0$, therefore one point on this line is $(0,2)$
For other point, we can put $y=0$ in this line
$$
begin{align*}
2x+3y&=6\
2x+3(0)&=6\
2x&=6tag{divide each side by 2}\
x&=3
end{align*}
$$
Therefore, the other point on the line is $(3,0)$
Now, we can easily mark these points on the graph and make a line passing through these points.
The graph is attached inside.
text{Slope}=-dfrac{2}{3}
$$
$$
ytext{-intercept}=2
$$
Slope of a line which passes through a pair or points $(x_1,y_1)$ and $(x_2,y_2)$ is given by
$$
text{slope}=dfrac{y_2-y_1}{x_2-x_1}
$$
Now, we have known points as $(-1,0)$ and $(2,2)$ . Let $(x_1,y_1)=(-1,0)$ and $(x_2,y_2)=(2,2)$, therefore slope of line passing through these point is
$$
begin{align*}
text{slope}&= dfrac{2-0}{2-(-1)}\
&=dfrac{2}{2+1}\
&=dfrac{2}{3}
end{align*}
$$
The equation of a line of given slope $m$ passing through a point $(x_1,y_1)$ is given by
$$
y-y_1=mcdot (x-x_1)
$$
Therefore, the equation of a line of slope $dfrac{2}{3}$ passing through a point $(-1,0)$ is given by
$$
begin{align*}
y-(0)&=dfrac{2}{3}cdot (x-(-1))\
y&=dfrac{2}{3}cdot x+dfrac{2}{3}cdot 1\
y&=dfrac{2}{3}cdot x +dfrac{2}{3}
end{align*}
$$
$$
begin{align*}
y&=dfrac{2}{3}cdot x +dfrac{2}{3}\
(-2)&=dfrac{2}{3}cdot (-4) +dfrac{2}{3}tag{take LCM on right side}\
-2&=dfrac{-8+2}{3}\
-2&=dfrac{-6}{3}\
-2&=-2text{ Always true }
end{align*}
$$
Therefore, point $-4,-2$ also lies on the given line.
Now, checking for the point $(0,1)$ if it is a solution or not.
$$
begin{align*}
y&=dfrac{2}{3}cdot x +dfrac{2}{3}\
(1)&=dfrac{2}{3}cdot (0) +dfrac{2}{3}tag{take LCM on right side}\
1&=0+dfrac{2}{3}\
1&ne dfrac{2}{3}
end{align*}
$$
Therefore, point $(0,1)$ is not a solution to the Martha’s equation.
$(-4,-2)$ is also a solution to the Martha’s equation. For a detailed analysis see the answer inside.
{color{#4257b2}text{a)}}
$$
$$
begin{align*}
5^0cdot :2^{-3}& {=}quad : 1cdot :2^{-3}\
&=1cdot frac{1}{2^3}=frac{1}{2^3} \
&={color{#c34632}frac{1}{8}}
end{align*}
$$
$$
color{#c34632} text{ } mathrm{Apply:rule}:a^0=1,:ane :0
$$
$$
color{#c34632} text{ }mathrm{Apply:exponent:rule}:quad :a^{-b}=frac{1}{a^b}
$$
{color{#4257b2}text{b)}}
$$
$$
begin{align*}
frac{a^3}{b^{-2}}cdot frac{ab^2}{a^4}& {=}quad : frac{b^2}{a^3}a^3b^2\
&frac{a^3}{b^{-2}}=frac{a^3}{frac{1}{b^2}}=frac{a^3b^2}{1}=a^3b^2 tag{Simplify} \
&frac{ab^2}{a^4}=frac{b^2}{a^3} tag{Simplify}\
&=frac{b^2a^3b^2}{a^3} tag{Multiply fractions} \
&=b^2b^2 tag{Cancel the common factor} \
&={color{#c34632}b^4}
end{align*}
$$
$$
color{#c34632} text{ } mathrm{Apply:exponent:rule}:quad :a^{-b}=frac{1}{a^b}
$$
$$
color{#c34632} text{ } mathrm{Apply:the:fraction:rule}:quad frac{a}{frac{b}{c}}=frac{acdot :c}{b}
$$
{color{#4257b2}text{c)}}
$$
$$
begin{align*}
2.3cdot :10^{-3}cdot :4.2cdot :10^2& {=}quad : 2.3left(2cdot :5right)^{-3}cdot :4.2cdot :10^2tag{Factor integer}\
&=2.3cdot :2^{-3}cdot :5^{-3}cdot :4.2cdot :10^2 \
&=2.3cdot :2^{-3}cdot :5^{-3}cdot :4.2left(2cdot :5right)^2 tag{Factor integer} \
&=2.3cdot :2^{-3}cdot :5^{-3}cdot :4.2cdot :2^2cdot :5^2 \
&=2^{-1}cdot :5^{-3}cdot :5^2cdot :2.3cdot :4.2 \
&=2^{-1}cdot :5^{-1}cdot :2.3cdot :4.2\
&=2.3cdot :4.2cdot frac{1}{2}cdot frac{1}{5}\
&=2.3cdot :4.2cdot frac{1}{10}\
&=9.66cdot frac{1}{10} tag{Multiply the numbers}\
&=frac{9.66}{10}\
&={color{#c34632}0.966=9.66times 10^{-1}}
end{align*}
$$
$$
color{#c34632} text{ }mathrm{Apply:exponent:rule}:quad left(abright)^c=a^cb^c
$$
$$
color{#c34632} text{ } mathrm{Apply:exponent:rule}:quad :a^bcdot :a^c=a^{b+c}
$$
$$
color{#c34632} text{ } mathrm{Apply:exponent:rule}:quad :a^{-1}=frac{1}{a}
$$
$$
text{ }
$$
{color{#4257b2}text{d)}}
$$
$$
begin{align*}
left(3.5cdot :10^3right)^2& {=}quad : 3.5^2left(10^3right)^2\
&=3.5^2cdot :10^6 \
&=10^6cdot :12.25 \
&=1000000cdot :12.25\
&={color{#c34632}12250000=1.225times 10^{7}}
end{align*}
$$
$$
color{#c34632} text{ }mathrm{Apply:exponent:rule}:quad left(acdot :bright)^n=a^nb^n
$$
$$
color{#c34632} text{ }mathrm{Apply:exponent:rule}:quad left(a^bright)^c=a^{bc}
$$
color{#4257b2} text{ a) }frac{1}{8}
$$
$$
color{#4257b2}text{ b) }b^4
$$
$$
color{#4257b2} text{ c) }9.66times 10^{-1}
$$
$$
color{#4257b2} text{ d) }1.225times 10^{7}
$$
$$
begin{align*}
25^2&=125^{x+1}\
(5^2)^2&=(5^3)^{x+1} tag{use $(a^m)^n=a^{mcdot n}$}\
5^{2cdot 2}&=5^{3cdot (x+1)}\
5^4&=5^{3x+3}tag{comparing powers}\
4&=3x+3tag{subtract 3 from each side}\
4-3&=3x+3-3\
1&=3x tag{divide each side by 3}\
dfrac{1}{3}&=dfrac{3x}{3} tag{solve and interchange sides}\
x&=dfrac{1}{3}
end{align*}
$$
$textbf{(b)}$
$$
begin{align*}
dfrac{x}{5}+dfrac{x-1}{3}&=2tag{multiply each term by 15(LCM)}\
dfrac{x}{5}cdot 15+dfrac{x-1}{3}cdot 15&=2cdot 15\
xcdot dfrac{15}{5}+ (x-1)cdot dfrac{15}{3}&=30\
3x+5(x-1)&=30\
3x+5x-5&=30tag{add +5 to each side}\
8x-5+5&=30+5\
8x&=35tag{divide each side by 8}\
dfrac{8x}{8}&=dfrac{35}{8}\
x&=dfrac{35}{8}
end{align*}
$$
$textbf{(b)}$ $x=dfrac{35}{8}$
$textbf{(b)}$ Given that upper boundary equation is $g=11.27-0.14d$ and lower boundary equation is $g=7.67-0.14d$
The line of best fit should pass through the middle of the given lines. The $y$-intercept should be the average of the average of the given two equations. Therefore, the value of $y$-intercept is $dfrac{11.27+7.67}{2}=9.47$ and slope will be same as the given lines that is $-0.14$.
Therefore, the equation of a line of slope $-0.14$ passing through a point $(0,9.47)$ is given by
$$
begin{align*}
y&=9.47-0.14x
end{align*}
$$
$textbf{(c)}$ Slope in this context represent the average decrease in amount spent on the grocery bill per unit miles away from the church. Comparing the equation’s slope it is $0.14times 1000=$1400$
$textbf{(d)}$ Given that Fabienne lives 8 miles from the church. Her predicted value of grocery bill can be calculated from the equation by putting $x=8$ into the equation.
$$
begin{align*}
y&=9.47-0.14x\
y&=9.47-0.14(9)\
y&=9.47-1.26\
y&=8.21
end{align*}
$$
As the value of spent is in thousand of dollars therefore, Fabienne’s expenditure on the groceries for the year is $8.21times 1000=$8210$
$textbf{(b)}$ $y=9.47-0.14x$
$textbf{(c)}$ Slope in this context represent the average decrease in amount spent on the grocery bill per unit miles away from the church. Comparing the equation’s slope it is $0.14times 1000=$1400$
$textbf{(d)}$ Fabienne’s expenditure on the groceries for the year is $8.21times 1000=$8210$
$$
begin{align*}
6-(3+x)&=10\
6-3-x&=10\
3-x&=10tag{subtract 3 from each side}\
3-3-x&=10-3\
-x&=7tag{divide each side by -1}\
dfrac{-x}{1}&=dfrac{7}{-1}\
&boxed{x=-7}
end{align*}
$$
$textbf{(b)}$
$$
begin{align*}
100(x+3)&=200tag{divide each side by 100}\
dfrac{100(x+3)}{100}&=dfrac{200}{100}\
x+3&=2tag{subtract 3 from each side}\
x+3-3&=2-3\
&boxed{x=-1}
end{align*}
$$
$$
begin{align*}
dfrac{1}{3}x+4&=x-2tag{subtract $dfrac{1}{3}x$ from each side}\
dfrac{1}{3}x-dfrac{1}{3}x+4&=x-dfrac{1}{3}x-2\
4&=dfrac{3x-x}{3}-2\
4&=dfrac{2x}{3}-2tag{add 2 to the each side}\
4+2&=dfrac{2x}{3}-2+2\
6&=dfrac{2x}{3}tag{multiple each side by $dfrac{3}{2}$}\
6cdot dfrac{3}{2}&=dfrac{2x}{3}cdot dfrac{3}{2}\
9&=xtag{interchange sides}\
&boxed{x=9}
end{align*}
$$
$textbf{(d)}$
$$
begin{align*}
dfrac{4}{5}&=dfrac{x+2}{45}tag{multiply each side by 45}\
dfrac{4}{5} cdot 45&=dfrac{x+2}{45} cdot 45\
4cdot 9&=x+2\
36&=x+2tag{subtract 2 from each side}\
36-2&=x+2-2\
34&=xtag{interchange sides}\
&boxed{x=34}
end{align*}
$$
$textbf{(b)}$ -1
$textbf{(c)}$ 9
$textbf{(d)}$ 34
$$
text{Area}=a^2
$$
We are given that area for a square is 240.56 so the side length for this square can be calculated as shown below
$$
begin{align*}
240.56&=a^2tag{take square root on each side}\
sqrt{240.56}&=sqrt{a^2}\
sqrt{240.56}&=atag{interchange sides}\
&boxed{a=15.5099}
end{align*}
$$
But for the same precision as given for area we need to mention the answer upto 2 digits after the decimals. This will make the side length equal to $15.51$ cms.
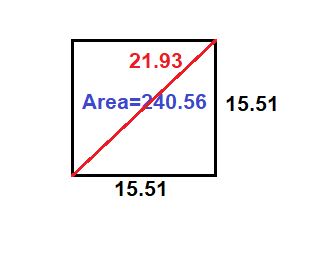
Let the diagonal length is represented by $d$ and side lengths are represented by $a$
$Rightarrow$
$$
begin{align*}
d^2&=a^2+a^2\
d^2&=2a^2tag{take square root each side}\
sqrt{d^2}&=sqrt{2a^2}\
d&=sqrt{2}a
Rightarrow\
d&=1.414cdot 15.51\
d&=21.93114\
&boxed{d=21.93}tag{using same precision as for the area}
end{align*}
$$
$textbf{(b)}$ $21.93$
{color{#4257b2}text{a)}}
$$
$$
begin{align*}
5xleft(3xright)& {=}quad : 5xcdot :3xtag{Remove parentheses}\
&=15xx \
&={color{#c34632}15x^2}
end{align*}
$$
$$
color{#c34632} text{ }mathrm{Apply:exponent:rule}:quad :a^bcdot :a^c=a^{b+c}
$$
$$
text{ }
$$
{color{#4257b2}text{b)}}
$$
$$
begin{align*}
5x+3x& {=}quad : color{#c34632}8x\
end{align*}
$$
{color{#4257b2}text{c)}}
$$
$$
begin{align*}
6xleft(xright)& {=}quad : 6xxtag{Remove parentheses}\
&={color{#c34632}6x^2}
end{align*}
$$
$$
color{#c34632} text{ }mathrm{Apply:exponent:rule}:quad :a^bcdot :a^c=a^{b+c}
$$
$$
text{ }
$$
{color{#4257b2}text{d)}}
$$
$$
begin{align*}
6x+x& {=}quad : color{#c34632}7x\
end{align*}
$$
color{#4257b2} text{ a) }15x^2
$$
$$
color{#4257b2} text{ b) } 8x
$$
$$
color{#4257b2}text{ c) }6x^2
$$
$$
color{#4257b2}text{ d) } 7x
$$
{color{#4257b2}text{a)}}
$$
$$
begin{align*}
2x=8& {;}quad : frac{2x}{2}=frac{8}{2}tag{Divide both sides by 2}\\
&{color{#c34632}x=4}
end{align*}
$$
{color{#4257b2}text{b)}}
$$
$$
begin{align*}
2x+2=10& {;}quad : 2x+2-2=10-2tag{Subtract 2 from both sides}\
&2x=8tag{Simplify} \
&frac{2x}{2}=frac{8}{2}tag{Divide both sides by 2} \
&{color{#c34632}x=4}
end{align*}
$$
{color{#4257b2}text{c)}}
$$
$$
begin{align*}
6x+2-4x=10& {;}quad : 6x-4x+2=10tag{Group like terms}\
&2x+2=10tag{Add similar elements} \
&2x+2-2=10-2tag{Subtract 2 from both sides} \
&2x=8tag{Simplify} \
&frac{2x}{2}=frac{8}{2}tag{Divide both sides by 2} \
&{color{#c34632}x=4}
end{align*}
$$
{color{#4257b2}text{d)}}
$$
$$
begin{align*}
2left(3x+1right)-4x=10& {;}quad : 2x+2=10tag{Expand}\
&2x+2-2=10-2tag{Subtract 2 from both sides} \
&2x=8tag{Simplify} \
&frac{2x}{2}=frac{8}{2}tag{Divide both sides by 2} \
&{color{#c34632}x=4}
end{align*}
$$
{color{#4257b2}text{e)}}
$$
$$
color{#c34632}text{ x=4 for every equation }
$$
$$
text{ }
$$
$$
text{ }
$$
color{#4257b2} text{ a) }x=4
$$
$$
color{#4257b2} text{ b) }x=4
$$
$$
color{#4257b2} text{ c) }x=4
$$
$$
color{#4257b2} text{ d) }x=4
$$
$$
color{#4257b2} text{ e) x=4 for every equation }
$$
$$
text{ }
$$
$$
boxed{6x-15=x}
$$
$$
begin{align*}
6x-15&=xtag{subtract x from each side}\
6x-x-15&=x-x\
5x-15&=0tag{add 15 to each side}\
5x-15+15&=0+15\
5x&=15tag{divide each side by 5}\
&boxed{x=3}
end{align*}
$$
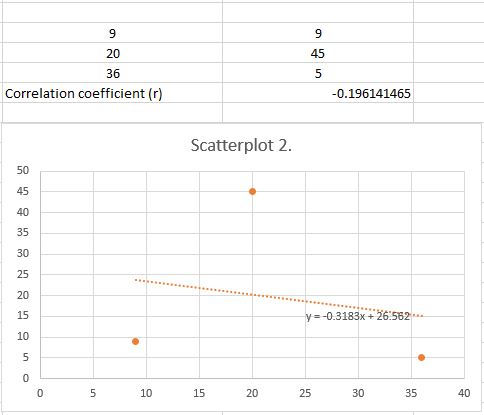
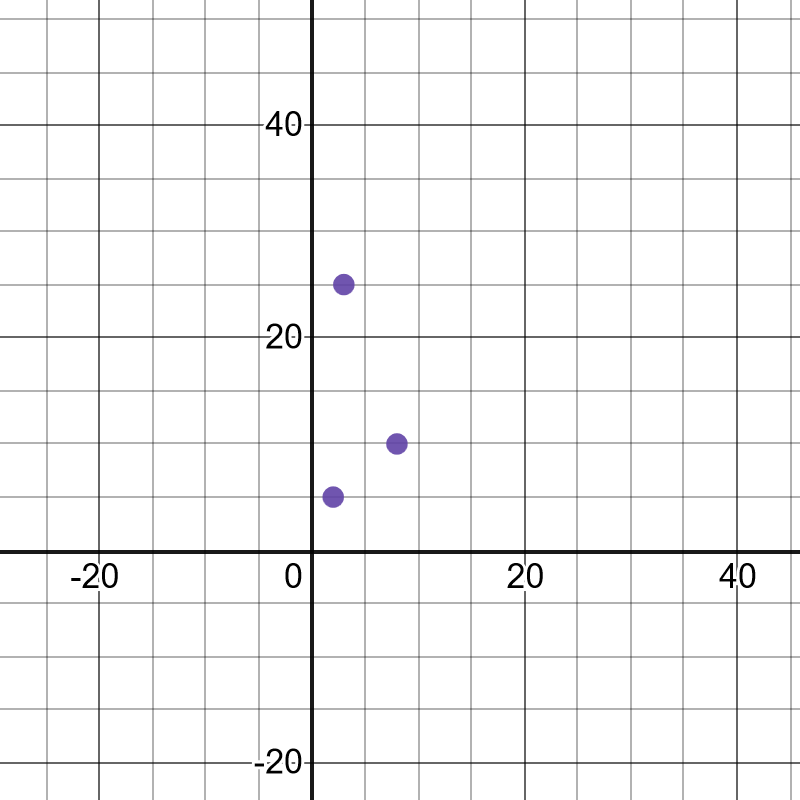
Ryan was thinking about the number $3$
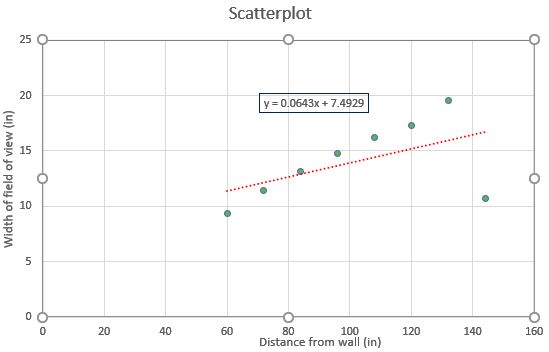
view be too small. This can be seen by the comparing the above two LSRL lines on the scatterplots and the actual points on the graph.
$textbf{(b)}$ Yes, I would consider it as the point of outlier because this point has shifted the LSRL significantly and not following with the trend. The new LSRL is $y=0.064x+7.493$
$textbf{(c)}$The impact of outlier is that it shifted the LSRL significantly below and Amy’s predictions for the field of
view be too small.
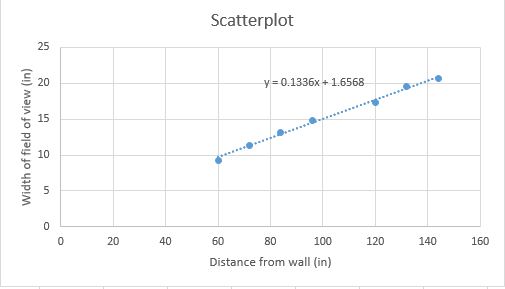
On the following picture, there are drawn the data and the best fit line: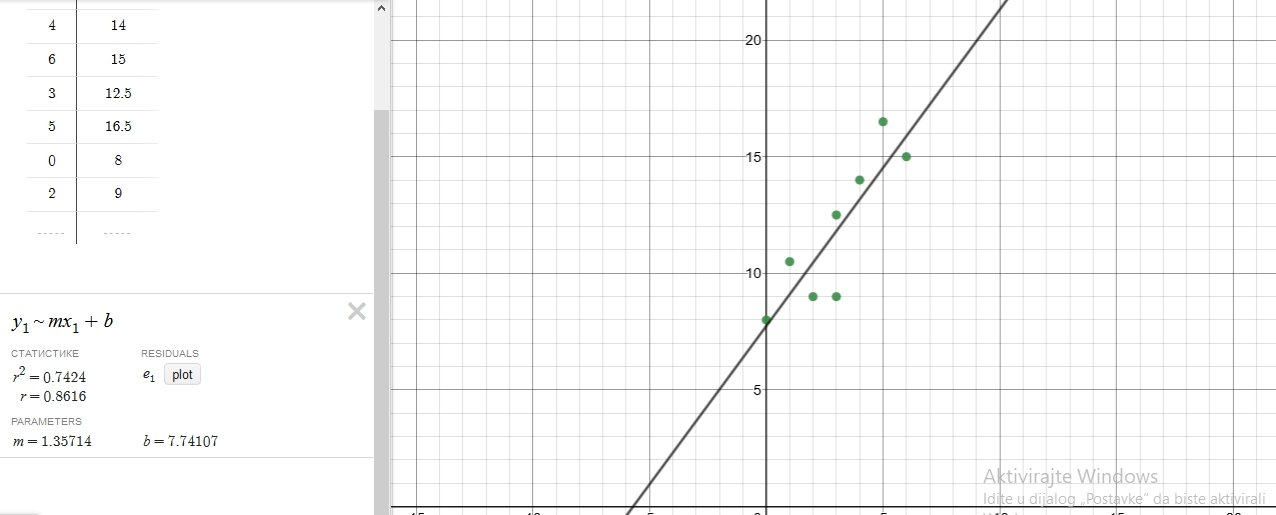
$$
y=1.36x+7.74
$$
#### (b)
We will substitute $2$ for $x$ in the previous equation and get the predicted how much Gulia’s father should charge:
$$
y=1.36cdot2+7.74
$$
$$
y=10.46
$$
So, Gulia’s father should charge
$$
10.46$.\
$$
$$
10.46$\
$$
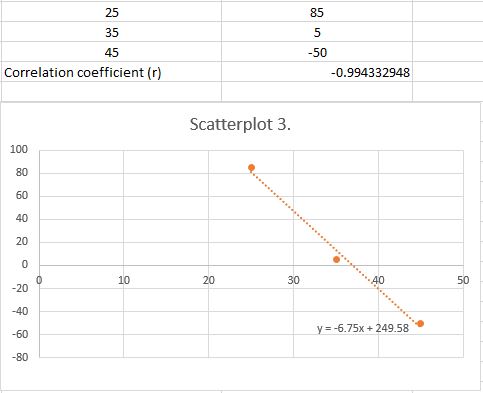
Scatterplot II $rightarrow$ Residual Plot B
Scatterplot III $rightarrow$ Residual Plot A
$textbf{(b)}$ scatterplot III has a linear model that fit the data best as its residual plot is has lesser magnitude That means the LSRL represents the data points more closely than in the other two cases,
On the following picture, there is a scatter plot of the given data.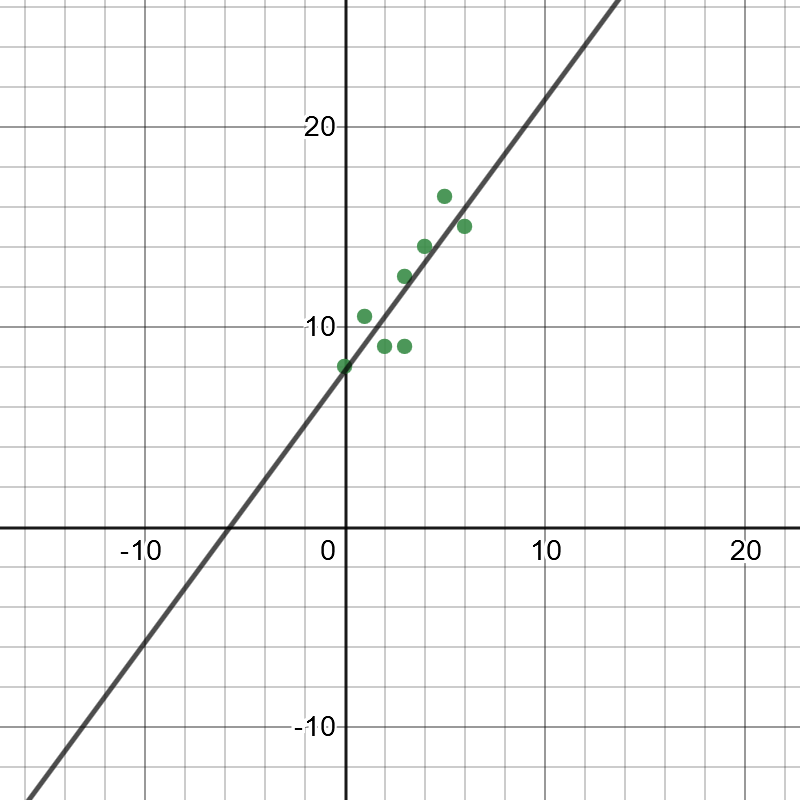
#### (b)
It is expected to be equivalent the positive and negative residuals.
#### (c)
The conclusion is that there is not any kind of shape to the plotted points, so, this model is appropriate.
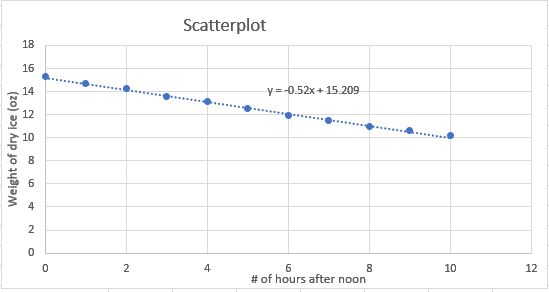
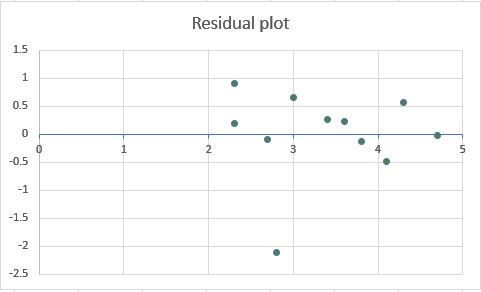
The residual plot tells us that data point collected by Giulia are nearly lies on the LSRL and hence shows a good sign of linearity.
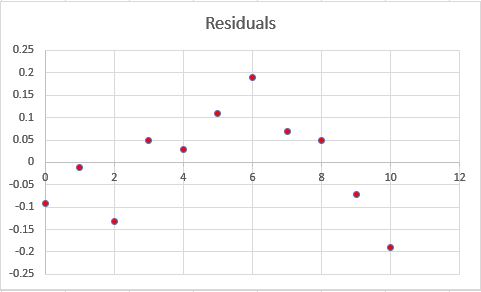
$textbf{(b)}$ Seeing the residual plot we can say that linear model is appropriate as the residual values are very small.
The residual plot tells us that data point collected by Giulia are nearly lies on the LSRL and hence shows a good sign of linearity.
$textbf{(b)}$ The LSRL is $f = 9.37 + 3.96p$, where $f$ is the number of avocado farms and $p$ is the population in thousands. For estimating the number of farms for the country with 62,900 people we need to put this value of $p=62.9$ into the LSRL equation.
$$
begin{align*}
f&= 9.37 + 3.96cdot (62.9)\
&= 9.37+249.08\
&=258.45\
&=258
end{align*}
$$
Therefore, the predicted number of avocado farms for the county with a population of 62,900 people is 258
$textbf{(c)}$ From the residual plot we can see that for the input 62.9 we have a residual of approximately $-18$, which means actual number of farms is 18 less than the predicted value by LSRL equation.
Therefore, the actual number of avocado farms in the country with 62,900 residents is
$$
258-18=240
$$
$textbf{(b)}$ 258
$textbf{(c)}$ 240
We can see from the Scatterplot and the LSRL that we have a completely linear relationship between two sets because there are no residuals as all the points lie perfectly on LSRL.
We can see from the Scatterplot and the LSRL that we have significant magnitude of residuals and therefore this doesn’t show a appropriate linear relationship.
In order to create residuals, you can use a graphing calculator.
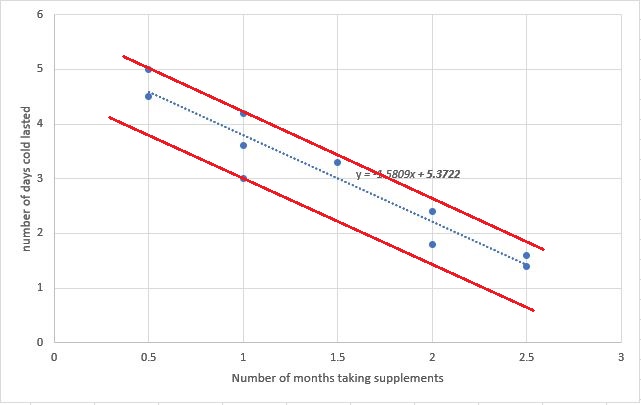
We can see from the plot that the point $(0.5,5)$ is having highest positive residual. So the equation for the upper boundary line can be written by the procedure explained below.
The equation of a line of given slope $m$ passing through a point $(x_1,y_1)$ is given by
$$
y-y_1=mcdot (x-x_1)
$$
Therefore, the equation of a line of slope $-1.5809$ passing through a point $(0.5,5)$ is given by
$$
begin{align*}
y-5&=-1.5809cdot (x-0.5)\
y-5&=-1.5809cdot x -1.5809cdot (-0.5) \
y-5&=-1.5809cdot x+0.79045 \
y&=-1.5809cdot x+0.79045+5 \
&boxed{y=-1.5809cdot x+5.79045}
end{align*}
$$
Similarly, we can find the equation for lower boundary line. We can see from the plot that the point $(1,2.4)$ is having highest negative residual.
Therefore, the equation of a line of slope $-1.5809$ passing through a point $(1,2.4)$ is given by
$$
begin{align*}
y-2.4&=-1.5809cdot (x-1)\
y-2.4&=-1.5809cdot x -1.5809cdot (-1) \
y-2.4&=-1.5809cdot x+1.5809 \
y&=-1.5809cdot x+1.5809+2.4 \
&boxed{y=-1.5809cdot x+3.9809}
end{align*}
$$
For the $y$ values we need to put $x=3$ in the respective equations
$bullet$ For upper boundary equation
$$
begin{align*}
y&=-1.5809cdot x+5.79045\
y=-1.5809cdot 3+5.79045\
y&=0.99618
end{align*}
$$
$bullet$ For lower boundary equation
$$
begin{align*}
y&=-1.5809cdot x+3.9809\
y=-1.5809cdot 3+3.9809\
y&=-4.7427+3.980\
y&=-0.7627
end{align*}
$$
The magnitude of their difference is $|0.99618-(-0.7627)|=1.7588$.
So applying the same precision in the answer as given in table data, The cold will last around 1.8 days
$textbf{(e)}$ For this we need to put value of $x$ equal to 6 into the LSRL equation which is as shown below
$$
begin{align*}
y&=-1.5809cdot x+5.3722\
y&=-1.5809cdot 6+5.3722\
y&=-9.4854+5.3722\
y&=-4.1132
end{align*}
$$
We are getting the number of days as negative, which makes no sense. So, it means after few weeks the person becomes immune to cold and for them cold lasts for 0 days.
$textbf{(f)}$ A negative value of residual means that actually cold lasts for lesser than the predicted value of days from the LSRL equation, hence I will prefer a negative residual value in this situation.
$textbf{(b)}$ Upper boundary equation is $y=-1.5809cdot x+5.79045$ and lower boundary equation is $y=-1.5809cdot x+3.9809$
$textbf{(c)}$ According to the upper and lower boundaries for a person who has taken supplements for three months, the colds lasts for around 1.8 days.
$textbf{(d)}$ $5.4$ days
$textbf{(e)}$ We are getting the number of days as negative, which makes no sense. So, it means after few weeks the person becomes immune to cold and for them cold lasts for 0 days.
$textbf{(f)}$ A negative value of residual means that actually cold lasts for lesser than the predicted value of days from the LSRL equation, hence I will prefer a negative residual value in this situation.
$$
begin{align*}
3x+2&=10-4(x-1)\
3x+2&=10-4x+4\
3x+2&=-4x+14tag{add 4x to each side}\
3x+4x+2&=-4x+4x+14\
7x+2&=14tag{subtract 2 from each side}\
7x+2-2&=14-2\
7x&=12tag{divide each side by 7}\
dfrac{7x}{7}&=dfrac{12}{7}\
&boxed{x=dfrac{12}{7}}
end{align*}
$$
$textbf{(b)}$
$$
begin{align*}
4(x-1)-2(3x+5)&=-3x+1tag{applying distributive property}\
4x-4 -6x-10&=-3x+1tag{collect the like terms}\
(4x-6x)+(-4-10)&=-3x+1\
-2x-14&=-3x+1tag{add 2x to the each side}\
-2x+2x-14&=-3x+2x+1\
-14&=-x+1tag{subtract 1 from each side}\
-14-1&=-x+1-1\
-15&=-xtag{multiply each side by -1}\
-15cdot -1&=-xcdot -1\
15&=xtag{interchange sides}\
&boxed{x=15}
end{align*}
$$
$textbf{(b)}$ $x=15$
Given that centipede can travel at 30 meters per minute. Lets find out the speed of centipede into centimeters per second. We know that 1 meter $=$100 centimeters and 1 minute is equivalent to 60 seconds.
$Rightarrow$
$$
begin{align*}
&30 dfrac { text {meters}}{text{minute}}\\
&=30 dfrac { text {meters}}{text{minute}} times dfrac{text{100 centimeters}}{text {1 meter}} times dfrac{text{1 minute} }{text{60 seconds}}\\
&= dfrac{30times 100}{60} dfrac{text{ centimeters}}{text{second}}\\
&=50 dfrac{text{ centimeters}}{text{second}}
end{align*}
$$
Now, we have speed of cockroach as 80 centimeters per second and speed of centipede
as 50 centimeters per second. Therefore, we can easily say that cockroach can travel faster.
$$
begin{align*}
f(0)&=6\
f(1)&=f(0)+2=6+2=8\
f(2)&=f(1)+2= f(0)+2+2= 6+2cdot 2=10\
f(3)&=f(2)+2= f(0)+2+2+2= 6+2cdot 3=12\
f(n)&=f(n-1)+2= f(0)+2cdot n= 6+2cdot n
end{align*}
$$
Therefore, the equation for this pattern is $f(n)=2cdot n + 6$
Now, for finding the number of tiles in the 100th figure we need to put $n=100$ into the above equation.
$$
begin{align*}
f(n)&=2cdot n + 6\
f(n)&=2cdot 100 + 6\
f(n)&=200 + 6\
f(n)&=206
end{align*}
$$
Hence, the 100th figure will have 206 tiles.
The 100th figure will have 206 tiles in it.
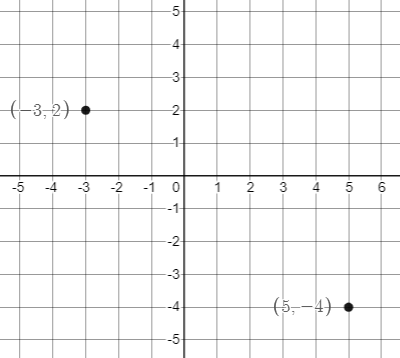
From the two points, $Delta x=5-(-3)=8$ and $Delta y=-4-2=-6$. So, the slope is:
$$
m=dfrac{Delta y }{Delta x}=dfrac{-6}{8}=color{#c34632}-dfrac{3}{4}
$$
$textbf{b.}$
Draw a line through the points and a slope triangle with them as the endpoints of the right triangle:
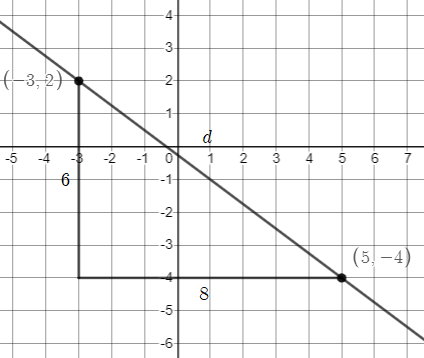
$$
begin{align*}
6^2+8^2&=d^2\
36+64&=d^2\
d^2&=100\
d&=sqrt{100}\
d&=color{#c34632}10
end{align*}
$$
b. $10$
$$
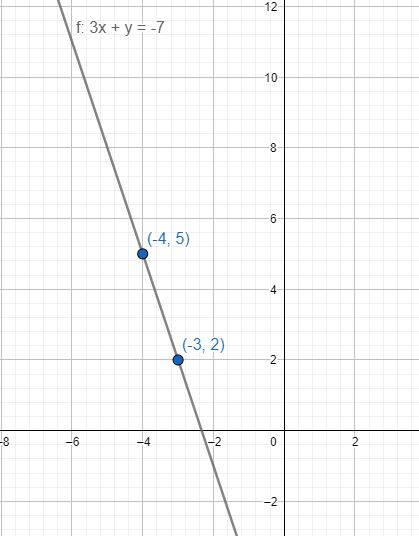
text{Slope}=dfrac{y_2-y_1}{x_2-x_1}
$$
We have given two points as $(-3,2)$ and $(-4,5)$ therefore, slope of line passing through these points is
$$
text{slope}=dfrac{5-2}{-4-(-3)}=-3
$$
$textbf{(b)}$ The distance between any two given points $(x_1,y_1)$ and $(x_2,y_2)$ is given by
$$
text{Distance}=sqrt{(y_2-y_1)^2 +(x_2-x_1)^2}
$$
Now, distance between points $(-3,2)$ and $(-4,5)$ can be calculated using above formula as shown below.
$$
begin{align*}
text{Distance}&=sqrt{(5-2)^2 +(-4-(-3))^2}\
&=sqrt{(3)^2 +(-1)^2}\
&=sqrt{9 +1}\
&=sqrt{10}\
end{align*}
$$
$textbf{(b)}$ $$sqrt{10}$
$
Use the exponent rule: $a^{m}cdot a^n=a^{m+n}$
$$
4^2cdot 4^5=color{#c34632}4^7
$$
or if asked to evaluate,
$$
=color{#c34632}16384
$$
$textbf{b.}$
Use the exponent rule: $a^0=1$
$$
(5^0)^3=(1)^3
$$
Evaluate:
$$
=color{#c34632}1
$$
$textbf{c.}$
Use the exponent rule: $a^{m}cdot a^n=a^{m+n}$
$$
x^{-5}cdot x^3=x^{-2}
$$
Use the exponent rule: $a^{-n}=dfrac{1}{a^n}$
$$
=color{#c34632}dfrac{1}{x^{2}}color{white}tag{1}
$$
Use the exponent rules: $(ab)^n=a^nb^n$ and $(a^{m})^n=a^{mn}$
$$
(x^{-1}cdot y^2)^3=x^{-3}cdot y^6
$$
Use the exponent rule: $a^{-n}=dfrac{1}{a^n}$
$$
=color{#c34632}dfrac{y^6}{ x^{3}}
$$
$textbf{e.}$
Group the decimals and group the powers using associative property:
$$
(8times 10^5)cdot (1.6times 10^{-2})=(8cdot 1.6)times (10^{5}cdot 10^{-2})
$$
Use the exponent rule: $a^{m}cdot a^n=a^{m+n}$
$$
=12.8times 10^3
$$
Write in scientific notation. The decimal part must be greater than or equal to 1 and less than 10 so we move 1 place to the left then add 1 to the power of 10:
$$
=color{#c34632}1.28times 10^4
$$
$textbf{f.}$
Group the decimals and group the powers using associative property:
$$
dfrac{4times 10^3}{5times 10^{5}}=dfrac{4}{5}times dfrac{10^{3}}{10^{5}}
$$
Use the exponent rule: $dfrac{a^{m}}{a^n}=a^{m-n}$
$$
=0.8times 10^{-2}
$$
Write in scientific notation. The decimal part must be greater than or equal to 1 and less than 10 so we move 1 place to the right then subtract 1 from the power of 10:
$$
=color{#c34632}8times 10^{-3}
$$
b. $1$
c. $dfrac{1}{x^2}$
d. $dfrac{y^6}{ x^{3}}$
e. $1.28times 10^4$
f. $8times 10^{-3}$
{color{#4257b2}text{ a) }}
$$
$$
begin{align*}
&text{
This example is solved in the following way}\
&=:4^{2+5}\\
&=boxed{{color{#c34632} 4^7 } }
end{align*}
$$
$$
color{#c34632} text{}mathrm{Apply:exponent:rule}:quad :a^bcdot :a^c=a^{b+c}
$$
$$
text{}
$$
{color{#4257b2}text{ b) }}
$$
$$
begin{align*}
&text{
Calculate within parentheses}\
&=1^3\\
&=boxed{{color{#c34632} 1 } } tag{Calculate exponents}\
end{align*}
$$
{color{#4257b2}text{ c) }}
$$
$$
begin{align*}
&text{
This example is solved in the following way}\
&=:x^{-5+3}\\
&=x^{-2} \\
&=boxed{{color{#c34632} frac{1}{x^2} } }
end{align*}
$$
$$
color{#c34632} text{}mathrm{Apply:exponent:rule}:quad :a^bcdot :a^c=a^{b+c}
$$
$$
color{#c34632} text{}mathrm{Apply:exponent:rule}:quad :a^{-b}=frac{1}{a^b}
$$
{color{#4257b2}text{ d) }}
$$
$$
begin{align*}
&text{
This example is solved in the following way}\
&=left(frac{y^2}{x}right)^3 tag{Multiply}\\
&=frac{left(y^2right)^3}{x^3} \\
&=boxed{{color{#c34632} frac{y^6}{x^3} } }
end{align*}
$$
$$
color{#c34632} text{}mathrm{Apply:exponent:rule}:quad left(frac{a}{b}right)^c=frac{a^c}{b^c}
$$
$$
color{#c34632} text{}mathrm{Apply:exponent:rule}:quad left(a^bright)^c=a^{bc}
$$
{color{#4257b2}text{ e) }}
$$
$$
begin{align*}
& text{Remove parentheses}\
&=8cdot :10^5cdot :1.6cdot :10^{-2}\\
&= 2^3cdot :10^5cdot :1.6cdot :10^{-2} tag{Factor integer} \
&=2^3left(2cdot :5right)^5cdot :1.6cdot :10^{-2} tag{Factor integer}\
&=2^3cdot :2^5cdot :5^5cdot :1.6cdot :10^{-2} \
&=5^{-2}cdot :2^6cdot :5^5cdot :1.6 \
&=2^6cdot :5^3cdot :1.6 \
&=64cdot :125cdot :1.6 \\
&=boxed{{color{#c34632} 12800 } } tag{Multiply the numbers}\
end{align*}
$$
$$
color{#c34632} text{}mathrm{Apply:exponent:rule}:quad left(abright)^c=a^cb^c
$$
$$
color{#c34632} text{} mathrm{Apply:exponent:rule}:quad :a^bcdot :a^c=a^{b+c}
$$
$$
text{}
$$
$$
text{}
$$
{color{#4257b2}text{ f) }}
$$
$$
begin{align*}
&text{
This example is solved in the following way}\
&=frac{4}{10^2cdot :5}\\
&=frac{2^2}{2^2cdot :5^2cdot :5} tag{Factor}\
&=frac{2^2}{5^3cdot :2^2} tag{Refine}\
&=frac{1}{5^3} tag{Cancel the common factor }\\
&=boxed{{color{#c34632} frac{1}{125} } }
end{align*}
$$
color{#4257b2} text{a)}4^7
$$
$$
color{#4257b2} text{b)} 1
$$
$$
color{#4257b2} text{c)} frac{1}{x^2}
$$
$$
color{#4257b2} text{d)} frac{y^6}{x^3}
$$
$$
color{#4257b2} text{e)} 12800
$$
$$
color{#4257b2} text{f)} frac{1}{125}
$$
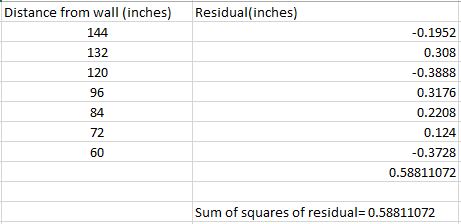
$textbf{(b)}$ 0.5881
We can represent the situation by assuming that $f(0)=a$ represents the number of tiles in Figure 0 and number of tiles in Figure n is represented by $f(n)$. Now, assume that tiles in every next Figure increased by equal number $c$ more tiles than the previous Figure as the growth pattern is linear.
$$
Rightarrow
$$
$$
begin{align*}
f(0)&=a\
f(1)&=a+c\
f(2)&=a+c+c=a+2c\
f(n)&=a+ncdot c
end{align*}
$$
Now, we can solve for $a$ and $c$ by putting the given values into the question. We have $f(3)=5$
$Rightarrow$
$$
begin{align*}
f(n)&=a+ncdot c\
5&=a+3cdot c
end{align*}
$$
Also, we have given $f(7)=13$
$Rightarrow$
$$
begin{align*}
f(n)&=a+ncdot c\
13&=a+7cdot c
end{align*}
$$
Now, solving the above obtained equation, We can get the values of $a$ and $c$.
$$
begin{align}
5&=a+3cdot c\
13&=a+7cdot c
end{align}
$$
On subtracting the equation (1) from the equation (2), we get
$$
begin{align*}
13-5&=a-a+(7-3)cdot c\
8&=4cdot ctag{divide each side by 4}\
2&=c
end{align*}
$$
Now, putting $c=2$ into equation (1) we get $a=-1$, therefore the final equation becomes
$$
boxed{f(n)=2n-1}
$$
f(n)=2n-1
$$
{color{#4257b2}text{a)}}
$$
$$
begin{align*}
6left(2x-5right)=-left(x+4right)& {;}quad : 12x-30=-x-4tag{Expand}\
&12x-30+30=-x-4+30tag{Add 30 to both sides} \\
&12x=-x+26tag{Simplify} \
&12x+x=-x+26+xtag{Add x to both sides } \
&13x=26tag{Simplify} \
&frac{13x}{13}=frac{26}{13}tag{Divide both sides by 13} \
&{color{#c34632}x=2}
end{align*}
$$
{color{#4257b2}text{b)}}
$$
$$
begin{align*}
left(x+1right)left(x-7right)=left(x-1right)left(x+3right)& {;}quad : x^2-6x-7=x^2+2x-3tag{Expand}\
&x^2-6x-7+7=x^2+2x-3+7tag{Add 7 to both sides} \\
&x^2-6x=x^2+2x+4tag{Simplify} \
&x^2-6x-left(x^2+2xright)=x^2+2x+4-left(x^2+2xright)tag{Subtract x2+2x from both sides } \\
&-8x=4tag{Simplify} \
&frac{-8x}{-8}=frac{4}{-8}tag{Divide both sides by -8} \
&{color{#c34632}x=-frac{1}{2}}
end{align*}
$$
color{#4257b2} text{ a) }x=2
$$
$$
color{#4257b2}text{ b) }x=-frac{1}{2}
$$
$textbf{(a)}$
$$
begin{align*}
g(x)&=x^3-2\
g(-5)&=(-5)^3-2\
g(-5)&=(-5cdot -5cdot -5) -2\
g(-5)&=-125-2\
&boxed{g(-5)=-127}
end{align*}
$$
$textbf{(b)}$
$$
begin{align*}
g(x)&=7+sqrt{4-x}\
g(-5)&=7+sqrt{4-(-5)}\
g(-5)&=7+sqrt{4+5}\
g(-5)&=7+sqrt{9}\
g(-5)&=7+3\
&boxed{g(-5)=10}
end{align*}
$$
$textbf{(c)}$
$$
begin{align*}
g(x)&=2^x\
g(-5)&=2^{-5}\
g(-5)&=dfrac{1}{2^5}\
&boxed{g(-5) =dfrac{1}{32}}
end{align*}
$$
$textbf{(d)}$
$$
begin{align*}
g(x)&=1.6x-0.476\
g(-5)&=1.6(-5)-0.476\
g(-5)&=-8-0.476\
&boxed{g(-5) =-8.476}
end{align*}
$$
$textbf{(b)}$ $g(-5) =10$
$textbf{(c)}$ $g(-5) =dfrac{1}{32}$
$textbf{(d)}$ $g(-5) =-8.476$
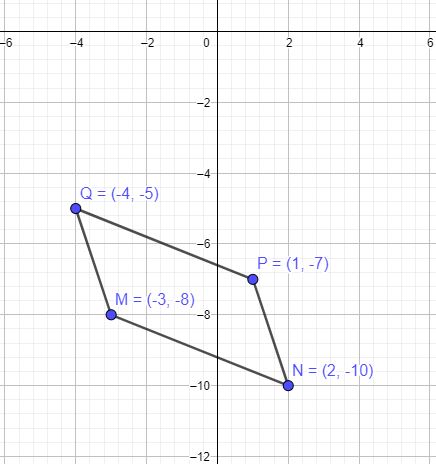
The procedure for finding the slope is explained below.
Slope of a line which passes through a pair or points $(x_1,y_1)$ and $(x_2,y_2)$ is given by
$$
text{slope}=dfrac{y_2-y_1}{x_2-x_1}
$$
Now, we need to pick two vertex points. Let the first pair of point are on segment PN which are $(2,-10)$ and $(1,-7)$. Let $(x_1,y_1)=(1,-7)$ and $(x_2,y_2)=(2,-10)$, therefore slope of line passing through these point is
$$
begin{align*}
text{slope}&= dfrac{-10-(-7)}{2-1}\
&=dfrac{-10+7}{1}\
&=-3
end{align*}
$$
Now, we need to pick vertex points on the opposite side that is on segment QM which are $(-3,-8)$ and $(-4,-5)$
Let $(x_1,y_1)=(-3,-8)$ and $(x_2,y_2)=(-4,-5)$, therefore slope of line passing through these point is
$$
begin{align*}
text{slope}&= dfrac{-5-(-8)}{-4-(-3)}\
&=dfrac{-5+8}{-4+3}\
&=dfrac{3}{-1}\
&=-3
end{align*}
$$
Hence, we can see that the sides QM and PM are parallel to each other as these are having same slope.
Similarly, we can prove for the sides QP and MN. As explained below with the attached figure of the quadrilateral MNPQ.
$$
begin{align*}
text{slope}&= dfrac{-7-(-5)}{1-(-4)}\
&=dfrac{-7+5}{1+4}\
&=dfrac{-2}{5}\
end{align*}
$$
Now, we need to pick vertex points on the opposite side that is on segment MN which are $(-3,-8)$ and $(2,-10)$
Let $(x_1,y_1)=(-3,-8)$ and $(x_2,y_2)=(2,-10)$, therefore slope of line passing through these point is
$$
begin{align*}
text{slope}&= dfrac{-10-(-8)}{2-(-3)}\
&=dfrac{-10+8}{2+3}\
&=dfrac{-2}{5}\
end{align*}
$$
Hence, we can see that the sides OP and MN are parallel to each other as these are having same slope. Therefore, indeed the given quadrilateral is a parallelogram.
$$
M(-3,-8) rightarrow M'(-3,8)
$$
$$
N(2,-10) rightarrow N'(2,10)
$$
$$
P(1,-7) rightarrow P'(1,7)
$$
$$
Q(-4,-5) rightarrow Q'(-4,5)
$$
The translated figure is attached below
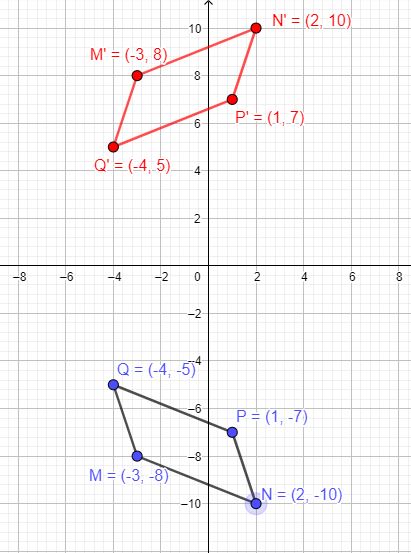
$textbf{(b)}$ On applying the function $(x rightarrow x, y rightarrow -y)$ the new coordinates become
$$
M(-3,-8) rightarrow M'(-3,8)
$$
$$
N(2,-10) rightarrow N'(2,10)
$$
$$
P(1,-7) rightarrow P'(1,7)
$$
$$
Q(-4,-5) rightarrow Q'(-4,5)
$$
$textbf{(c)}$ We can attain the shape of M’N’P’Q’ by rotating MNPQ 180$text{textdegree}$. but the name of the vertex points will be changed but still it will be rigid transformation as the shape, size and area is preserved.
$$
begin{align*}
dfrac{3}{200}+dfrac{x}{50}&=dfrac{7}{100} tag{multiply each side by 200}\
dfrac{3}{200}cdot 200+dfrac{x}{50}cdot 200&=dfrac{7}{100}cdot 200\
dfrac{200}{200}cdot 3+dfrac{200}{50}cdot x&=dfrac{200}{100}cdot 7\
3+4cdot x&=2cdot 7\
3+4x&=14 tag{subtract 3 from each side}\
3-3+4x&=14-3\
4x&=11tag{divide each side by 4}\
dfrac{4x}{4}&=dfrac{11}{4}\
&boxed {x=dfrac{11}{4}}
end{align*}
$$
x=dfrac{11}{4}
$$
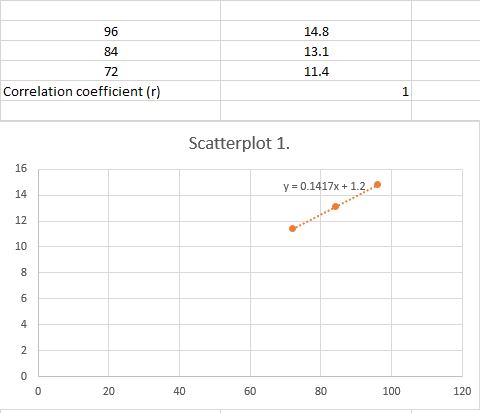
As we have a completely linear relationship between two sets, that is why we got value of correlation coefficients $=1$.


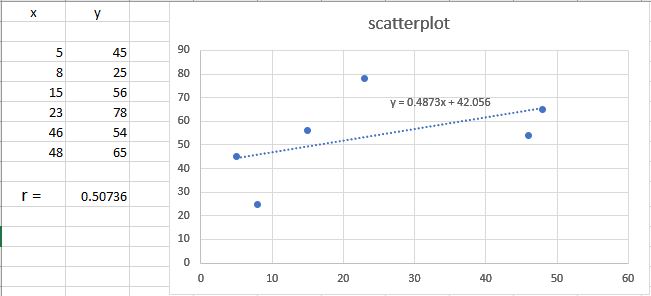
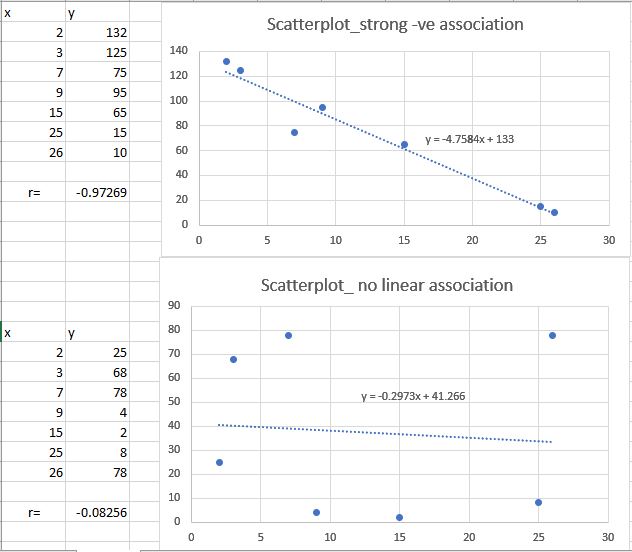
On the following picture, there are two random points whose line has a positive slope.
#### (b)
On the following picture, there are two random points whose line has a negative slope.
#### (c)
The conclusion is that the location of all possible points that results $r=1$ is on the line which passes through already graphed two points.
#### (d)
In this case, we conclude that $r$ is negative.
#### (e)
For example, if we add point $(3,25)$, we get that in this case $r=-0.1$.
The largest value of $r$ is $1$ and the smallest value is $-1$.
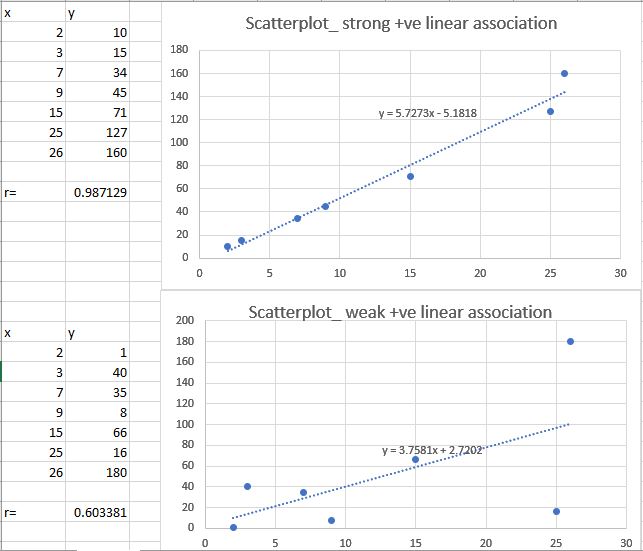
$r$ close to $1$ that values we have are very related. When $r$ is close to $0$, that means that there is a weak linear relationship between the data.
f) $-1leq rleq1$
Similarly, A positive value of correlation coefficient represent the positive relationship between the input and output that means when input is increasing then output should also increase . In other words the LSRL or the line of best fit for this situation has positive slope.
Using the above argument we can see that Scatterplots $textbf{(a.)}$ and $textbf{(d.)}$ should have negative value of correlation coefficients.
Scatterplots $textbf{(b.)}$ and $textbf{(c.)}$ should have positive value of correlation coefficients.
Now, A magnitude close to 1 represents more stronger linear relationship between points on the graph and a magnitude value close to 0 represents more scattered points and very weak correlation between the points on the plot.
Using this argument we can now assign the given value of $r$ to the respective scatterplots which is shown below.
$$
begin{align*}
(r=-0.9) rightarrow text{(a.)}\
(r=-0.6) rightarrowtext{(d.)}\
(r=0.1) rightarrow text{(b.)}\
(r=0.6) rightarrow text{(c.)}
end{align*}
$$
begin{align*}
(r=-0.9) rightarrow text{(a.)}\
(r=-0.6) rightarrowtext{(d.)}\
(r=0.1) rightarrow text{(b.)}\
(r=0.6) rightarrow text{(c.)}
end{align*}
$$
text{Correlation Coefficient}, r
$$
A positive value of correlation coefficient represent the positive relationship between the input and output that means when input is increasing then output should also increase and a negative value of correlation coefficient represent the inverse relationship between the input and output that means when input is increasing then output should decrease.
A magnitude of correlation coefficient $r$ close to 1 represents more stronger linear relationship between the data points and a magnitude value close to 0 represents more scattered points and very weak correlation between the data points.
A magnitude of correlation coefficient $r$ close to 1 represents more stronger linear relationship between the data points and a magnitude value close to 0 represents more scattered points and very weak correlation between the data points.
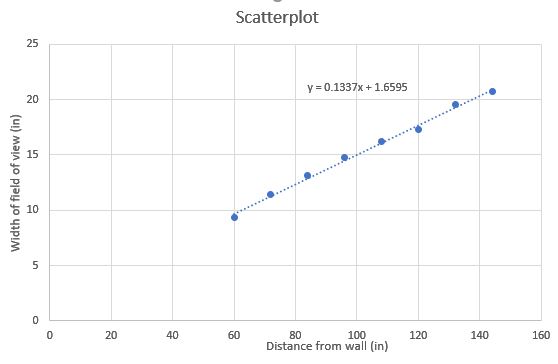
On the following picture, there are graphed given data and the best fit line.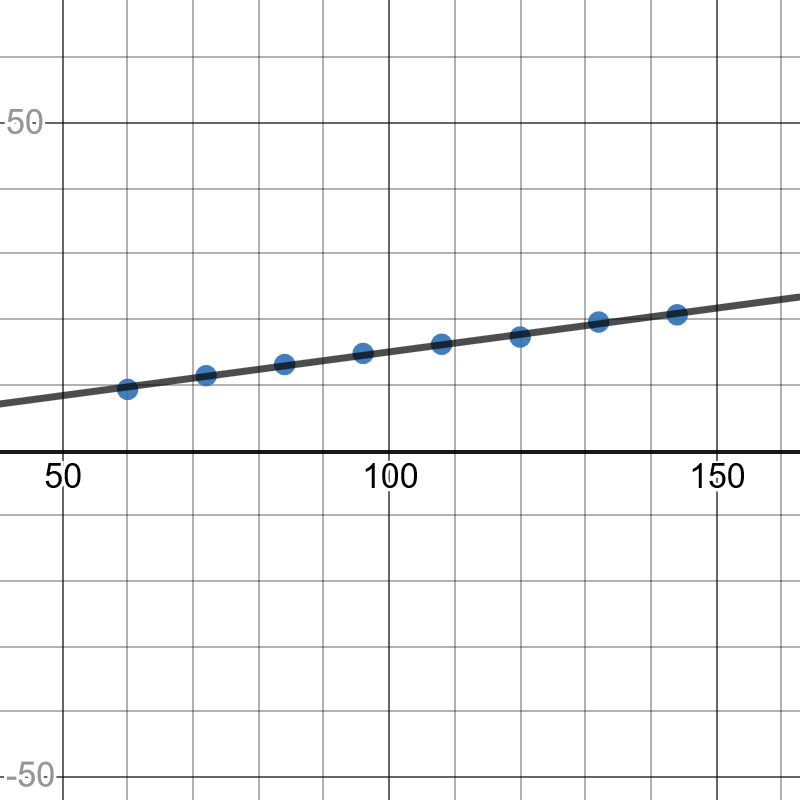
#### (b)
Here, the form is linear, direction is the slope, it is $0.13$, the strength is $r$ it is strong.
#### (c)
We can conclude that the form is linear, the direction is increasing and the strength is very strong.
Now, we chose data point $(15,160)$ to drag it and change its value to draw the separate 4 sets of Scatterplot $C_1$ to $C_4$ and observe the effect on the slopes and the correlation coefficients.
From the sactterplots we can observe that the change in the single value can also affect the slope and the correlation coefficient if the change in the value is very big as we can observe that slope in scatterplot $C_1$ and $C_2$ is negative while it changes to positive in scatterplot $C_3$ and $C_4$.
Similarly, the correlation coefficient becomes smaller and smaller as that point grew as outlier.
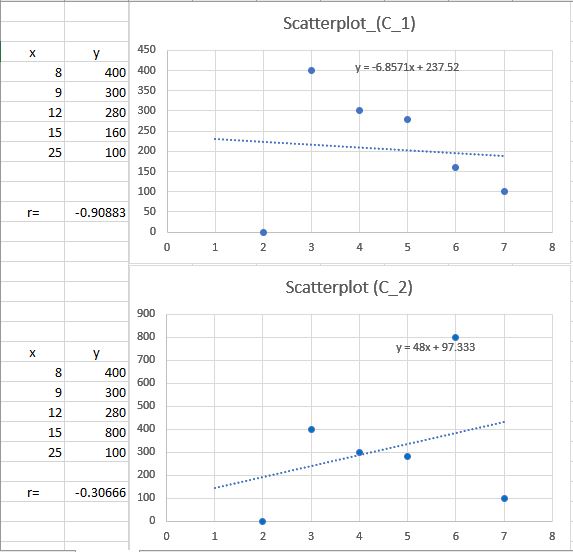
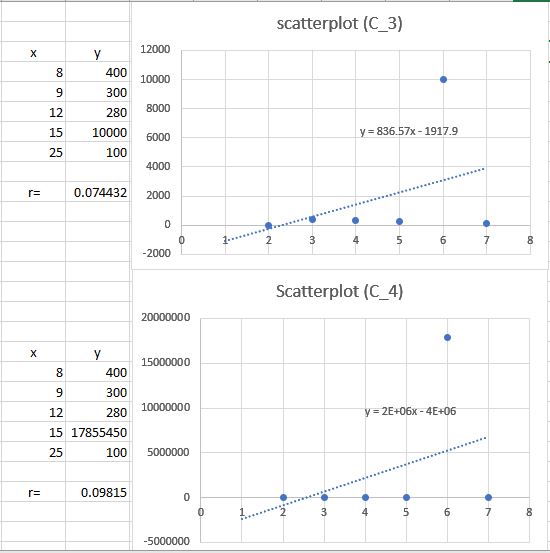
The scatterplots for each part is attached inside and for explicit explanation of each part see inside.
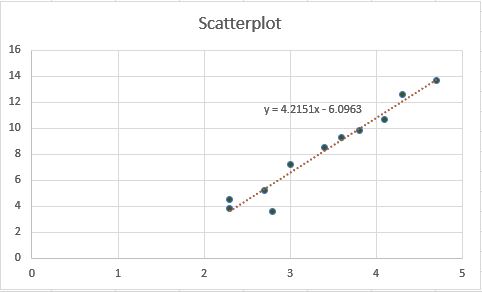
$textbf{(e)}$ Using the LSRL equation we can find the length of the pencil of given weight 6g cm.
$$
begin{align*}
y&=4.2151cdot(6) -6.963\
&=25.2906-.963\
&= 18.3276 text{cm}\
end{align*}
$$
Given that the original pencil had 16.8 cm of paint hence the residual is
$$
16.8-18.3276=-1.5276
$$
Now, using the precision of the given data answer should be given in one decimal place. Therefore residual $=-1.5$
$textbf{(f)}$ positive residual means that the estimated answer given by the LSRL equation is lower than the actual value.
$textbf{(d)}$ Yes, it seem appropriate to use linear model to make predictions about the weight of pencil as the residual’s magnitude are small except for one or two cases.
$textbf{(e)}$ -1.5
$textbf{(f)}$ positive residual means that the estimated answer given by the LSRL equation is lower than the actual value.
{color{#4257b2}text{a)}}
$$
$$
begin{align*}
frac{11}{15}+left(-frac{3}{4}right)& {=}quad : frac{11}{15}-frac{3}{4}tag{Remove parentheses}\
&=frac{11cdot :4}{60}-frac{3cdot :15}{60} \
&=frac{4cdot :11-3cdot :15}{60} \
&=frac{-1}{60} \
&={color{#c34632}-frac{1}{60}}
end{align*}
$$
$$
color{#c34632} text{ }mathrm{Apply:the:fraction:rule}:quad frac{-a}{b}=-frac{a}{b}
$$
$$
text{ }
$$
$$
text{ }
$$
{color{#4257b2}text{b)}}
$$
$$
begin{align*}
-5frac{2}{9}-2frac{1}{3}& {=}quad : -frac{47}{9}-frac{7}{3}\
&-5frac{2}{9}=frac{5cdot 9+2}{9}=frac{47}{9} tag{Simplify}\
&2frac{1}{3}=frac{2cdot 3+1}{3}=frac{7}{3} tag{Simplify}\
&=-frac{47}{9}-frac{7cdot :3}{9} \
&=frac{-47-3cdot :7}{9}=frac{-68}{9}=-frac{68}{9} \
&={color{#c34632}-7frac{5}{9}}
end{align*}
$$
$$
color{#c34632} text{ } mathrm{Apply:the:fraction:rule}:quad frac{-a}{b}=-frac{a}{b}
$$
$$
text{ }
$$
$$
text{ }
$$
{color{#4257b2}text{c)}}
$$
$$
begin{align*}
-frac{7}{8}+frac{2}{3}-left(-frac{1}{4}right)& {=}quad : -frac{7}{8}+frac{2}{3}+frac{1}{4}\
&=-frac{7cdot :3}{24}+frac{2cdot :8}{24}+frac{1cdot :6}{24} \
&=frac{-3cdot :7+2cdot :8+1cdot :6}{24} \
&={color{#c34632}frac{1}{24}}
end{align*}
$$
$$
color{#c34632} text{ }mathrm{Apply:rule}:-left(-aright)=a
$$
$$
text{ }
$$
$$
text{ }
$$
{color{#4257b2}text{d)}}
$$
$$
begin{align*}
-3div frac{1}{4}& {=}quad : =-frac{3cdot :4}{1}\
&=-frac{12}{1} \
&={color{#c34632}-12}
end{align*}
$$
$$
color{#c34632} text{ } mathrm{Apply:the:fraction:rule}:quad frac{a}{frac{b}{c}}=frac{acdot :c}{b}
$$
$$
color{#c34632} text{ }mathrm{Apply:rule}:frac{a}{1}=a
$$
$$
text{ }
$$
color{#4257b2}text{ a) }-frac{1}{60}
$$
$$
color{#4257b2} text{ b) }-7frac{5}{9}
$$
$$
color{#4257b2}text{ c) } frac{1}{24}
$$
$$
color{#4257b2} text{ d) }-12
$$
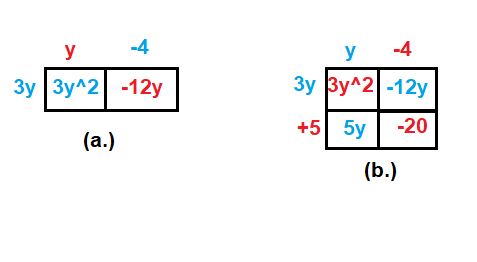
$textbf{(a)}$ $bullet$ The dimensions for the figure is as follows
$$
text{length}=y-4
$$
$$
text{width}=3y
$$
$bullet$ Area as sum of its parts
$$
begin{align*}
text{Area}&=3y^2-12y
end{align*}
$$
$bullet$ Area as product of the dimensions
$$
begin{align*}
text{Area}&=3ycdot(y-4)\
&=3y(y)+3y(-4)\
&=3y^2-12y
end{align*}
$$
$textbf{(b)}$ $bullet$ The dimensions for the figure is as follows
$$
text{length}=y-4
$$
$$
text{width}=3y+5
$$
$bullet$ Area as sum of its parts
$$
begin{align*}
text{Area}&=3y^2-12y+5y-20\
&=3y^2-7y-20
end{align*}
$$
$bullet$ Area as product of the dimensions
$$
begin{align*}
text{Area}&=(y-4)cdot(3y+5)\
&=ycdot(3y+5)-4cdot (3y+5)\
&=y(3y)+y(5) -4(3y)-4(5)\
&=3y^2+5y-12y-20\
&=3y^2-7y-20
end{align*}
$$
$$
text{Dimensions (length, width)}=(y-4,3y)
$$
$$
text{Area}=3y^2-12y
$$
$textbf{(b)}$
$$
text{Dimensions (length, width)}=(y-4,3y+5)
$$
$$
text{Area}=3y^2-7y-20
$$
$$
y=mcdot x+c
$$
Where $m$ represents the slope of line and $c$ represents the y-intercept.
$textbf{(a)}$ $2x+7y= 14$ can be written in the general form as shown below
$$
begin{align*}
2x&+7y=14\
7y&=-2x+14\
y&=dfrac{-2}{7}+2
end{align*}
$$
Therefore, Slope of the above line is $dfrac{-2}{7}$ and y-intercept is 2
$textbf{(b)}$ Given equation of line is $y=6-dfrac{x}{3}$ which can be written in the general form as
$$
y=-dfrac{1}{3} x+6
$$
Therefore, Slope of the above line is $-dfrac{1}{3}$ and y-intercept is 6
$textbf{(c)}$ $y=dfrac{10x-2}{2}$ can be simplified and rewritten as
$$
y=5x-1
$$
Therefore, Slope of the above line is $5$ and y-intercept is -1
$textbf{(d)}$ $y=3x$ is already in general form with $c=0$
Therefore, Slope of the above line is $3$ and y-intercept is 0
$textbf{(b)}$ Slope $=dfrac{-1}{3}$ and y-intercept $=6$
$textbf{(c)}$ Slope $=5$ and y-intercept $=-1$
$textbf{(d)}$ Slope $=3$ and y-intercept $=0$
$$
begin{align*}
text{Cost}&=0.7375 dfrac{ $}{ text{ inch}} times 50 text{ inch}\
&=(0.7375times 50) dfrac{$}{ text{inch}} times text{ inch}\
&=$36.875
end{align*}
Therefore, the local deli should charge $36.875 for a 50 inches long sub sandwich.\\
Now, we need to find the unit rate in dollars per foot. We know that 1 foot equals 12 inches. We have cost per inch as $0.7375, so cost of 12 inches sub sandwich can be found out by multiplying it the cost per inch with 12.\
$$
Rightarrow$text{Cost per foot} = 0.7375times 12 = $8.85$$
Cost per foot$=$8.85$
$$
textbf{(a)}
$$
$$
begin{align*}
8^x&=2^6\
(2^3)^x&=2^6 tag{use $(a^m)^n=a^{mcdot n}$}\
2^{2cdot x}&=2^6\
2^{2x}&=2^6\
Rightarrow\
2x&=6tag{divide each side by 2}\
&boxed{x=3}
end{align*}
$$
$$
textbf{(b)}
$$
$$
begin{align*}
4^{2x}&=(dfrac{1}{2})^{x+5}\
(2^2)^{2x}&=(dfrac{1}{2})^{x+5} tag{use $(a^m)^n=a^{mcdot n}$}\
2^{4x}&=(dfrac{1}{2})^{x+5}tag{use $a^{-m}=dfrac{1}{a^m}$}\
Rightarrow\
2^{4x}&=2^{-(x+5)} tag{equating the powers}\
4x&=-(x+5)\
4x&=-x-5tag{add $x$ to each side}\
4x+x&=-x+x-5\
5x&=-5tag{divide each side by 5}\
dfrac{5x}{5}&=dfrac{-5}{5}\
&boxed{x=-1}
end{align*}
$$
$textbf{(b)}$ $x=-1$
Here we can conclude that here we have the curved residual plot, so, it indicates that there is used a curve line of the best fit.
#### (b)
The worst prediction can cause that original data is in a linear relationship.
#### (c)
The original scatterplot might have looked like a curve line.
$textbf{(b)}$ The decision taken by the mayer is wrong. The number of firefighters at the scene is dependent on how big the fire is and hence the amount of damage. It does not signify that the more number of firefighter cause the damage to the scene. The presence of number of firefighter at the place of fire is secondary result of a big fire. The mayor misunderstood the conveyed information.
$textbf{(b)}$ The decision taken by the mayer is wrong. The number of firefighters at the scene is dependent on how big the fire is and hence the amount of damage. It does not signify that the more number of firefighter cause the damage to the scene. The presence of number of firefighter at the place of fire is secondary result of a big fire. The mayor misunderstood the conveyed information.
The reason for this association is that there is strong chance that the people adding spinach in their diet are already eating a healthy diet and more concerned with their health which is the reason for their muscles and increased strength.
$textbf{(b)}$ The reason for this association is that spinach has some benefits and considered as one of the healthy food.The diet and health conscious people are more inclined to add spinach in their diet. They are already living a healthy life and spinach is just a single part of their diet.
$textbf{(b)}$ The reason for this association is that spinach has some benefits and considered as one of the healthy food.The diet and health conscious people are more inclined to add spinach in their diet. They are already living a healthy life and spinach is just a single part of their diet.
$textbf{a.}$ People may be health conscious so they more likely include calcium intake and be more healthy.
$textbf{b.}$ Busy work schedules or study schedules may be a factor as to why family time declines.
$textbf{c.}$ It is more likely the other way around: People who are depressed eat chocolates to feel good. Since eating too much chocolates can result in weight gain, it might be the reason why people who eat them are depressed.
$textbf{d.}$ Often times, kids are spanked due to misbehavior. This may result in such kids having a hard time in school resulting in lower IQs.
$textbf{e.}$ People may not afford health insurance due to poverty.
b. Busy work schedules or study
c. Weight gain in eating chocolates, not the chocolate itself.
d. Misbehavior of students
e. Poverty
1st statement: Playing video games causes violent behavior.
2nd statement: Parents protest: Ban video games!
1st statement: Study shows that marriage leads to a happier life.
2nd statement: All people should marry.
1st statement: Study shows that marriage leads to a happier life.
2nd statement: All people should marry.
Statement: Water boils at $100^{circ}$C.
The second statement can be the following:
Statement: Chocolate is salty.
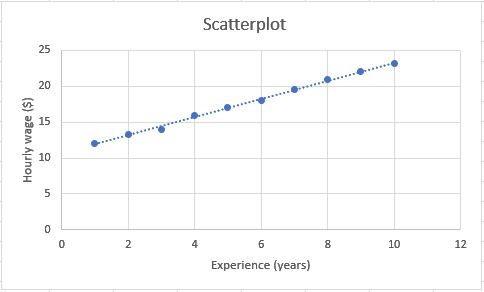
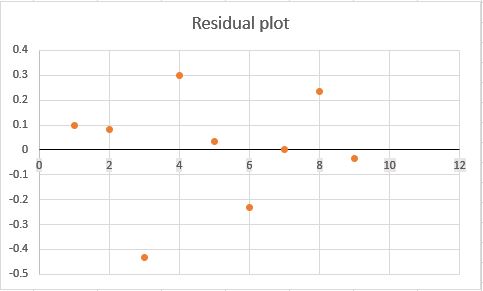
$textbf{(b)}$ Yes, linear model is appropriate as magnitudes of residuals are very small.
$textbf{(c)}$ Correlation coefficient in this case is 0.9984 which is very close to 1. This signifies that there is very strong and positive correlation between hourly wages and work experience which means with increase in the experience the daily wage of a person increases definitely.
$textbf{(b)}$ The formula for calculating residual is
$$
text{residual}=text{actual}-text{predicted}
$$
. Therefore, the residual for the attendance when temperature were in the 80s for her model is positive which means the value of actual attendance is lower than the predicted attendance. hence, the predictions made by Marissa’s model to is too low when temperature were in 80s.
$textbf{(c)}$ First we need to calculate the predicted value of attendance via Marissa model by putting $t=95$ into the LSRL equation.
$$
begin{align*}
a&=-14+0.41t\
a&=-14+0.41(95)\
a&=-14+38.95\
a&=24.95
end{align*}
$$
As attendance is in 1000s, so we need to multiply it by 1000 for the final predicted value of attendance.
$Rightarrow$ predicted value $=24.95times1000=24950$
Now, from the residual plot, we can see that the residual for attendance when the temperature is 95 is given as $-8times 1000=-8000$. So we can calculate the actual value of attendance by applying the formula
$$
text{residual}=text{actual}-text{predicted}
$$
$Rightarrow$
$$
begin{align*}
text{residual}=text{actual}-text{predicted}\
-8000&=text{actual}-24950\
-8000+24950&=text{actual}\
text{actual}&=16950
end{align*}
$$
Therefore, the actual attendance on the day when the temperature was $text{textdegree}$ 95 is close to 16950.
$bullet$ Calculating upper bound
$$
begin{align*}
a&=-7+0.41t\
a&=-7+0.41(80)\
a&=-7+32.8\
a&=25.8tag{multiply by 1000, for final attendance}\
Rightarrow
a&=25800
end{align*}
$$
$bullet$ Calculating lower bound
$$
begin{align*}
a&=-21+0.41t\
a&=-21+0.41(80)\
a&=-21+32.8\
a&=11.8tag{multiply by 1000, for final attendance}\
Rightarrow
a&=11800
end{align*}
$$
$textbf{(e)}$ The residual values for Marissa’s model is very high. For most of the predicted values her model has a residual whether positive or negative. A better model is such that at least it should be correct of for some of the part without a residual of a very small value of residual. That is why her model does not seems reliable for making predictions.
$textbf{(b)}$ The predictions made by Marissa’s model to is too low when temperature were in 80s.
$textbf{(c)}$The actual attendance on the day when the temperature was $text{textdegree}$ 95 is close to 16950.
$textbf{(d)}$ 11800 and 25800
$textbf{(e)}$ The residual values for Marissa’s model is very high. For most of the predicted values her model has a residual whether positive or negative. A better model is such that at least it should be correct of for some of the part without a residual of a very small value of residual. That is why her model does not seems reliable for making predictions.
Use the exponent rule: $a^{-n}=dfrac{1}{a^n}$
$$
2^3cdot 5^{-2}=2^3cdot dfrac{1}{5^{2}}
$$
Multiply:
$$
= dfrac{2^3}{5^{2}}
$$
Evaluate:
$$
= color{#c34632}dfrac{8}{25}
$$
$textbf{b.}$
Use the exponent rules: $(ab)^n=a^nb^n$ and $(a^{m})^n=a^{mn}$
$$
(xy^2)^3cdot (x^{-2})=x^3y^6cdot (x^{-2})
$$
Use the exponent rule: $a^{m}cdot a^n=a^{m+n}$
$$
=color{#c34632}xy^6color{white}tag{1}
$$
Group the decimals and group the powers using associative property:
$$
3times 10^3cdot 4times 10^5=(3cdot 4)times (10^{3}cdot 10^{5})
$$
Use the exponent rule: $a^{m}cdot a^n=a^{m+n}$
$$
=12times 10^8
$$
Write in scientific notation. The decimal part must be greater than or equal to 1 and less than 10 so we move 1 place to the left then add 1 to the power of 10:
$$
=color{#c34632}1.2times 10^9
$$
$textbf{d.}$
Group the decimals and group the powers using associative property:
$$
dfrac{4times 10^2}{5times 10^{-2}}=dfrac{4}{5}times dfrac{10^{2}}{10^{-2}}
$$
Use the exponent rule: $dfrac{a^{m}}{a^n}=a^{m-n}$
$$
=0.8times 10^4
$$
Write in scientific notation. The decimal part must be greater than or equal to 1 and less than 10 so we move 1 place to the right then subtract 1 from the power of 10:
$$
=color{#c34632}8times 10^3
$$
b. $xy^6$
c. $1.2times 10^9$
d. $8times 10^3$
{color{#4257b2}text{a)}}
$$
$$
begin{align*}
2^3cdot :5^{-2}& {=}quad : 2^3cdot frac{1}{5^2}\
&frac{1cdot :2^3}{5^2}=frac{2^3}{5^2}=frac{2^3}{5^2}\
&={color{#c34632}frac{8}{25}}
end{align*}
$$
$$
color{#c34632} text{ } mathrm{Apply:exponent:rule}:quad :a^{-b}=frac{1}{a^b}
$$
$$
color{#c34632}text{ }mathrm{Multiply:fractions}:quad :acdot frac{b}{c}=frac{a:cdot :b}{c}
$$
{color{#4257b2}text{b)}}
$$
$$
begin{align*}
left(xy^2right)^3left(x^{-2}right)& {=}quad :left(xy^2right)^3x^{-2} tag{Remove parenthese}\
&=x^3y^6x^{-2} \
&={color{#c34632}xy^6}
end{align*}
$$
$$
color{#c34632} text{ }mathrm{Apply:exponent:rule}:quad :a^bcdot :a^c=a^{b+c}
$$
$$
text{ }
$$
{color{#4257b2}text{c)}}
$$
$$
begin{align*}
3cdot :10^3cdot :4cdot :10^5& {=}quad : 3cdot :2^3cdot :5^3cdot :2^2left(2cdot :5right)^5tag{Factor integer}\
&=3cdot :2^3cdot :5^3cdot :2^2cdot :2^5cdot :5^5 \
&=2^{10}cdot :3cdot :5^5cdot :5^3 \
&={color{#c34632}2^{10}cdot :3cdot :5^8}
end{align*}
$$
$$
color{#c34632} text{ } mathrm{Apply:exponent:rule}:quad left(abright)^c=a^cb^c
$$
$$
color{#c34632} text{ } mathrm{Apply:exponent:rule}:quad :a^bcdot :a^c=a^{b+c}
$$
$$
color{#c34632} text{ }mathrm{Apply:exponent:rule}:quad :a^bcdot :a^c=a^{b+c}
$$
$$
text{ }
$$
{color{#4257b2}text{d)}}
$$
$$
begin{align*}
frac{4cdot :10^2}{5cdot :10^{-2}}& {=}quad : frac{4cdot :10^4}{5}\
&=frac{2^4cdot :4cdot :5^4}{5} \
&={color{#c34632}2^4cdot :4cdot :5^3}
end{align*}
$$
$$
color{#c34632} text{ }mathrm{Apply:exponent:rule}:quad frac{x^a}{x^b}:=:x^{a-b}
$$
$$
text{ }
$$
$$
text{ }
$$
color{#4257b2} text{ a) }frac{8}{25}
$$
$$
color{#4257b2} text{ b) }xy^6
$$
$$
color{#4257b2} text{ c) }2^{10}cdot :3cdot :5^8
$$
$$
color{#4257b2} text{ d) }2^4cdot :4cdot :5^3
$$
$$
text{ }
$$
$$
text{ }
$$
$textbf{a.}$
The solid points at the end of the segment mean that those points are part of the domain and range. Horizontally, the graph is from $-2$ to 2 so the domain is:
$$
color{#c34632}-2leq xleq 2
$$
Vertically, the graph is from $-3$ to 2 so the range is:
$$
color{#c34632}-3leq yleq 2
$$
$textbf{b.}$
A vertical line suggests that there is only a single value for $x$. So, the domain is:
$$
color{#c34632}x=2
$$
Vertically, the graph extends below and above so the range is:
$$
color{#c34632}text{all real numbers}
$$
$textbf{c.}$
The solid point at the left end of the graph means that the point is part of the domain. Horizontally, the graph is from $-2$ extending to the right so the domain is:
$$
color{#c34632} xgeq -2
$$
Vertically, the graph extends down to the right and up to the right so the range is:
$$
color{#c34632}text{all real numbers}
$$
$textbf{d.}$
Only graph (a) is a function because for every $x$-value, there is only one $y$-value corresponding to it.
b. D: $x=2$ ; R: all real numbers
c. D: $xgeq -2$ ; R: all real numbers
d. Graph a
Range $rightarrow (-3,2)$
$textbf{(b)}$ Domain $rightarrow x=2$
Range $rightarrow (-infty,infty)$
$textbf{(c)}$ Domain $rightarrow (-2, infty)$
Range $rightarrow (-infty,infty)$
$textbf{(d)}$ For a relation to represent a function there should be only one output corresponding to an input. Therefore, only graph $textbf{(a)}$ represents a function.
$textbf{(a)}$
$$
begin{align*}
f(x)&=4^x+1\
f(0)&=4^0+1tag{use $a^0=1$}\
f(0)&=1+1\
&boxed{f(0)=2}
end{align*}
$$
$textbf{(b)}$ The value of $sqrt[3]{-27}=sqrt[3]{-3cdot -3cdot -3}=-3$
Therefore, we need to find $f(-3)$ which can be proceeded as shown below.
$$
begin{align*}
f(x)&=4^x+1\
f(sqrt[3]{-27})&=4^{-3}+1tag{use $a^{-m}=dfrac{1}{a^m}$}\
f(sqrt[3]{-27})&=dfrac{1}{4^{3}}+1\
f(sqrt[3]{-27})&=dfrac{1}{64}+1\
f(sqrt[3]{-27})&=dfrac{1+64}{64}tag{by taking LCM }\
&boxed{f(sqrt[3]{-27})=dfrac{65}{64}}
end{align*}
$$
$textbf{(c)}$ To find the value of $x$ if $f(x)=17$
$$
begin{align*}
f(x)&=4^x+1\
17&=4^x+1tag{subtract 1 from each side}\
17-1&=4^x+1-1\
16&=4^x\
4^2&=4^xtag{compare powers as base is same}\
2&=x\
&boxed{x=2}
end{align*}
$$
$textbf{(b)}$ $dfrac{65}{64}$
$textbf{(c)}$ $2$
$$
text{slope}=dfrac{y_2-y_1}{x_2-x_1}
$$
Now, we have given points as $(-3,1)$ and $(9,7)$. Let $(x_1,y_1)=(-3,1)$ and $(x_2,y_2)=(9,7)$, therefore slope of line passing through these point is
$$
begin{align*}
text{slope}&= dfrac{7-1}{9-(-3)}\
&=dfrac{6}{12}\
&=dfrac{1}{2}
end{align*}
$$
The equation of a line of given slope $m$ passing through a point $(x_1,y_1)$ is given by
$$
y-y_1=mcdot (x-x_1)
$$
Therefore, the equation of a line of slope $dfrac{1}{2}$ passing through a point $(9,7)$ is given by
$$
begin{align*}
y-(7)&=dfrac{1}{2}cdot (x-9)\
y-7&=dfrac{1}{2}cdot x + dfrac{1}{2}cdot -9\
y&=dfrac{1}{2}cdot x +dfrac{-9}{2}+7\
y&=dfrac{1}{2}cdot x +dfrac{-9+14}{2}\
&boxed{y=dfrac{1}{2}cdot x +dfrac{5}{2}}
end{align*}
$$
y=dfrac{1}{2}cdot x +dfrac{5}{2}
$$
Unlike coefficient of correlation($r$), coefficient of determination($text{R}^2$) varies between 0 to 1 as it is a square of a value between -1 to 1. Coefficient of determination indicates the extent to which the dependent variable is predictable.
If $text{R}^2=0$ then it means that dependent variable cannot be predicted from the independent variable. And $text{R}^2=1$ means that the dependent variable can be exactly predicted from the independent variable without any error.
For example $text{R}^2=0.25$ means that 25 percent of the variance in output $y$ is
predictable from the input $x$.
$textbf{(a)}$ The electronically calculated (from excel) value of $text{R}^2$ for the given data is equal to $0.8616approx0.86$ which means that the 86 percent variance in height can be predicted by the shoe size.
$textbf{(b)}$ The other factor affecting the height of a person can be
$bullet$ Genes from the family
$bullet$ Sex of the person
$bullet$ Age
$bullet$ Body weight
$textbf{(b)}$ The other factor affecting the height of a person can be
$bullet$ Genes from the family
$bullet$ Sex of the person
$bullet$ Age
$bullet$ Body weight
This is unusual as foot size cannot be perfectly linearly related with the height as there are many other deciding factors.
Hence, the association between the height and the shoe size is very strong, positive and linear , which means with the increase in height the shoe size is linear.
$textbf{(b)}$ The height of students in her class varies between 153 cm to 170 cm with average height of student 62.8 cm.
The sex can be also a deciding factor, students engaged in active sports like basket ball are taller than the average.
$textbf{(b)}$ The height of students in her class varies between 153 cm to 170 cm with average height of student 62.8 cm.
The sex can be also a deciding factor, students engaged in active sports like basket ball are taller than the average.
As the value of correlation coefficient is close to zero, which means its square is also close to zero which means that coefficient of determination $text(R)^2$ is close to 0 and hence a very less percentage of variability in girls height can be predicted by their score in the Chapter 5 Test.
$textbf{(b)}$ The line of best best should be a horizontal line dividing the completely scattered points in equal halves so that the residual magnitudes and the number of points above and below to the line of best fit should be same.
As it is given that the average height of girls in her cass is 162 cm So, the equation of line of best fit should be $y=162$ where $y$ is the girls height in cms which is almost independent of $x$.
$$
y=1.3571x+7.7411
$$
where $y$ is the price of pizza in dollars and $x$ represents the number of topping on the pizza.
$y$-intercept in this context represents the price of a pizza if there is 0 toppings on it.
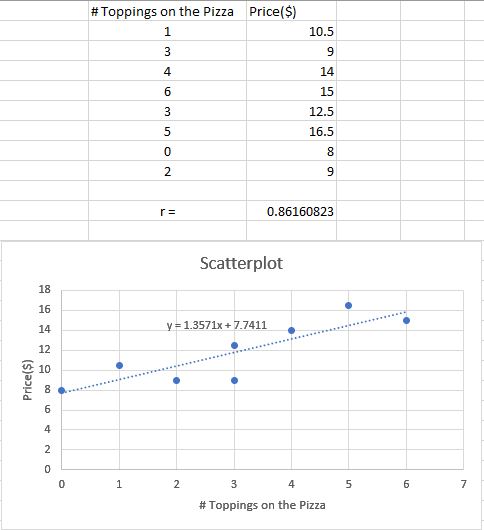
$$
R^2=rtimes r=0.8616^2=0.7423
$$
$textbf{(c)}$ The slope of of the LSRL is positive and hence the association between price and the toppings on the pizza is positive which means as the toppings on the pizza increases the price also increases.
The value of $R^2$ is $0.7423$ which means approximately 74 percent of variation is price can be predicted by number of toppings on the pizza. Which signifies that the strength of the association is strong.
$textbf{(b)}$ Correlation coefficient $(r)$ for this data is $0.8616$, and hence the coefficient of determination $R^2$ for this data will be
$$
R^2=rtimes r=0.8616^2=0.7423
$$
$textbf{(c)}$ The slope of of the LSRL is positive and hence the association between price and the toppings on the pizza is positive. The value of $R^2$ is $0.7423$ which means approximately 74 percent of variation is price can be predicted by number of toppings on the pizza. Which signifies that the strength of the association is strong.
$$
7.00 for a cheese pizza plus $1.50 for each additional topping.\
The points for the scatterplot can be calculated as shown below
begin{align*}
text{Pizza with 0 toppings }&rightarrow 7 \
text{Pizza with 1 topping }&rightarrow 7+1.5times 1=8.5\
text{Pizza with 2 toppings }&rightarrow 7+1.5times 2=10\
text{Pizza with 3 toppings }&rightarrow 7+1.5times 3=11.5\
text{Pizza with 4 toppings }&rightarrow 7+1.5times 4=13
end{align*}
Let
$$
x$represents the number of toppings on the pizza and$y$represent the price of pizza in $ then the scatterplot for this data can be drawn and LSRL equation can be calculated as shown on the plot below.\The LSRL equation from the plot is$y=1.5+7$\ The slope of LSRL is$1.5$which represent the change in the price of pizza per increase in the number of topping and$y$-intercept for this line is$7$ which represents the price of pizza if there is not any topping on the pizza.
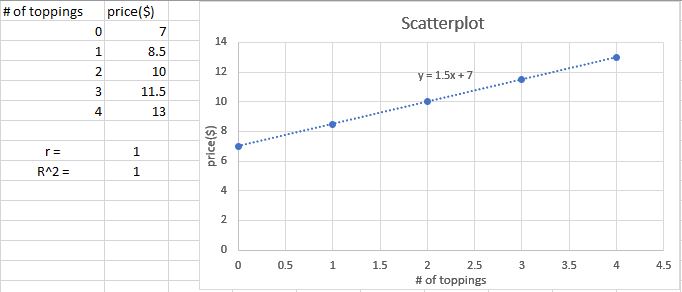
The variation in the previous question was 74 percent accurately predicted by the variation in the number of toppings because it was not a perfectly linear relationship and In problem 4-95 there may the other factors also which decides the price of a pizza.
The slope of LSRL is $1.5$ which represent the change in the price of pizza per increase in the number of topping and $y$-intercept for this line is $7$ which represents the price of pizza if there is not any topping on the pizza.
$textbf{(b)}$ The value of both $r$ and $R^2$ is 1 as there is perfectly linear relationship between price and number of toppings on the pizza and 100 percent variation in price can be predicted by the number of topping on the pizza.
The variation in the previous question was 74 percent accurately predicted by the variation in the number of toppings because it was not a perfectly linear relationship and In problem 4-95 there may the other factors also which decides the price of a pizza.
Description of Association in a scatterplot should always include description of the following.
$bullet$ Form $rightarrow$ Which tells about linearity or non-linearity which can be predicted seeing the shape of the graph as well as coefficient of correlation $(r)$
$bullet$ Direction $rightarrow$ Which tells about if the association is positive or negative and can be seen via graph and numerically detemined using the slope of LSRL.
$bullet$ Strength $rightarrow$ Which tells about if the association is strong, weak or not at all. This can be numerically determined using the value of $R^2$
$$
y=1.3571x+7.7411
$$
where $y$ is the price of pizza in dollars and $x$ represents the number of topping on the pizza.
$bullet$ The slope of LSRL is positive and hence $textbf{Direction}$ in this case is positive.
$bullet$ The value of $r$ is $0.8616$ which is close to 1 which signifies that the $textbf{Form}$ in this case is almost linear.
$bullet$ The value of $R^2$ is $0.7423$ which signifies that the $textbf{Strength}$ in this case is strong as approximately 74 percent of variation is price can be predicted by number of toppings on the pizza.
$$b=dfrac{n(sum xy)-(sum x)(sum y)}{n(sum x^2)-(sum x)^2}$$
In the terms of $a$ and $b$ the LSRL equation is given by $$y=bx+a$$
The table of values is attached below.\\
begin{tabular}{ |p{1.5cm}|p{3cm}|p{3cm}|p{1cm}|p{1cm}|p{1cm}| }
hline
Serial & supplement $(x)$ & cold lasted $(y)$ &$xy$ & $x^2$ & $y^2$\
hline
1 & 0.5 & 4.5 &2.25 & 0.25 & 20.25\
hline
2& 2.5 & 1.6 &4 & 6.25 & 2.56\
hline
3 & 1& 3 &3 & 1 & 9\
hline
4 & 2 &1.8 &3.6 & 4 & 3.24\
hline
5 & 0.5 & 5 &2.5 & 0.25 & 25\
hline
6 & 1 & 4.2 &4.2 & 1 & 17.64\
hline
7 & 2 & 2.4 &4.8 & 4 & 5.76\
hline
8 & 1 & 3.6 &3.6 & 1 & 12.96\
hline
9 & 1.5 &3.3 &4.95 & 2.25 & 10.89\
hline
10 & 2.5 & 1.4 &3.5 & 6.25 & 1.96\
hline
$sum$ & 14.5 & 30.8 &36.4& 26.25 & 109.26\
hline
end{tabular}
$$
begin{align*}
a&=dfrac{(30.8)(26.25)-(14.5)(36.4)}{10(26.25)-(14.5)^2}\
a&=dfrac{808.5-527.8}{262.5-210.25}\
a&=dfrac{280.7}{52.25}\
a&=5.372248\
a&=5.3722tag{On estimating }
end{align*}
$$
$$
begin{align*}
b&=dfrac{10(36.4)-(14.5)(30.8)}{10(26.25)-(14.5)^2}\
b&=dfrac{364-446.6}{26.5-210.25}\
b&=dfrac{-82.6}{52.25}\
b&=-1.5808612\
b&=-1.5809tag{On estimating }
end{align*}
$$
Therefore, After putting $a=5.3722$ and $b=-1.5809$, the final equation of LSRL becomes
$$
boxed{y=-1.5809x+5.3722}
$$
The scatterplot along with the electronically (via Excel) calculated value is attached below.
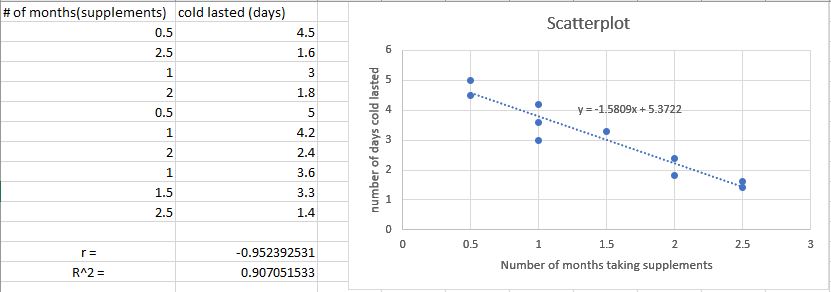
$textbf{(c)}$ The electronically (via excel) calculated value of correlation coefficient $(r)$ is $-0.95239$ and the value of $R^2$ is $0.9070515$
$textbf{(d)}$ There is strong, negative and linear association between the number of days cold lasted and the number of months taking supplements.
$bullet$ The form here is linear which can be verified by the value of $r$ which is very close to $-1$ and hence linear.
$bullet$ The direction is negative which can be verified by the slope of the LSRL equation which is $-1.5809$ and hence direction is negative
$bullet$ The strength is strong which can be verified by the value of $R^2$ which is $0.9070515$ which signifies that the 90 percent variation in number of days cold lasted can be predicted via number of days supplements taken. Which tells that the association is strong.
$bullet$ Data point is $(1,3)$ is an outlier as the residual for this is bigger than the trend.
$textbf{(b)}$ Yes, this linear model is appropriate as the value of residuals are small and also we can numerically verify it by value of correlation coefficient. We can see that value of $rapprox -0.95$ which is very close to -1 which means that the model is strong linearly decreasing.
$textbf{(c)}$ The electronically (via excel) calculated value of correlation coefficient $(r)$ is $-0.95239$ and the value of $R^2$ is $0.9070515$
$textbf{(d)}$ There is strong, negative and linear association between the number of days cold lasted and the number of months taking supplements.
For individual explanation see inside.
The one more variable that could be the actual cause, in this case, might be alcohol.
#### (b)
The one more variable that could be the actual cause, in this case, might be mother’s milk.
$$
begin{align*}
&dfrac{x^{150}}{x^{50}}tag{use $dfrac{a^{m}}{a^{n}}=a^{m-n}$ }\
&=x^{150-50}\
&=x^{100}
end{align*}
$$
Therefore, Gerardo’s rewritten expression $dfrac{x^{150}}{x^{50}}=x^3$ is incorrect.
$textbf{(b)}$
$$
begin{align*}
&y^{20}cdot y^{41}tag{use $a^mcdot a^n=a^{m+n}$}\
&=y^{20+41}\
&=y^{61}
end{align*}
$$
Therefore, Gerardo’s rewritten expression $y^{20}cdot y^{41}=y^{61}$ is correct.
$textbf{(c)}$
$$
begin{align*}
&(2m^2n^{15})^3tag{use $(a^m)^n=a^{mcdot n}$}\
&=2^{1cdot 3}m^{2cdot 3}n^{15cdot 3}\
&=2^{3}m^{6}n^{45}\
end{align*}
$$
Therefore, Gerardo’s rewritten expression $(2m^2n^{15})^3=2m^{6}n^{45}$ is incorrect.
$textbf{(b)}$ Correct
$textbf{(c)}$ Incorrect
$$
y-y_1=mcdot (x-x_1)
$$
Therefore, the equation of a line of slope $-dfrac{4}{3}$ passing through a point $(12,-4)$ is given by
$$
begin{align*}
y-(-4)&=-dfrac{4}{3}cdot (x-12)\
y+4&=-dfrac{4}{3}cdot x -dfrac{4}{3}cdot (-12)\
y+4&=-dfrac{4}{3}cdot x+dfrac{48}{3}\
y+4&=-dfrac{4}{3}cdot x+16\
y&=-dfrac{4}{3}cdot x+16-4\
&boxed{y=-dfrac{4}{3}cdot x+12}\
end{align*}
$$
y=-dfrac{4}{3}cdot x+12
$$
Start with a false equation:
$$
1=0
$$
Using different properties of equality, we can rewrite this equation so that it has a variable $x$. One possible way is as follows:
Add $x$ to both sides:
$$
x+1=x
$$
Multiply both sides by 2:
$$
2x+2=2x
$$
Using the distributive property, we can rewrite the left side:
$$
color{#c34632}2(x+1)=2x
$$
$$
begin{align*}
7x+5-3x&=2cdot (2x+5) \
(7x-3x)+5&=2cdot (2x+5)tag{use distributive property on RHS}\
4x+5&=2cdot 2x+2cdot 5\
4x+5&=4x+10tag{subtract 4x from each side}\
4x-4x+5&=4x-4x+10\
5&=10 tag{Not true }
end{align*}
$$
Therefore, we can see that equation $7x+5-3x=2cdot (2x+5)$ has no solution.
$textbf{(a)}$ D: all real numbers
The graph 1) takes all values of $x$ as input, therefore its domain is all real numbers.
$textbf{(b)}$ D:$x > -2$
The graph 3) is defined only for values of $x>-2$ as input, therefore its domain is all real numbers.
$textbf{(c)}$ D: $x leq 3$
The graph 2) corresponds for this domain for the similar reasons mentioned above.
$textbf{(b)}rightarrow$ Graph 3)
$textbf{(c)}rightarrow$ Graph 2)
