Introduction
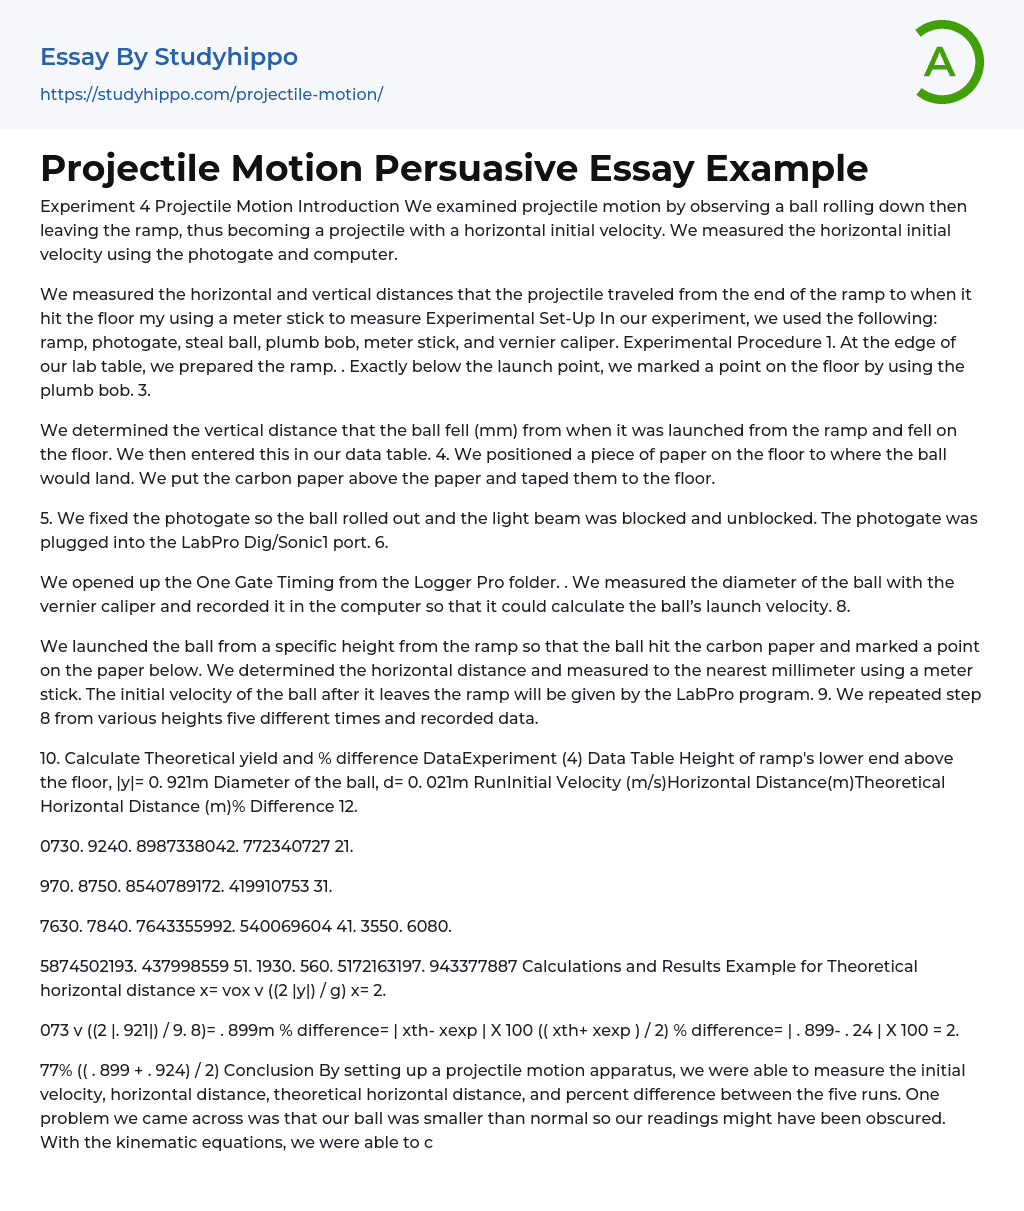
We examined projectile motion by observing a ball rolling down then leaving the ramp, thus becoming a projectile with a horizontal initial velocity. We measured the horizontal initial velocity using the photogate and computer.
We measured the horizontal and vertical distances that the projectile traveled from the end of the ramp to when it hit the floor my using a meter stick to measure.
Experimental Set-Up
In our experiment, we used the following: ramp, photogate, steal ball, plumb bob, meter stick, and vernier caliper.
Experimental Procedure
- At the edge of our lab table, we prepared the ramp.
- Exactly below the launch point, we marked a point on the floor by using the plumb bob.
- We determined the vertical distance that the ball fell (mm) from when it was launched from
...the ramp and fell on the floor. We then entered this in our data table.
- We positioned a piece of paper on the floor to where the ball would land. We put the carbon paper above the paper and taped them to the floor.
- We fixed the photogate so the ball rolled out and the light beam was blocked and unblocked. The photogate was plugged into the LabPro Dig/Sonic1 port.
- We opened up the One Gate Timing from the Logger Pro folder. . We measured the diameter of the ball with the vernier caliper and recorded it in the computer so that it could calculate the ball’s launch velocity. 8.
- We launched the ball from a specific height from the ramp so that the ball hit the carbon paper and marked a point on the paper below.
- We determined the horizontal distance and measured to the nearest millimeter using
View entire sampleJoin StudyHippo to see entire essay
a meter stick. The initial velocity of the ball after it leaves the ramp will be given by the LabPro program.
Conclusion
By setting up a projectile motion apparatus, we were able to measure the initial velocity, horizontal distance, theoretical horizontal distance, and percent difference between the five runs. One problem we came across was that our ball was smaller than normal so our readings might have been obscured. With the kinematic equations, we were able to calculate five different horizontal projections from five different heights.
Four out of five of our percent difference fell within 3% while the final run was 8%. This might be due to wind resistance and friction.
- Automobile essays
- Bus essays
- Civil engineering essays
- Cycling essays
- Electric Car essays
- Genetic Engineering essays
- Hybrid essays
- Innovation essays
- Internal Combustion Engine essays
- Invention essays
- Mechanical Engineering essays
- Mechanics essays
- Software Engineering essays
- Telephone essays
- Atom essays
- Big Bang Theory essays
- Density essays
- Electricity essays
- Energy essays
- Force essays
- Heat essays
- Light essays
- Motion essays
- Nuclear Power essays
- Physiology essays
- Sound essays
- Speed essays
- Temperature essays
- Thermodynamics essays


