AP Statistics – Flashcards
Unlock all answers in this set
Unlock answersquestion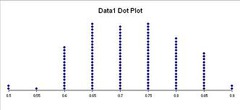
Dot Plot

answer
A set of data represented by using dots over a number line. The number of dots over the number line tells the value of the data points.
question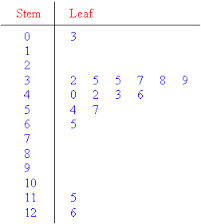
Stem plot

answer
-A plot where each data value is split into a "leaf" (usually the last digit) and a "stem" (the other digits). -The way to interpret: Stem: 0 + Leaf: 3 = Number: 03 In the picture there is a gap between 03 and 32.
question
Histogram

answer
-A representation of a frequency distribution by means of rectangles whose widths represent class intervals and whose areas are proportional to the corresponding frequencies. -A histogram breaks the range of values of a variable into classes and displays only the count or percent of the observations that fall into each class. You should always choose classes of equal width.
question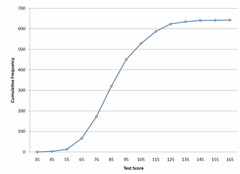
Cumulative Frequency Plot

answer
Cumulative frequency of a particular value in a table can be defined as the sum of all the frequencies up to that value (including the value itself).
question
Median
answer
The "median" is the "middle value". Half of the observations are smaller and the other half are larger. To find the median the numbers must be listed in numerical order. -If the number of the observations n is odd, the median M is the center observation in the ordered list. Find the location of the median by counting (n+1)/2 observations up from the bottom of the list. -If the number of observations n is even, the median M is the average of the two center observations in the ordered list. The location of the median is again (n+1)/2 from the bottom of the list.
question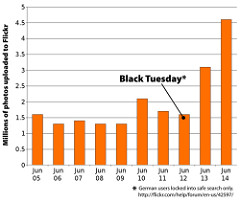
Mean

answer
-The "average value". Found by adding a set of observations, add their values, and divide by the number of observations. If the n observations are x1, x2...., xn, their mean in the picture depicted. -the mean is sensitive to the influence of a few extreme observations (this meaning that it is not a resistant measure).
question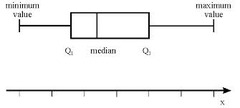
5 Number Summary

answer
A five-number summary of a set of observations consists of the smallest observation, the first quartile, the median, the third quartile, and the largest observation, written in order from smallest to largest. In symbols, the five-number summary is Minimum, Q1, M, Q3, Maximum
question
Range
answer
-A way to measure spread by solving the difference between the largest and the smallest observations. -Formula ->Range = Maximum Value - Minimum Value
question
Interquartile Range
answer
The distance between the first and third quartiles (the range of the center half of the data), a more resistant measure of spread. IQR=Q3-Q1
question
Standard Deviation

answer
A measure of the dispersion of a set of data from its mean. The more spread apart the data, the higher the deviation. Standard deviation is calculated as the square root of variance. Its symbol is σ (the greek letter sigma).
question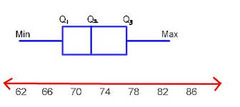
Quartiles

answer
Quartiles are the values that divide a list of numbers into quarters. The first quartile is the 25th percentile, and the third quartile is the 75th percentile. (The second is the median itself) To calculate: 1. Arrange the observations in increasing order and locate median M in the ordered list. 2. First Quartile Q1: the median of the observations whose position in the ordered list is to the left of the location of the overall median. 3. Third Quartile Q3: the median of the observations whose position in the ordered list is to the right of the location of the overall median.
question
Percentiles
answer
Percentiles are values that divide a set of observations into 100 equal parts. The percentile rank is the proportion of values in a distribution that a specific value is greater than or equal to The pth percentile of a distribution is the value such that p percent of the observations fall at or below it.
question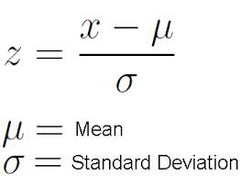
Z-scores

answer
The Standardized value of an original value. Achieved by subtracting the mean of the distribution and then dividing by the standard deviation. If x is an observation from a distribution that has known mean and standard deviation, the standardized value of x is as depicted in the image.
question
Boxplot

answer
A boxplot is a graph of the five-number summary. ~A central box spans the quartiles Q1 and Q3 ~A line in the box marks the median M ~Lines extend from the box out to the smallest and largest observations.
question
Changing Units effect on summary statistics
answer
Changing Units measurement is a linear transformation of the measurements. x (new)= a+bx -Multiplying each observation by a positive number b multiplies both measures of center (mean and median) and measures of spread (interquartile range and standard deviation) by b. -Adding the same number a (either positive, zero, or negative) to each observation adds a to measures of center and to quartiles but does not change measures of spread.
question
SOCS (used to compare two sets of data or just one)
answer
Shape- Skewed or symmetrical Outlier- an observation that lies an abnormal distance from other values in a random sample from a population. Center- where half the data lies above and half lies below (mean and median). Spread- Range, quartiles, and standard deviation. Observing the shape of the data, identifying any outliers, finding the center, and observing the spread as well.
question
Scatterplot

answer
Shows the relationship between two quantitative variables measured on the same individuals. The values of one variable appear on the horizontal axis, and the values of the other variable appear on the vertical axis. Each individual in the data appears as the point on the plot fixed by the values of both variables for the individual.
question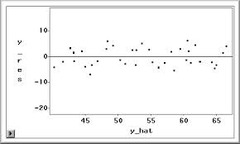
Residual Plot

answer
A graph that shows the residuals on the vertical axis and the independent variable on the horizontal axis. If the points in a residual plot are randomly dispersed around the horizontal axis, a linear regression model is appropriate for the data; otherwise, a non-linear model is more appropriate.
question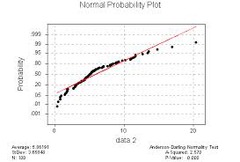
Normal Probability Plots

answer
A plot that provides a good assessment of the adequacy of the Normal model for a set of data. If the points lie close to a straight line, the plot indicates that the data are Normal. Systematic deviations from a straight line indicate a non-Normal distribution. Outliers appear as points that are far away from the overall pattern of the plot.
question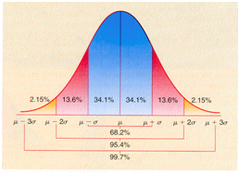
Normal Curve

answer
Density curves that are symmetrical, single-peaked, and bell-shaped. They describe a normal distribution.
question
Correlation

answer
Correlation is the degree to which two or more quantities are linearly associated. 1 is a perfect positive correlation 0 is no correlation (the values don't seem linked at all) -1 is a perfect negative correlation Correlation is Positive when the values increase together, and Correlation is Negative when one value decreases as the other increases
question
Coefficient of Determination

answer
The coefficient of determination, r^2, i sthe fraction of the variation in the values of y that is explained by the least-squares regression line of y on x. We can calculate r^2 using the formula in the image.
question
`Outliers vs. influential points in bivariate data
answer
An observation is potentially an influential observation if it has an x value that is far away from the rest of the data (separated from the rest of the data in the x direction). To determine if the observation is in fact influential, we assess whether removal of this observation has a large impact on the value of the slope or intercept of the least-square line. An observation is an outlier if it has a large residual. Outlier observation fall far away from the least-square line in the y direction.
question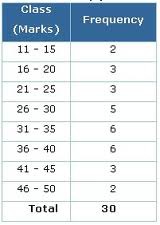
Frequency Tables

answer
Counts of the number of individuals in each class are called frequencies. A table of frequencies for all classes is a frequency table.
question
Bar Chart

answer
A Bar Graph (also called Bar Chart) is a graphical display of data using bars of different heights.
question
Marginal Frequencies
answer
In frequency tables, the entries in the "Total" row and "Total" column or are at the bottom and right margins of a two-way table are called marginal frequencies or the marginal distribution. Entries in the body of the table are called joint frequencies.
question
Joint Frequencies

answer
Entries in the body of the table are called joint frequencies.
question
Conditional Relative Frequencies
answer
To find a conditional relative frequency , divide the joint relative frequency by the marginal relative frequency. Conditional relative frequencies can be used to find conditional probabilities.
question
Census
answer
Attempts to contact every individual in the entire population in order to gather data.
question
Survey
answer
Selecting a sample of people to represent a population and asking the individuals in the sample questions and recording thier responses. Afterwards, draw conclusions about the population using the sample question.
question
Observational Study
answer
Observe individuals and measure variables of interest but do not attempt to influence the responses.
question
Experiment
answer
Deliberately do something to individuals in order to observe their responses.
question
Characteristics of well-designed and well-conducted survey
answer
Always incorporates chance (everyone has the possibility of being chosen for the survey), neutral wording of the question, non responses and underrepresentation are taken into account.
question
Population
answer
A population is any entire collection of people, animals, plants or things from which we may collect data. It is the entire group we are interested in, which we wish to describe or draw conclusions about.
question
Sample
answer
A sample is a group of units selected from a larger group (the population). By studying the sample it is hoped to draw valid conclusions about the larger group.
question
Random Selection
answer
Random sampling (random selection) is a sampling technique where we select a group of subjects (a sample) for study from a larger group (a population). Each individual is chosen entirely by chance and each member of the population has a known, but possibly non-equal, chance of being included in the sample. By using random sampling, the likelihood of bias is reduced
question
Sources of Bias in Sampling
answer
Voluntary Response samples: the respondents choose themselves Convenience Samples: individuals easiest to reach are chosen Undercoverage and Nonresponse are also sources of bias in sampling (each is explained in sources of bias in surveys).
question
Sources of Bias in Surveys
answer
Undercoverage: when some members of the population are inadequately represented in the sample Nonresponse Bias: the bias that results when respondents differ in meaningful ways from nonrespondents. Voluntary Response Bias: occurs when sample members are self-selected volunteers, as in voluntary samples. Poorly Worded Questions also result in the biases mentioned.
question
Simple Random Sampling (SRS)
answer
A Simple Random Sample (SRS) of a size n consists of n individuals from the population chosen in such a way that every set of n individuals has an equal chance to be the sample actually selected.
question
Stratified Random Sampling
answer
To sample important groups within the population separately then combine them. To select a stratified random sample, first divide the population into groups of individuals, called strata, that are similar in some way that is important to the response. Then choose a separate SRS in each stratum and combine these SRSs to form the full sample.
question
Cluster Sample
answer
Divides the population into groups, or clusters. Some of these clusters are randomly selected. Then all individuals in the chosen cluster are selected to be in the sample.
question
Characteristics of well-designed, well-conducted experiment
answer
Control: Control refers to steps taken to reduce the effects of extraneous variables. These extraneous variables are called lurking variables. Must have a control group, a placebo, blinding, randomization, and replication (the practice of assigning each treatment to many experimental units).
question
Treatment
answer
A specific experimental condition applied to the units.
question
Control Group
answer
A control group is a baseline group that receives no treatment or a neutral treatment. To assess treatment effects, the experimenter compares results in the treatment group to results in the control group.
question
Experimental Unit
answer
The individuals on which the experiment is done.
question
Placebo Effect
answer
A neutral treatment that has no "real" effect on the dependent variable is called a placebo, and a participant's positive response to a placebo is called the placebo effect.
question
Replication
answer
Replication means to use enough subjects to reduce chance of variation.
question
Blinding
answer
The practice of not telling participants whether they are receiving a placebo. In this way, participants in the control and treatment groups experience the placebo effect equally. Often, knowledge of which groups receive placebos is also kept from people who administer or evaluate the experiment. This practice is called double blinding.
question
Completely Randomized Design
answer
When all experimental units are allocated at random among all treatments.
question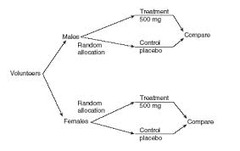
Randomized Block Design

answer
Block: a group of experimental units or subjects that are known before the experiment to be similar in some way that is expected to systematically affect the response. In a randomized block design, the random assignment of units to treatments is carried out separately within each block.
question
Matched Pairs Design
answer
Concerned with measuring the values of the dependent variables for pairs of subjects that have been matched to eliminate individual differences and that are respectively subjected to the control and the experimental condition.
question
Conclusions from observational studies, surveys, experiments
answer
Observational studies: nothing is done to subjects. Conclusions are drawn strictly from observations. Surveys: Asking subjects a set of questions. Conclusions drawn from answers received. Experiments: A treatment is administered to subjects. Reaction and outcome due to treatment is recorded. Conclusions are drawn from reactions to treatment.
question
Independence in Probability
answer
Two events A and B are independent if knowing that one event occurs does not change the probability that the other occurs
question
Binomial Distributions
answer
The distribution of the count X of successes in the binomial setting is the binomial distribution with parameters n and p. The parameter n is the number of observations, and p is the probability of a success on any one observation. The possible values of X are the whole numbers from 0 to n. As an abbreviation, we say that X is B(n,p).
question
Expected Value of Random Variable

answer
The mean of a probability distribution
question
Standard Deviation of Random Variable

answer
The square root of the variance. Measures the variability of the distribution about the mean.
question
Effect of adding/changing units of independent random variables on mean and std deviation

answer
Mean: If X is a random variable and a and b are fixed numbers, then mean(a+bX)=a+bmeanX If X and Y are random variables, then meanX+Y=meanX+meanY Std Deviation: standard deviations do not generally add. Standard deviations are most easily combine by using the rules for variance rather than by giving separate rules. The adding rule is depicted in the image for independent random variables X and Y.
question
Properties of Normal Distribution
answer
has mean 0 and standard deviation 1 N(0,1). Forms a symmetrical bell-shaped curve 50% of the scores lie above and 50% below the midpoint of the distribution Curve is asymptotic to the x axis Mean, median, and mode are located at the midpoint of the x axis
question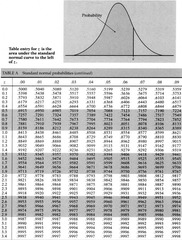
How to Use Table A for normal distribution

answer
Table A is a table of areas under the standard normal curve. The table entry for each value z is the area under the curve to the left of z. After obtaining the z score, find it within table a by breaking it down. if it is 2.22 then find 2.2 on the left column and on the top column find .02. The z score obtained will be 0.9868.
question
How to do a simulation to estimate probability
answer
Step 1: State the problem or describe the random phenomenon. Step 2: State the assumptions. Step 3: Assign digits to represent outcomes. Step 4: Simulate repetitions. Step 5: State your conclusions. A calculator can be used (randInt), table B, or actually performing the study.


