Clinical Epidemiology – Flashcards
Unlock all answers in this set
Unlock answersquestion
What do studies usually present us with?
answer
associations observed in a sample
question
How do we assess threats to internal validity
answer
1. chance 2. bias 3. confounding
question
chance
answer
random error statistics help us to quantify our uncertainty
question
bias
answer
misleading associations introduced by research methods; systematic departures from teh true estimate of the risk of an exposure on the dz/outcome can lead to under or over estimation of risk all studies have some bias
question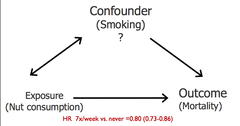
confounding

answer
factors related to both predictor and outcome which could obscure their true relationship "distortion of the effect of one risk factor (exposure, predictor) by the presence of another." may mask an actual association or create the appearance of an association even if a true association is absent can be a cause or risk factor for the outcome must be related to the exposure (ie have a different value at each level of the exposure) -> for cohort or RCT, this condition must hold at baseline NOT on the causal pathway btwn the exposure and outcome (not an intermediate variable)
question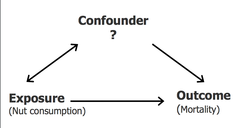
3 characteristics of a confounder

answer
1. related to the outcome (causally) 2. associated with the exposure 3. not part of teh causal chain btwn the exposure and the coutcome
question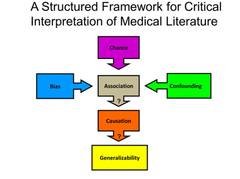
If we determine internal validity of the study, what do we have left to determine?

answer
if the association is causal and whether the findings are generalizable to individuals or populations not studied AKA EXTERNAL VALIDITY
question
prospective study
answer
follow individuals forward in time and collect data on outcomes
question
retrospective studies
answer
select patients with or without an outcome and look backwards for exposures investigaotrs go back in time to assemble the cohort or use data already collected
question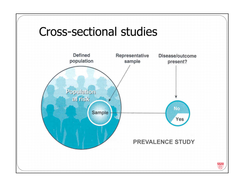
cross-sectional studies

answer
measure everything at a single point in time observational studies in which exposures and outcomes (e.g. dz. states) are measured simultaneously in a population (AKA single pt in time) - hard to tell whether exposure or outcome came first (implications for assertion about the cause) so more useful for hypothesis generation than hypothesis testing commonly used in public health surveillance can tell us about potential associations between an attribute/exposure and the outcome measures of frequency and association
question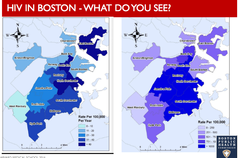
prevalence study

answer
aka cross-sectional study a pop is selected and the exposure and outcome are determined at the same point in time most of what we know about disease prevalence and distribution of risk factors at the population level in the US come from cross-sectional surveys
question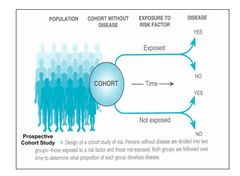
cohort studies

answer
2 types: retrospective and prospective (best one) subjects are based on exposures and outcomes are then ascertained -> observational so exposure is not controlled observational studies in which we follow a population forward in time collecting data on exposures and development of outcomes. Most cohort studies are prospective: assemble a cohort and start collecting data on exposure. Sometimes we can go back in time and find a cohort of ppl and use data that were prospectively collected at the time - a retrospective cohort study these are "natural experiments" outcomes may be continous variables (eg. systolic blood pressure) but are often categorical (disease onset, death) follow-up time may be fixes (eg. all followed for 5 yrs) or variable (each individual contribute some amount of person-time to the denominator)
question
criteria for a good cohort study
answer
1. subjects shouldn't have the outcome/disease at time of selection 2. sufficient follow-up time (to allow for event) 3. avoid subject drop-out and data loss
question
advantages of cohort studies
answer
1) best wat to establish incidence of dz 2) exposure assessed before dz: minimizes potential for bias; helps in determination of causation 3) retrospective v. prospective- plan for data collection and subject consent decreases loss to follow up and increases quality of data
question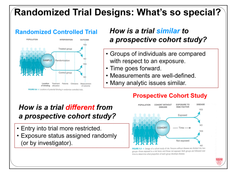
randomized controlled trial

answer
experiments in which we randomly assign participants to a treatment group (the exposure) or a comparison (often a placebo) group and follow them forward in time for an outcome. really a cohort study in which exposure is selected by random assignment
question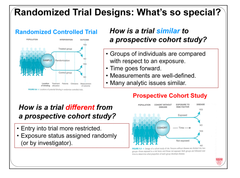
How is a RTC different from a prospective cohort?

answer
1) entry into trial more restricted 2)exposure status assigned randomly
question
case-control studies (retrospective)
answer
observational studies in which we identify a group with a particular outcome and another group without the outcome and compare their past exposures subjects are selected based on outcomes and exposures are then ascertained controls are selected from the "at-risk" population exposure status must not increase or decrease chance of being chosen as control
question
independent variables
answer
AKA predictor or exposure a variable we measure or manipulate (as an intervention or treatment) that may be associated with an outcome of interest if it occurs before development of an outcome it is sometimes called an exposure or predictor variable
question
dependent variable
answer
aka outcome measurable outcome of interest (eg. dz state, cure, or death) which we'd like to predict or explain with independent variables/predictors
question
nominal or categorical
answer
named but not necessarily ordered (may by dichotomous) eg. sex, death, ethnic, or cultural background
question
ordinal
answer
necessarily ordered categories where the distance between each unit is not defined e.g. military ranks, satisfaction of poor, fair, good, very good, excellent, results on a pain scale, grade of heart murmur
question
interval/discrete
answer
take on discrete (eg. integer) values with equal magnitude between points (eg. number of medications) ex. number of medications
question
interval/continuous
answer
may take on any value over a continuum (eg. height or weight); real numbers like height and weight
question
What are measures of frequency
answer
incidence and prevalence
question
prevalence

answer
a snapshot in time- the proportion of ppl with an outcome at a given pt in time measured in a cross-sectional study how many people have an outcome (or a risk factor) of interest the measure of "relative risk" in a cross-sectional study is actually a prevalence ratio = (prevalence among those with an exposure or attribute)/prevalence among those without an exposure or attribute)
question
point prevalence
answer
single point in time
question
period prevalence
answer
over a specified time frame
question
incidence
answer
how many people develop an outcome of interest proportion of the population, initally free of outcome, who experience the outcome over a specified period of time
question
What is the incidence/prevalence of a condition that is uncommon but lasts a long time
answer
high prevalence, low incidence
question
What is the incidence/prevalence of a condition that is common but you get better quickly
answer
high incidence, low prevalence
question
What is the incidence/prevalence of a condition that is both uncommon and high mortality or rapid resolution
answer
low incidence and low prevalence could be missed or undersestimed but could have a very large impact (eg. ebola)
question
what are measures of association
answer
absolute difference between groups relative risk
question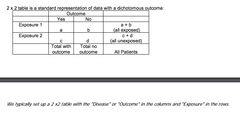
relative risk

answer
proportion with an outcome in one group divided by proportion with an outcome in another in general, RRs are reported for cohort studies can be expressed as a cumulative incidence ratio, an incidence ratio, or a hazard ratio
question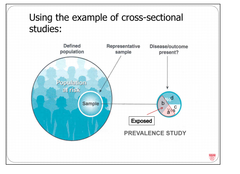
What is relative risk in a cross-sectional study really a measure of?

answer
prevalence
question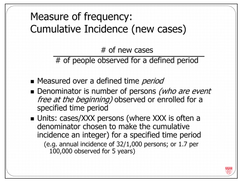
cumulative incidence

answer
# of new outcomes/ total # persons at risk at teh start of follow-up unitless fraction but the observation period is describted (e.g. "The annual incidence of pancreatic cancer among men 40-50 yrs. old) measured over a defined time period usually used when all people are followed for an equal time period to see if they have an event, while incidence rate allows for different lengths of follow-up
question
incidence rate
answer
aka incidence density # of new events/ sum of total person-time (e.g. 20 cases per 1000 person-years) note the denominator f an incidence rate is the sum of person time contributed by each member of a population observed - deminominator is the sum of the observation time of each individaul (event free at the beginning) in your population) unites cases/person-time ex. a person-year is one person followed for one year, or one person followed for 3 months together with another followed for 9 months, or 52 ppl each followed for a week, etc. usually used when all people are followed for an equal time period to see if they have an event, while incidence rate allows for different lengths of follow-up
question
measures of association or effect
answer
differences btwn groups measured by: 1) relative measures (eg. smokes have 15 tmes the rate of lung cancer as non=smokers). This includes risk ratios (aka relative risk) and odds ratios 2) absolute measures (eg. difference of 3 cm in height; difference in mortality, btween 48 and 35% for an sbolute diff of 13%) provide the max info
question
risk ratio

answer
aka relative risk - how many times higher is the risk (or benefit) in the presence of the exposure? commonly used measure that represents the risk in the exposed group compared with teh risk (or oddes in the unexposed group) 1.0 signifies no difference between groups
question
attributable risk

answer
aka AR or absolute risk difference How much absolute risk or benefit is attributable to the exposure? describes the increased risk of dz that is due to the exposure (among the exposed). Even in the exposed group, not all dz results from teh exposure of interest; some dz is the reult of other causes
question
disadvantages of cohort design
answer
1) huge cohorts needed for rare diseases 2) expensive and difficult to maintain (losses to follow-up) 3) require lengthy follow-up to allow outcomes to occur 4) can only analyze data you had the foresight to collect
question
attributable fraction

answer
AKA AF, may also be expressed as AR% the proportion of dz in the exposed group that is due to the exposure
question
population attributable risk
answer
PAR the risk of excess dz in the pop due to the exposure risk of dz in the total population - risk of dz in the unexposed group can also be calculated by attributable risk X prevalence of the risk factor
question
causation
answer
asserting that an association is causal usually requires more than the assessment of a single study. Requires us to consider the totality of the evidence and our accepted understanding of biology and other sciences can use Hill considerations, but these are not a checklist for determining cause, just a guideline even if a cause can be identified, it may only resul in the outcome when toher component causes are present. There may be many causal pathways to the same outcome (eg. lung cancer in Rothman article)
question
Hill's criteria
answer
temporality strength consistency (scientific method basic tenant) specificity (one cause and one effect) dose-response (biological gradient- increase exposure, increase outcome) plausibility- biologically makes sense reversibility (or experimental evidence - opposite of dose-reponse, decrease exposure, decrease outcome ) analogy TCSS DARP none of these is sufficient, none are always present -; use them to think about whether we are going to determine that the burden of proof is that something causes something else Beyond hill: consider that most events have multiple component causes, several conditions often must be present, some may be necessary and some sufficient, the "causal pie" approach described by Rothman is one way to think about mulitple causal factors leading to a complete causal mechanism that will lead to an outcome
question
odds
answer
event occurrences divided by non-occurrences a 50% chance of rain is also 1:1 odds if p = the proportion, odds = p/(1-p) and p = o/(1+o)
question
odds ratio

answer
relative measure of effect (compared in risk ratio) - CROSS PRODUCT close approximation of risk ratio when the outcome is rare (frequently used rule of thumb is 10%) When outcome is more common and/or the assocation is stronger (RR further from 1.0), the OR will be aless good approcimation of the RR -; OR will be more extreme (higher than the RR if they are ; 1.0) and lower than RR if they are ;1.0) NOTE: the odds ratio for a case-control studio (rather than a cohort study is interpreted differently
question
If risk ratios are not possible in case-control studies, what do you calculate?

answer
OR
question
framingham heart study
answer
objective to identify the common factors or characteristics that contribute to a CVD by following its development over a long period of time in a large group of participants who had not yet developed overt symptoms of CVD or suffered a heart attack or strike
question
All of the following are threats to the internal validity of a study's report of an association EXCEPT: Chance Causality Confounding Bias
answer
causality
question
Using appropriate statistical methods allows us to assess the risk of which of the following: That bias was present in the design of the study That the association does not represent a true cause The risk that random error is responsible for the finding All of the threats to the internal validity of a claim of association
answer
the risk that random error is responsible for the finding
question
Hospitals are required to track specific adverse events such as new central-line associated bloodstream infections. If they report this as the number of infections in one year, the value they are reporting is a: Median Prevalence Cumulative incidence Incidence density
answer
cumulative incidence
question
A study reports that lung disease in premature infants is associated with lack of surfactant- a material that lines the alveoli (air sacs) in the lung. All of the following are criteria (proposed by Hill) to consider when assessing whether this association represents a cause, EXCEPT: Sufficiency Strength Temporality Specificity
answer
sufficiency
question
The term "generalizability" refers to: Whether a component cause appears in many causal mechanisms The applicability of the findings to the population from which the sample was drawn The applicability of the findings beyond the population studied Whether the same data collection procedures were used in all subjects
answer
The applicability of the findings beyond the population studied
question
A car skids off the road and into a ditch injuring several people. An investigation shows that the driver was driving under the influence of alcohol, the tires on the car were dangerously worn, and it was raining at the time of the crash. Each of these individual findings are best thought of as: Necessary causes Component causes The causal mechanism Sufficient causes
answer
component cause
question
standard deviation

answer
describes the variability of observations around the mean of a normally distributed continuous variable for a sample quantifies scatter- how much teh values vary from one another does not change predictably as you acuire more data -> it is the best possible estimate of the SD of the overall population
question
how can continuous data be summarized
answer
remember we used RR and OR for dichotomous data in the 2X2 mean, median, standard deviation
question
standard error

answer
the variability of sample means (from samples of a given size) around the true population mean equals the SD divided by the square root of n allows us to see whether the observed difference in our data (sample) is more extreme than we would expect if there were no true underlying difference (the null hypothesis) by definition, always smaller than SD and gets smaller as your samples get larger- the mean of a large sample is likely to be closer to the true population mean than is the mean of a small sample AKA SE or SEM
question
basic steps of statistical testing

answer
1. state a hypothesis (as a "null" hypothesis) including the definition of outcome variable. 2. choose appropriate statistical test 3. calculate test statistic 4. determine (from a table or graph of its distribution 0 and now done by computer) whether the value obtained is "extreme," i.e. unlikely to have occurred by chance is the null hypothesis were true 5. create a confidence interval
question
what is the convention of the extreme in statistics
answer
By convention, we consider extreme to be outside of 95% of the expected results under the null (in the "tails" of the distribution each containing 2.5%)
question
how to interpret stats results

answer
a. statistically significant: null hypothesis is rejected b. not statistically significant: null hypothesis is not rejected (which is not the same as true)
question
type 1 error
answer
alpha = probability of making a type 1 error concluding that two populations are different (rejecting the null hypothesis) when they are not different (i.e. they are drawn from the same population) cutoff for alpha = 0.05 (the p-value), which is generally taken arbitrarily as the risk of alpha error below which we are comfortable rejecting the null
question
type 2 error
answer
Beta = probability of making a type 2 error not concluding that a difference exist (not rejecting the null), when the samples are actually drawn from different populations
question
What are the two prototypical statistical tests
answer
1. t-test (2 samples) 2. chi squared test 3. non-parametric tests questions these cannot answer: how MUCH better or worse? what's the magnitude of benefit that we observed in our point estimate? Does the result exclude (with staistical certainty) a result that may be clinically meaningful? a CI gives the best estimate of a difference based on our sample and the range of values statistically consistent with teh data observed.
question
t-test

answer
2 sample test compares two means (null: the samples are from a single population) -t statistic (for 2 independent samples) is a comparison of the difference in the sample means compared to the expected variability in sample means used for continuous data calculate it and then compare the result (t) to a distribution of values for t you might get with repeated sampling under teh null
question
z test
answer
similar to a t test and the distribution of this test statistic is normally distributed so the critical value is always 1.96 to reject the null at an alpha level of 0.05
question
chi-squared test

answer
seeks to detemine whether an association exists between 2 categorical variables used for fracture (yes/no) data analyzes a 2x2 table by comparing observed vs. expected if the null hypothesis were true (i.e. if the proportion of outcomes were equal in the two groups) note: the expected value in any cell = (row total x column total)/total n of table for studies with small numbers in one or more cells (often ;5) we use Fisher's exact test, which is analogous but more difficult to calculate by hand (computers)
question
non-parametric tests
answer
used for comparisons with variables that do not follow a typical distribution. compare medians instead of means, often by comparing the "rank" of observation in 2 groups (wheter higher-ranking observations are more common in one group) ex. Wilcoxon rank sum test
question
confidence intervals

answer
inferential statistics (like t-tests and chi-squared test) are concerned with teh certainty of rejecting a pre-specified null hypothesis ex. is treatment the same as placebo? CIs show us the range of values compatible with the data; the range of values which are plausible given the data we observed; can report it for a difference, a relative risk, or any other measure includes information about type 1 error and magnitude of effect -we can assess whether they overlap with a value of no difference (0 if an absolute difference, 1.0 if a relative risk) - we can assess whether differences we deem clinically are included in the interval (they help us determine not only whether a difference exists but whether we are relatively certain that clinically important difference exists in other words, if we repeated the trial many times and calculated teh 95% CI for each, the true effect will be included 95% of the time. If the study is unbiased, there is a 95% chance that the interval includes teh true effect size
question
external validity
answer
the extent to which the study's findings are applicable to patients outside of the study to whom they might be applied aka generalizability
question
A new drug is highly effective at prolonging survival for head and neck cancer that currently has a high mortality rate by 2 years after diagnosis. Which of the following measures would NOT be expected to be affected by the widespread use of this new drug? Mean length of survival for this cancer Prevalence of this cancer Incidence of this cancer Median length of survival for this cancer
answer
Incidence of this cancer
question
A survey study in 4 high schools selects a random sample of 101 students and asks them to report on the number of cigarettes they smoked in the past month. Mean cigarette use in the sample is: derived from a continuous variable the middle value (if the responses are ranked low to high) a measure of variation derived from an ordinal variable
answer
derived from an ordinal variable
question
All of the following are true about the median number of cigarettes smoked, EXCEPT: It is a measure of central tendency It is more affected by extreme values compared to the mean If there are an even number of respondents it is calculated by averaging two values If 40% of students smoked, the median would be 0
answer
It is more affected by extreme values compared to the mean
question
A study of two weight loss drugs is conducted. Subjects who took drug A had average weight loss of 0.7 kg. Those who took drug B had average weight loss of 0.82 kg. The p value for the comparison is reported to be <.05. Which of the following is true: The risk of a type II error is greater than type I error The result is not considered "statistically significant" The result is more likely than not to be due to chance The risk of type I error is < 5%
answer
The risk of type I error is < 5%
question
The SPRINT trial compared two strategies for blood pressure control. 4678 patients were randomized to "intensive" control and managed to a target systolic blood pressure of less than 120 mm Hg. 4683 were managed to "standard" control with a target of 130 mm Hg. Assume all subjects were followed for 3 years. The "intensive" group suffered 243 events (heart attack, stroke, etc.), while the "standard" group suffered 319. Fill in a 2 x 2 table and answer the following question: ?The number of events reported above in each group represents the: prevalence incidence rate per person year of observation cumulative incidence point prevalence
answer
cumulative incidence
question
The SPRINT trial compared two strategies for blood pressure control. 4678 patients were randomized to "intensive" control and managed to a target systolic blood pressure of less than 120 mm Hg. 4683 were managed to "standard" control with a target of 130 mm Hg. Assume all subjects were followed for 3 years. The "intensive" group suffered 243 events (heart attack, stroke, etc.), while the "standard" group suffered 319. Fill in a 2 x 2 table and answer the following question: What is the relative risk of an event in the intensive vs. standard control groups for the outcomes of the study? .052 1.3 .76 -.016
answer
.76
question
The SPRINT trial compared two strategies for blood pressure control. 4678 patients were randomized to "intensive" control and managed to a target systolic blood pressure of less than 120 mm Hg. 4683 were managed to "standard" control with a target of 130 mm Hg. Assume all subjects were followed for 3 years. The "intensive" group suffered 243 events (heart attack, stroke, etc.), while the "standard" group suffered 319. Fill in a 2 x 2 table and answer the following question: What is the attributable risk of intensive control vs. standard control for these outcomes? 16/10,000 .76 1.3 -.016
answer
-.016
question
You conduct a stress reduction intervention in 100 adults and use 100 others as a control group. You compare scores on a depression scale (normally distributed) at the end of 1 year. Which is the best statistical test to use to determine whether you will claim a significant difference? One-tailed t-test Two tailed t-test Z-test Just claim it's significant, and maybe no one will notice
answer
Two tailed t-test
question
The mean (year-end) score in the intervention group was 85 with a standard deviation of 10. What is the standard error of this result? 8.5 1.0 .11 Cannot be calculated with the available information
answer
1.0
question
All of the following are true about sample means, EXCEPT: 95% will fall within 1 standard deviation of the population mean 95% will fall within 2 standard errors of the population mean They are normally distributed around the true, population mean Their variability is expressed by the standard error
answer
95% will fall within 1 standard deviation of the population mean should be standard error and should be 2
question
A 95% confidence interval can be calculated in all of the following situations, EXCEPT: The mean serum sodium of a sample of 100 two year-olds The difference in mean survival with pancreatic cancer The measured height of a single individual The relative risk of obesity (vs. normal weight) for developing asthma
answer
The measured height of a single individual
question
A sample of patients is enrolled and you calculate their mean BMI and the standard deviation around that mean. To calculate the standard error of this sample, you would need to know which of the following: The level of alpha error you will allow in drawing a conclusion The population mean The number of individuals in the sample The level of beta error you will allow in drawing a conclusion
answer
The number of individuals in the sample
question
You read a case-control study of lead paint exposure during pregnancy and increased risk of birth defects. Mothers of children with birth defects may be more likely to report prenatal lead paint exposure because of their heightened concern. Which of the following is True? This is a type of sampling bias The effect on the OR will be to overestimate risk of lead paint on birth defects The effect on the OR will be to underestimate risk of lead paint on birth defects This type of bias can be minimized in the analysis stage
answer
The effect on the OR will be to overestimate risk of lead paint on birth defects
question
A large cohort study is looking at the impact of social media exposure in high school on incidence of depression and anxiety in adulthood. Investigators enroll students while they are in freshman year of high school and follow them over the next ten years of life. In thinking about loss to follow-up as subjects moved through transitions to adulthood, which of the following would have the greatest impact on the internal validity of the study? Loss to follow-up that is balanced in terms of individuals' level of exposure to social media (and potential confounders) Study costs to track and keep in contact with subjects may be high Subjects who are lost to follow-up may be different than those who are not Loss to follow-up may impact the generalizability of the study results
answer
Subjects who are lost to follow-up may be different than those who are not
question
Which of the following is False about controlling for potential confounding? Even with the best efforts to identify and control for confounding, it can still be present due to unmeasured confounders. Confounding can be adjusted for in the analytic stage via stratification by a potential confounder, if measured. Restriction of the study sample to those without identified potential confounders can prevent confounding by these variables, but may affect the generalizability of results. When matching cases to controls on specific variables to prevent potential confounding by these variables, investigators can analyze the effect of the matching variable on the study outcome.
answer
When matching cases to controls on specific variables to prevent potential confounding by these variables, investigators can analyze the effect of the matching variable on the study outcome.
question
In a retrospective cohort study on the impact of oral Vitamin D supplementation on preventing skin cancer, investigators were concerned about confounding by sun exposure because sun exposure increases Vit D and therefore decreases the need to take Vitamin D supplementation. Sun exposure also increases one's risk of skin cancer. They stratified results by sun exposure of ;30 min per day and ?30 min/day. Which of the following would be consistent with the presence of confounding by sun exposure? Crude RR between Vitamin D and incidence of skin cancer 0.8, adjusted RR of 1.0, and 1.0 in high and low sun exposure groups Crude RR between Vitamin D and incidence of skin cancer 0.8, adjusted RR of 0.6 and 1.0 in high and low sun exposure groups Crude RR between Vitamin D and incidence of skin cancer 0.8, adjusted RR of 0.8 and 0.8 in high and low sun exposure groups None of the above
answer
Crude RR between Vitamin D and incidence of skin cancer 0.8, adjusted RR of 1.0, and 1.0 in high and low sun exposure groups
question
define bias
answer
any source os systematic error in determination of the assocation between the exposure and the outcome of interest can occur at many different points of a study bias is not something you can control for or mathematically estimate. You need to assess study designs carefully and deployed studies, but we never rid ourselves of it completely ex. selection bias information bias
question
selection bias
answer
the two samples compared are not representative ofthe same populations at risk. Occurs when criteria for inclusion in one "arm" differ (maybe subtly) from teh comparison group. This is NOT the same as generalizability (external validitiy). A study may have no selection bias (the two samples differ by exposure but are otherwise representative of the same populatinos, but may not be generalizable to subjects outside fo the study -; selection bias or sampling bias can also be called ascertainment bias
question
information bias
answer
information, measurement, ascertainment bias occurs when there is a lack of comparability in the accuracy or completeness of infomation between study groups ex. recall bias (how subjects provide info) measurement error (misclassificiation bc of inaccuracy in measurement)
question
options for variables that amy acutally be causally responsible for some or all of hte apparent relationship btwn exposure and outcome
answer
confounder, effect modifer, intermediate step in causal pathway
question
confounding

answer
occurs when an apparent association btwn an exposure and an outcome is acutally the result of a 3rd factor, the confounder 3 criteria: 1. associated with the exposure under study 2. cause or correlate of the outcome under study, independent of the exposure 3. not a natural intermediate step btwn an exposure and outcome nor ir is naturally downstream of the outcome can be though of as a distortion of the effect of a risk factor (exposure or predictor) by the presence of another may mask an actual association or falsely demonstrate one when it does not exist hampers our ability to identify the true relationship between an exposure and an outcome
question
how to reduce confounding at study design
answer
restriction, matching, randomizing or can be done when analyzed
question
2 methods for dealing with confounding in analysis
answer
stratification and multivariable analysis
question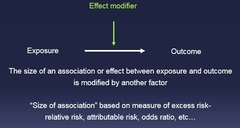
effect modification

answer
occurs when the exposure-outcome relationship btwn 2 variables is different dependong on the level (value) of a third variable; reflects differing magnitude in the level of effect for different levels or values of a 3rd variable ex. relationship btwn smoking and lung cancer is stronger for men than for women, sex is a variable that we want to highlight and display (not minimize as we would with confounding) we want the reserachers to present effect modification in results
question
prevalence ratio
answer
part of a cross-sectional calculated like an RR
question
downside of restriction
answer
lose generalizability can't evaluate impact of variable you have restricted may limit your sample
question
downside of matching
answer
can be time consuming and expensive can't evaluate impact of variable you are matching on can limit your sample size
question
downside of randomization
answer
not practical can be time consuming and expensive
question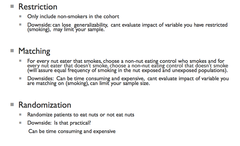
what can authors do to prevent confounding at teh design stage

answer
restriction (but then issue is generalizability) matching randomization (great way to get rid of confounders that you didn't know about)
question
what can authors do to prevent confounding at teh analysis stage
answer
stratification or multivariable analysis
question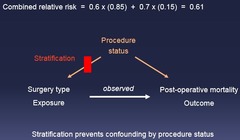
stratification

answer
how to detect and address confounding and effect modification stratify your sample by the variable that you suspect is a confounder or effect modifier and assess the assocaition between the predictor and outcome (ex. by calculating a RR) ex. stratify by smoking if the stratified RRs are about the same but different by at least 10% from the crude RR then confounding is present
question
if the stratum-specific RRs/ORs (adjusted) are equal to each other and they are equal to the crude RR/OR the suspect variable is
answer
neither a confounder nor an effect modifier you can rely on the crude RR/OR
question
If stratum-specific RRs/ORs are equal to each other but are different from crude RR/OR then the third variable is
answer
a confounder you cannot rely on teh crude RR/OR you must report an adjusted RR or adjusted OR, which is the association of the predictor and outcome accounting or controlling for the confounder
question
if stratum-specific RRs/ORs are different from each other then
answer
effect modification is present the crude RR/OR is not telling teh whole story you need the stratum-specific RRs/ORs to understandt he relationship of hte exposure and outcome at level of the effect modificer you wouldn't highlight the result as an adjust RR or OR because effect modification is not something you want to explain away, you want to highlight and understand the relationship in each group
question
is it appropriate to stratify if the 3rd variable is a biologic intermediate or downstream consequence of a predictor?
answer
no
question
restriction
answer
restrict the sample to to those w/o the potential confounder or restrict to ensure the groups are similar with respect to the potential confounder (e.g. if age and BMI are potential confounders, resricting to men with a BMI 22-29) downside: can lose generalizability, can't evaluate impact of variable you have restricted which may limit your sample
question
matching
answer
matching the 2 groups by potentila confounders (eg. for every case you have a control or >1 control matched by those factors downside: can be time consuming and expensive, you can't evaluate impact of variable you are matching on, can limit sample size
question
randomization
answer
randomize pts to exposure downside: may not be practical, may not be ethical, can be time consuming and expensive
question
A study reports that 1-2 glasses of red wine per night is associated with increased longevity (RR 3.0). However, when the authors adjust for gender, the effect is greatly reduced (RR 1.9). The results are statistically significant. This is most likely an example of
answer
confounding
question
Which approach is likely to give the best estimate of the incidence of heart attack for residents of Boston? a. Identifying the percent of patients presenting to various local emergency departments with a diagnosis code for heart attack. b. Counting the number of cardiac bypass surgeries performed in Boston in the last year. c. Asking 500 people whose names were randomly drawn from the Boston phone directory whether they had a heart attack in the last year. d. Counting the number of new heart attacks that occur in a cohort of 50,000 randomly selected Boston residents followed for the next year.
answer
Counting the number of new heart attacks that occur in a cohort of 50,000 randomly selected Boston residents followed for the next year.
question
The Harvard School of Public Health reports results of a prospective cohort study showing bottled water consumption is associated with an increased risk of migraines. They report a p value of ; 0.05. This p value provides information about which of the following (choose one): a. Bias introduced by the way data were collected b. The role of chance in the study's conclusions c. Clinical importance of the study d. Strength of the association
answer
The role of chance in the study's conclusions
question
The Harvard School of Public Health reports results of a prospective cohort study showing bottled water consumption is associated with an increased risk of migraines. They report a p value of 1 b. The difference between the groups is at least 3 standard errors from what would be expected if the null hypothesis were true c. a third, unmeasured variable might be responsible for the apparent association d. Recall bias is unlikely to have affected these results
answer
The difference between the groups is at least 3 standard errors from what would be expected if the null hypothesis were true
question
16,000 men and women aged 30 to 49 years and free of diabetes are enrolled in a study investigating the association between various dietary factors and the risk of developing type 2 diabetes. You are particularly interested in whether tea drinking habits were associated with diabetes. The following results are observed after 5 years of observation: Diabetes No Diabetes Total Drink Tea 1000 3000 4000 Do Not Drink Tea 600 11400 12000 Total 1600 14400 16000 Based upon the 2x2 table, calculate and interpret: Calculate and interpret the relative risk of diabetes for tea drinkers compared to those who do not drink tea.
answer
Relative Risk = RR = 1000/400 ÷ 600/12000 = 5 Interpretation: The relative risk of developing diabetes is 5 times higher in tea drinkers compared to those who do not drink tea
question
16,000 men and women aged 30 to 49 years and free of diabetes are enrolled in a study investigating the association between various dietary factors and the risk of developing type 2 diabetes. You are particularly interested in whether tea drinking habits were associated with diabetes. The following results are observed after 5 years of observation: Diabetes No Diabetes Total Drink Tea 1000 3000 4000 Do Not Drink Tea 600 11400 12000 Total 1600 14400 16000 Based upon the 2x2 table, calculate and interpret: The Attributable Risk comparing the risk of diabetes for tea drinkers versus non-drinkers.
answer
Attributable risk = (1000/4000) - (600/12000)= .25- .05= .20 Interpretation: The amount of risk for diabetes in tea drinkers related to tea drinking. It can also be interpreted as the excess risk for diabetes caused by tea drinking among the tea drinkers.
question
16,000 men and women aged 30 to 49 years and free of diabetes are enrolled in a study investigating the association between various dietary factors and the risk of developing type 2 diabetes. You are particularly interested in whether tea drinking habits were associated with diabetes. The following results are observed after 5 years of observation: Diabetes No Diabetes Total Drink Tea 1000 3000 4000 Do Not Drink Tea 600 11400 12000 Total 1600 14400 16000 Based upon the 2x2 table, calculate and interpret: The prevalence of tea drinking in the US adult population is believed to be 25%. Calculate and interpret the population attributable risk based upon the results of this study.
answer
Population attributable risk = AR * 0.25 = .05 Interpretation: The excess risk of diabetes that could be eliminated from the population (tea drinkers and non-tea drinkers) by eliminating tea drinking.
question
16,000 men and women aged 30 to 49 years and free of diabetes are enrolled in a study investigating the association between various dietary factors and the risk of developing type 2 diabetes. You are particularly interested in whether tea drinking habits were associated with diabetes. The following results are observed after 5 years of observation: Diabetes No Diabetes Total Drink Tea 1000 3000 4000 Do Not Drink Tea 600 11400 12000 Total 1600 14400 16000 Which 2 of the criteria for causality are supported, based on the information above?
answer
Temporality - this is a prospective cohort . Strength of association
question
16,000 men and women aged 30 to 49 years and free of diabetes are enrolled in a study investigating the association between various dietary factors and the risk of developing type 2 diabetes. You are particularly interested in whether tea drinking habits were associated with diabetes. The following results are observed after 5 years of observation: Diabetes No Diabetes Total Drink Tea 1000 3000 4000 Do Not Drink Tea 600 11400 12000 Total 1600 14400 16000 Would you say this is enough information to assert that this relationship is causal? Why or why not.
answer
No, it is not enough information, one observational study is never enough information to make such a strong conclusion. Students may also answer- the other criteria for causality have not been met or there may be confounding not taken into account in the analysis
question
Two Harvard medical students design a study to determine whether a particular local tea decreases the duration of fever and joint pain in chikungunya disease (a mosquito born illness). They use the appropriate statistical test and choose a two-tailed alpha level of 0.05 to compare the mean symptom duration between the two groups. If they had wanted to be more conservative (less likely to see a difference between the two groups if a true difference did not exist) they could do the following: a. Decrease the two-tailed alpha to 0.025 b. Include other mosquito born illnesses c. Increase the two-tailed alpha to 0.06 d. Use a one tailed test
answer
Decrease the two-tailed alpha to 0.025
question
Calculate the 95% confidence interval around the mean for a sample of 300 people with a mean heart rate of 80 beats per minute and a standard deviation of 10. Show your math.
answer
Standard Error = 10 / SQRT(300) = 0.58 THE 95% CI = 80 +/- 1.96 * SE = 80 +/- 1.13 = (78.9, 81.1)
question
When considering childhood BMI for an individual we often describe their Z-score. What does a Z-score of +3 mean?
answer
3 standard deviations above the mean
question
Identify the type of bias you would be most concerned about in the following study designs: Lung cancer cases at an urban academic hospital are compared to controls from a suburban community hospital to assess exposure to toxins in childhood.
answer
selection bias
question
Identify the type of bias you would be most concerned about in the following study designs: Patients with skin cancer (cases) and controls are asked about lifetime history of sunburns
answer
recall bias
question
A study is conducted to determine the risk of leg fracture while skiing with a new type of binding compared to the usual type. 400 young adults are recruited and randomized to using each type and followed for fracture. The analysis could include calculation of all of the following EXCEPT: a. An incidence rate ratio b. A cumulative incidence in each group c. A t-statistic to assess the certainty of the conclusion d. A relative risk to portray the magnitude of the association
answer
A t-statistic to assess the certainty of the conclusion
question
Researchers use a cohort study to determine whether the incidence of cancer is higher in those taking daily vitamin D supplements versus those not taking supplements. They report a relative risk for cancer in vitamin D users versus non-users of 1.22 (95% CI: 0.91, 1.46). Examine the relative risk and 95% confidence interval, how would you interpret these results?
answer
Based on these data there was no statistically significant difference in the Vitamin D users and non-users with respect to Cancer. The 95% confidence interval for the relative risk (RR) includes 1(no association). The data show an increased relative risk of 22% which given this 95% CI did not meet statistical significance.
question
Researchers use a cohort study to determine whether the incidence of cancer is higher in those taking daily vitamin D supplements versus those not taking supplements. They report a relative risk for cancer in vitamin D users versus non-users of 1.22 (95% CI: 0.91, 1.46). What type of statistical error (error due to chance) could have been made?
answer
Type II or "beta" error when you reject the null, the only type of error you can make is rejecting it falsely (type 1 error). when you don't reject the null, the only mistake you can make is a type 2 error.
question
You would like to make available as much information as possible in describing the results of a cohort study, but can only report 1 of the following. Which would you choose? a. The risk in each group b. The attributable risk c. The relative risk d. The odds ratio
answer
The risk in each group - you can calculate the other things from it
question
variability
answer
the standard error
question
How are CI's and p values related?
answer
If p<.05 then -the 95% CI for the mean difference will exclude 0 (there is no mean difference) -the 95% CI for the risk ratio will exclude 1 -the 95% CI for the odds ratio will exclude 1 all of these say that there will be no difference if 95% CI's do not overlap, they are significantly different at p<.05 or smaller- basically, if they don't overlap, you can assume that the p value will be less than .05 if 95% CI's overlap somewhat, their difference may still be significant, and you need to look at the CI for the difference, or look at the P-value (keep track of what the p value is testing) - you could put the difference on a different scale with its own CI based on the standard error of the difference
question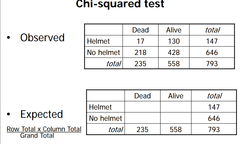
How to calculate expected data for a chi-squared test - meaning that the null is true

answer
(row total x column total)/ grand total
question
proportion vs. odds
answer
proportion: the # of times an event of interest occurs dividied by the total possible # of opportunities odds: the # of times an event occurs divided by the # of times it does not occur any proportion can also be expressed odds ex. if the risk of rain is .5, the odds are 1:1
question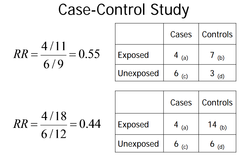
Why can you not use risk ratios for case-control studies?

answer
we can select any # of controls for each case -> increased # of subjects helps with statistical power. this means that we can't calculate risk ratios because you've preset the number of controls -> it's not up to us to decide who gets cancer and who doesn't we can't directly calculate relative risks from case control data because we don't know the prevalence of disease in the population -we DETERMINE the prevalence of dz in our study group, based on the ratio of controls to cases that we select (fabricated) but we can calculate the odds of exposure among cases and among controls so we use the OR to approximate the RR OR = (odds of exposure among cases)/(odds of exposure among controls) =(axd)/(bxc) "the odds of nut exposure in ppl with cancer are .29 times that of people without cancer"
question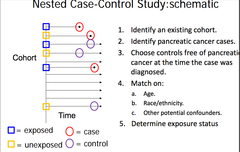
nested case-control

answer
both a cohort and a case-control study 1) find a researcher who has been following a large cohort of initially healthy subjects for years (ex. she saved blood samples at the beginning) 2) select cases & controls from teh samples (no wasting resources of blood) 3) measure biomarker x in cases and controls -has speed of case-control but without the bias -can calculate the risk of dz (not just approcimate the RR by the OR) because you know the real incidence from teh cohort so you can use these gindings from a subset and adjust them analytically
question
Major types of bias
answer
selection - cases and controls or exposed and unexposed samples are chosen such that they represent different underlying populations than those we wanted to compare information (ex. recall, measurement)
question
what type of bias? case-control study outcome: pancreatic cancer exposure: coffee drinking cases: pancreatic cancer patients in GI clinic population controls: non-pancreatic cancer patients in CI clinic population
answer
selection bias
question
information bias
answer
difference in accuracy or completeness of information about study groups AKA ascetainment or observation bias can be differential (leads one to over or under estimate an effect) or non-differential (random-dilutes an effect) types: recall, measurement, misclassification
question
what type of bias? cohort study examining risk factors for developing eye dz myopia may emerge (erroneously) as risk factor for eye dz.
answer
information bias
question
hazard ratio
answer
a kind of relative risk for a dichotomous outcome (dead/alive, dz/no dz) measure TIME to event cox proportional hazards regression -allows inclusion of subjects with varying lengths of follow-up -generates an estimate of relative risk (HR) -assumes that the ratio of the risks for persons w/ and w/o the variable of interest is teh same over the entire period (proportional hazards assumption)
question
prevalence
answer
the proportion of people with an outcome a
question
multivariable modeling
answer
like stratification, allows us to isolate the relationship between 2 variables, holding all other varaibles constant can be thought of as multiple, simultaneous stratified analyses (trying to control for multiple confounders like age, sex, and hair color, all at the same time) "regression models" - predict outcome y based on values of predictor variables (X1, X2, ...) and we fit the best eqn we can to teh data and use it to predict y
question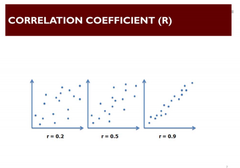
correlation coefficeint

answer
measures the strength and direction of relationship between 2 variables - or describes the extent to which 2 variables tend to change together; specifically, addresses the linear correlation between 2 continuous variables. If r is zero, it means that Y neither increases nor decreases reliably as X increases. If r is ?1, it means that Y decreases steadily as X increases. If r is +1, it means that Y increases steadily as X increases. R can only be calculated for 2 continuous variables Pearson correlation coeffecient (R) is a statistical method for quantifying teh correlation between 2 variables. R comes out as a value between -1 an d+1. The sign (+) or (-) indicates positive or negative slope. The closer that R is to 1 (either sign) the stronger the correlation R?squared is the square of the correlation coefficient r. It quantifies the amount of variability of the data that is captured by the line. If the data were distributed perfectly along the line, R?squared would be 1, because the line would describe all of the variability in the data. If the Y values had no association with the X values, then R?squared would be zero, because none of the variability in the data would be captured by a single line.
question
what does a correlation coefficient (R) close to 0 tell you?
answer
just means that the relationship between the two variables is not linear, not that there isn't a relationship R^2 ranges from 0 to 1; mulirplied by 100 can be thought of as the percentage of the variance in the outcome accounted for by the independent variables
question
How would you interpret the coefficient on male?

answer
Being male increases NO?AIR scores by 1 on average, holding age, and pregnancy status constant What is the predicted NO?AIR score for a 67 year old male with a BMI=26. (Plug in values) = ?4.6 + 0.3 (26) + 0.03 (67) + 0.3 (0) + 1(1)= ?4.6 + 7.8 + 2.01 + 0 + 1 = 6.2
question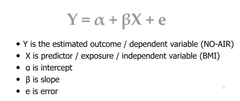
simple linear regression

answer
finds teh straight line that best captures the relationship between continuous dependent variable and eighter continuous or categorical outcome variable if there is no relationhsip btwn X and Y, the best estimate of Y given any X is the avg Y (horizontal line) Beta = 0 is the null doesn't account for other variables that may influence Y (confounders, mediators, effect modifiers)
question
regression line

answer
the straight line passing thru the data that minimizes teh sum of squares (SOS) of the vertical distance btween the measured data and the fitted line (aka least-squares method)
question
logistic regression

answer
based on dichotomous yes/no outcome variable (fitting a straight line) so assume a logarithmic relationship fit an equation to predict the odds of an individual having the outcome, where odds are the ratio of hte probability of an even happening over it not happening or: p/1-p take ln of both sides to get ln(odds) to get a line: ln(p/1-p) = intercept +B1X1+B2X2+ residual error -use data to create best equation with smallest residual error, giving us parameter estimates (Beta) that go with each predictor -then can plug in values for x1 and x2 and calculate odds of outcome in logistic regression, Beta has no units, but e^beta is the odds ratio associated with each predictor variable, in predicting the odds of the outcome
question
What are the formats for the predictor variables in logistic regressions?
answer
e^beta may be categorical (ex. odds of ratio for being male in developing lung cancer) or interval variable (odds for each additional kilo of body fat for gettinc lung cancer
question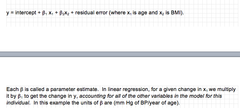
parameter estimate (beta)

answer
In linear regression, for a given change in X1, we mulitply it by beta1 to get hte change in y, accounting for all of the other variables in the model for this individual one can do this with many variables in mulitdimensional space -> adding more and more axes (dimensions) to the graph will allow us to fit the observed data as closely as possible to an equation
question
residuals

answer
the differences between the observed and the estimated values, can be thought of as the error in estimation
question
interaction
answer
occurs when the effect of a risk factor on an outcome is changed by the value of a third variable -> the effect of a risk factor on outcome differs depending on the value of the interaction variable aka effect modification when investigators search for interactions, they are performing subgroup analyses and the more interactions searched for the more subgroups tested, and the greater the possibility that the relationship etween the dependent variable and the outcome will differ bc of chance in one or more of the diff subgroups
question
survival analysis
answer
measurement of time to event given by cox proportion hazards regression (mortality) and kaplan meier curve (survival) often do both together; while survival function is probability of surviving (or not having event), hazard function is "probability" of dying (or having event) dependent variable (Y) is composed of time to event and event status
question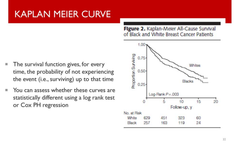
kaplan meir curve

answer
shows survival - the probability of NOT experiencing the event up to that point
question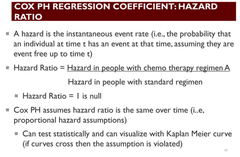
hazard ratio

answer
from the cox-proportional hazards regression the relative risk of an event, associated with the predictor variable an estimate of relative risk (except RR are cumulative over entire study whereas HR is instantaneous risk not intuitive to interpret: -not probabilities -analagous but distinct from RR -more/less likely to experience an event
question
cox-proportional hazards regression
answer
used when the outcome is time to an event (like death or relapse)- measures time to event (survival analysis); also dichotomous outcome like the logistic regression but when the outcome is the probability of the event (eg. dying) during a particular tiem interval, given that a subject has survived til that time yields co-efficeints for predictor varaiables that are expoentiated to odds ratios like logistic regression basically allows for control of multiple variables
question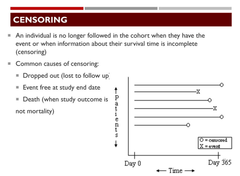
censoring

answer
an individual is no longer followed in the cohort when they have the event or when information about their survival time is incomplete common causes: drop out (lost to follow-up) event free at study end date death (study outcome is not mortality)
question
What are 3 common types of multivariable models used in the medical lit?
answer
Type of Regresstion Outcome Variable linear continuous (interval) logistic dichotomous (yes/no) proportional hazards length of time til outcome
question
which of the multivariable models does one use when and why?
answer
linear regression- when we have categorical variables as predictors (like geneder) assigning them values like 0 and 1; assumption that hte outcome is a straight line (not always true) logistic regression - categorical variables (line won't work with 1's and 0's); assume a logarithmic relationship proportional hazards model (cox regression)- when you want to follow patients over time/ dichotomous outcomes
question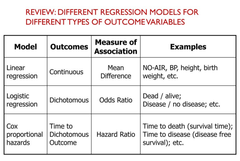
What are the parameters estimates used for each multivariable model, and, in the case of logistic and linear regression, how do these relate to the mathematical principles of regression?

answer
linear - interval outcome (incremental relationship between exposure and outcome); variable coefficients have linear relation with outcome (beta) logistic regression - dichotomous outcome/logit/ln(odds) = odds ratio; model constrains the probability of outcome 0 to 1 (e^beta) proportional hazards regression - also dichotomous outcome but with length of time to discrete event; useful for longitudinal studies in which persons may be lost to follow-up
question
What can Cox-proportional hazards tell you that linear and logistic regression cant
answer
A major advantage of proportional hazards analysis is that it includes persons with varying lengths of follow-up, which varies in longitudinal studies fo several reasons, including persons being lost to follow-up or patients being enrolled at different times also show survival models with correctly incorporated info from censored and uncensored individuals - dependent variable is composed of time to event and event status
question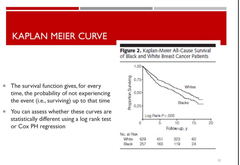
What do Kaplan-Meier curves show you?

answer
survival function - for every point in time, the probability of not experiencing the event (surviving) up to that poitn visualization of the proportionality assumption (lines shouldn't cross)
question
How are Kaplan Meier curves related to cox-proportional hazards?
answer
they are both survival analyses but while survival function is probability of surviving (or not having event), hazard function is "probability" of dying (or having event)
question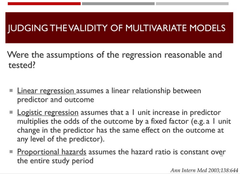
What considerations do you need to keep in mind when appraising hte validity of models used in the med lit?

answer
1. Were the assumptions of the regression reasonable and tested? linear (linear relationship between exposure and outcome), logistic (1 unit increase in predictor multiplies the odds of the outcome by a FIXED factor), cox PH (hazard ratio constant over time) 2. were the correct variables included in teh model? are key confounders missing? did authors consider/assess for effect modification? were mediators handled appropriately? 3. was sample size big enuf? greater than or equal to 10:1 ratio of observations to co-variates for linear regression (some recommend 20) and greater than equal to 10:1 ratio of events to co-variates for logisitc reliability depends on its purpose Assumptions: 1. intent of the model can be explanatory (causes of an outcome) or predictive (predict an outcome but not concerned about whether variables are predictors or associations); explanatory- reliability means that a diff set of data would probably yield a model with the same variables and similar coefficients; predicitive- predicts outcomes equally well for settings or for data other than those for which it was developed 2. multivariable modesl assume that increases (or decreases) in an interval-independent variable will be associated with increases (or decreaes) in the outcome variable - basically assumes a linear relationship. Bc researchers usually do not report assessing the relationship of an interval-independent variable to the outcome over the range of value for the independent variable, it can be difficult for readers to independtly judge this aspect of the analysis 3. assume that observations are independent of one another- models cannot incorporate the same outcome occurring more than once in the same person 4. sufficient sample size - rule of thumb: at least 20 persons for each independent variable and at least 10 outcomes for each independent variable eligible to be included in a logistic regression or proportional hazards
question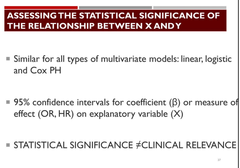
What considerations do you need to keep in mind when interpreting teh conclusions drawn from models?

answer
1. as in all stats tests, we are making inferences from a sample 2. sample must be large enough (at least 10-20 observations per predictor variable included) simple Linear: 1. statistical significant relationship may not be clinically meaningful 2. statistically significant relationship doesn't establish a causal relationship
question
what variabes do we include in a mulitvariable model?
answer
1. we know from other research to be important 2. others that add to the ability of the model to explain or predict teh outcome 3. predictor variables whose inclusion changes the parameter estimates of other predictors substantially (;10%) suggesting confounding between them
question
how to identify effect modification in regression models?
answer
startify the data on the potential effect modifier run the same model on each stratum see if the effect estimates for predictor variables of interest differ report the stratum specific results
question
Match the following measures of effect with the analytic approach: A. Kaplan- Meier 1. Survival curves B. Logistic regression 2. OR C. Linear regression 3. Change in y per change in x D. Cox proportional hazards regression 4. HR
answer
Kaplan- Meier - Survival curves Logistic regression - OR Linear regression - Change in y per change in x Cox proportional hazards regression - HR
question
Which of the following is true about multivariable modeling? Specific choice of independent variables to include is less important for explanatory than predictive models Sample size for logistic regression is unrelated to the number of outcomes or events. Choice of logistic vs. linear regression is based on the variable type of the independent variable In linear regression, the regression coefficient (beta) tells you the increment of change in the dependent variable for every unit change in the independent variable
answer
In linear regression, the regression coefficient (beta) tells you the increment of change in the dependent variable for every unit change in the independent variable In the explanatory model, the goal is to correctly characterize the relationship of each predictor to the outcome variable so the identiteis of the variables are critical; the accuracy of a predictive model's output is more important than the details of its inputs (just needs to perform as well under different circumstances) the accuracy of the prediction is more important (for the individual) so you might want to include more variables, include the ocean to predict
question
When interpreting the results of a multivariable model, which of the following is false? Cox-proportional hazards allows one to compare groups regarding both the occurrence of an event and time to event In linear regression a "beta" close to zero suggests a strong relationship between exposure and outcome R2 is a measure of how close the observed the data are to the fitted regression line . The presence of an effect modifier can be tested using an "interaction term"
answer
In linear regression a "beta" close to zero suggests a strong relationship between exposure and outcome
question
Which of the following is true of logistic regression? Odds ratios can be calculated by exponentiating a parameter estimate (beta) The equation directly calculates a relative risk Only dichotomous predictors can be included in the model The log-odds (logit) of the outcome is related to the predictors by an s-shaped curve
answer
Odds ratios can be calculated by exponentiating a parameter estimate (beta)
question
Doll and Hill did a prospective cohort study on smoking habits. Up to that point, only retrospective studies had been done. What were they looking to measure that hadn't been previously measured?
answer
in order to support the criterion of temporality information on the exposure had to be collected before any outcomes occurred
question
NVD .18 (95% CI: .12, .24) CS .32 (95% CI: .20, .44) the CIs overlap here, why would the authors report a p-value (.04)
answer
This is counter-intuitive until you realize that the confidence intervals are for each of the estimates. The p-value tests whether the difference between them is different from zero. If we did a CI around the difference, it would use the SE of the difference. The n would be larger (combining the n from both samples) and it would use the std. deviation of the difference. The point is that it's important to be clear about what the confidence interval bounds.
question
Think about the CI in one of the groups. What does this actually mean? After all, we measured the pre-pregnancy BMI of all the participants, and we can tell exactly what the mean is, and where 95% of the observations fall. Why do we have to calculate a CI based on a standard error?
answer
Let's take the CS group. If we just want to know about our sample, the mean and standard deviation describe it well. However, we want to know what we can estimate about the population of all mothers like those in our study, who delivered infants by c-section, based on the information just from 284. Our 284, just by chance, may not exactly represent the overall population. The 95% CI tells us that if we took repeated samples of 284 from the population of mothers like this, and calculated the 95% CI's, then 95 out of 100 times, the interval (and it would be different each time) should include the true population mean.
question
What is relative risk measure of association an example of: a) Prevalence ratio b) Incidence density ratio c) Cumulative incidence ratio d) Hazard ratio
answer
Cumulative incidence ratio
question
Assume the national c-section rate is 25% and the attributable risk is 10%. The population attributable risk of overweight/obesity due to c-section
answer
PAR = Attributable risk * Prevalence of the risk factor OR Risk of disease in the total population - Risk of disease in the unexposed group = .10* .25 = .025, (25/1000)
question
What's so special about randomized controlled trials?
answer
-most internally valid study design for determining the impact of a treatment (compared to placebo), or comparison of two treatments -designed to test a particular hypothesis about a specific exposure and outcome link (SPECIFICITY-Hill) - TEMPORAL sequence known (Hill) -measurement standardized -data collected prospectively -POTENTIAL CONFOUNDERS (KNOWN AND UNKNOWN) EQUALLY DISTRIBUTED
question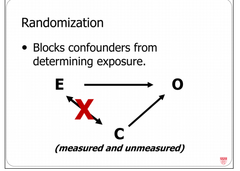
randomization

answer
(stratified or blocked, cluster) blocks confounders from determining exposure balance of patient characteristics, equally distributing potential confounders across the 2 groups -randomization should not be gamed -levels of randomization: patient level (each assigned independently of prior one); stratified randomization (subjects randomized within strata of a third variable or risk group); block randomization (similar to stratified but usually divided into 'blocks" according to a variable not of interest to teh researchers such as by calendar week to eliminate seasonal effects)
question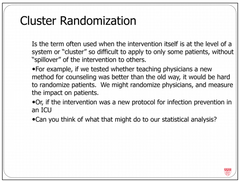
cluster randomization

answer
kinda like Greenlight!
question
what does blinding the patient do?
answer
prevents knowledge of exposure leading to outcome via an alternative pathway (from the one being tested) ex. if I Know that I am in the placebo arm of a study for a pain reliever, I might take more ibuprofen
question
why blind the investigator?
answer
decreases bias (investigator may look harder for outcome when you know they're exposed) decreases confounding (intervention subjects may get more care) or differential care
question
comparative effectivness
answer
studies that compare two treatments in current common use to determine (head to head) if one is better -; uses an active control (comparison vs. standard of care or another established treatment) but sometimes hard to tell the difference ex. Relief and TOPCLOT
question
intention to treat vs. per protocol
answer
ITT- includes all subjects in the arm to which they were originally assigned, whether or not they had good adherence, dropped out of the stufy, or even received the intervention at all; generally best primary analysis for an RCT per protocol- analyzes subjects according to the intervention they actually received (eg. those who took the right number of pills)
question
non-inferiority
answer
equivalence and non-inferiority trials test whether a new treatment is likely to be "at least as good" as an existing treatment may be done bc new treatment is less expensive, has fewer side effects, etc. same basic trial design as a comparative effectiveness but specification of statistical limits differs equivalence trials set bounds beforehand (set on clinical judgements) within which we would consider treatments equivalent - clinical threshold is "not substantially worse" and an 95% CI w/in this is evidence of "non-inferiority"
question
uncomplicated otitis media has a resolution rate at 7 days of about 94% with antibiotics, and 80% at 7 days without. What is the NNT?
answer
.94-.80 = .14 NNT = 1/.14 = 7 For every 7 kids treated, an additional one will have a resolution of OM at 7 days
question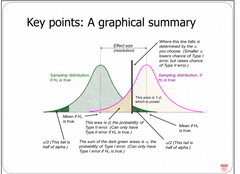
power and type II error

answer
the chance that you will conclude, from your sample that there is a difference between the groups (reject H0) at the level of significance (alpha) that you have pre-specified power= 1-beta basically, the chance that you won't make a type II error; as the risk of type II error decreases, power increases chance that you will detect a difference of a pre-specified magnitude in the sample if it exists in the population key point: we can only talk about power with respect to a particular difference we wish to detect
question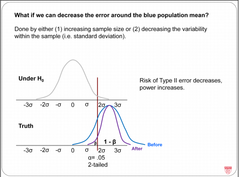
What are the ways to decreases type 2 error?AKA increase power

answer
1. allow a more generous type 1 error 2. decrease error around the population mean by increasing the sample size or decreasing the variability within the sample (the SD) required sample size (N) is proportional to: desired power, difference you wish to detect (smaller distance between teh means under Ha), variability (SD) withint he sample, risk of type 1 error in other words more power when larger N larger diff. btwn H0 and Ha larger alpha smaller SD
question
number needed to treat
answer
a way to express results; the # of pts that would need to be treated, in order to see the benefit in one: NNT = 1/AR outcomes are often dichotomous and diff. in proportions (ex. attributable risk) are often the primary outcomes NNT expresses the same information in a way that may facilitate understanding by patients (and clinicians)
question
number needed to harm
answer
if some percentage have a side effect of the drug NNH = 1/attributable risk of the harm ex. 8% have some side effect of antibiotic NNH = 1/.08 = 12 , for every 12 patients treated, one will be "harmed" in this way
question
Why does "intention to treat" analysis make sense as the primary analysis of a trial? Does it vary with the study question? How?
answer
intention to treat analysis are usally considered primary and per protocol may be useful as secondary
question
randomized controlled trial
answer
most internally validated study design
question
challenges of randomized controlled trials
answer
1. randomization often fails to guarantee completely equivalent groups (may need to adjust in analysis phase, particularly for smaller trials) 2. defining the outcome- often the timeframe of a trial does not allow direct measurement of long-term outcomes (eg. mortality) 3. ensuring high-compliance and follow-up 4. internal validity is still vulnerable to unblinding & post-hoc analyses 5. external validity is the problem (will results apply to pts in front of me): pts likely not reflect avg pts; care & attntn. in tirals doesn't reflect usual practice; short follow-up may not allow assessment of all outcomes; only gives avg. efficacy
question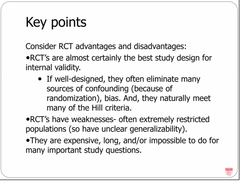
RCT advantages ; disadvantages

answer
disadvantages: 1. consider outcomes carefully. Many ultimate health outcomes (death, future heart dz) are difficult ot measure so what proxy measures will still be practical to collect, but useful and valid in making conclusions 2.blinding: consider blinding at several levels, when is it practical when ethical? 3. safety: if realy are in equipoise, a DSM board may be needed
question
All the below are particular strengths of most randomized trials, compared to other study designs EXCEPT: Minimizing confounding Producing generalizable results Ensuring measurements are standardized Having strong internal validity
answer
Producing generalizable results
question
Statistical power is inversely related to: Accepting a less stringent threshold for risk of type I error The sample size of the study The variability (e.g. std dev) within the sample Magnitude of detectable difference chosen
answer
The variability (e.g. std dev) within the sample
question
The following is generally true about randomized trials comparing an active agent to a placebo: A one-tailed test is used because the active agent is unlikely to be worse They are considered comparative effectiveness studies Patients are randomized in clusters The primary analysis should be done as "intention to treat"
answer
The primary analysis should be done as "intention to treat"
question
An RCT is conducted in which the resolution rate is 41% in the placebo group, and 61% in the active treatment group. What is the number needed to treat (NNT)? 5 20 1.5 .2
answer
5
question
The following may be reasons that an RCT is not "double blind" EXCEPT: Blinding may be difficult because of a smell, taste, or side effect of the active agent Blinding either the patient or clinician may be unsafe An unblinded study was preferred because it is more internally valid A behavioral intervention was tested
answer
An unblinded study was preferred because it is more internally valid
question
In a RCT comparing a new drug for treatment of multiple sclerosis vs. an active control, the RR for number of new lesions in brain MRI in 2 years was 0.96 with 95% CI 0.91 to 1.02. This result can be considered successful: If this was a per protocol analysis If the sample size was small so that the CI crossed 1 If the study was designed as an equivalence trial All of the above
answer
If the study was designed as an equivalence trial
question
Screening vs diagnostic testing
answer
screening is the use of a test to identify a disease before any clinical signs or symptoms manifest- special type of testing. In diagnostic testing, symptoms are already present Screening methods may include asking questions, physical examination (e.g., skin exam for atypical moles), blood tests (e.g., cholesterol or PSA level), or imaging studies. Typically, prevalence of the condition is lower than in clinical diagnosis situations, in which patients present with symptoms. There are some general considerations re: which conditions make sense to screen for , eg whether it is detectable before symptoms emerge, whether early treatment confers benefit, and whether benefits to those with a positive screening test result outweigh the harms of screening (including the harms of false positive results)
question
characteristics of a good screening test
answer
prevalent condition morbid condition (ex. rare PKU) influence the outcome availability of an accurate screening test screening test is low risk screening test is acceptable to patients screening test is cost-effective
question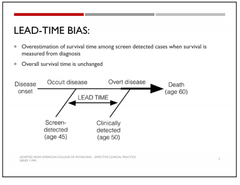
Lead time bias

answer
screening bias People with the disease who get screened and then get treatment survive longer than people with the disease who do not get screened. You may mistakenly conclude that screening + treatment cause improved survival, when what is really going on is that patients diagnosed earlier have more time to survive, even if treatment isn't helpful and their actual life expectancy may be no different.
question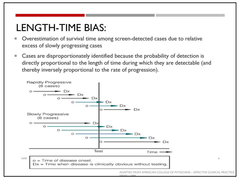
Length time bias

answer
screening test bias Cases of a particular condition (e.g. cancer) that are progressing more slowly will be more prevalent in a screened population. Remember, you can only call it "screening" if you don't already know the patient has the disease. So if some patients with the disease spend more time "having it without being sick from it," they are the ones you'll find by screening. In contrast, patients with rapid disease progression spend less time "having it without being sick from it." That means that patients with positive screening tests appear to have better outcomes, but it is not because screening + treatment is better - instead it's because the disease in patients detected by screening is different from that in patients who present with symptoms
question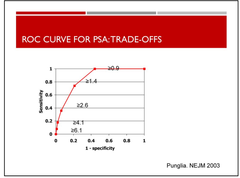
Benefit and harm

answer
What's the right cutoff? There is none. It's a question of values: The positive consequences of -true positives (correctly identifying of a disease) -true negatives (correctly ruling out) The negative consequences of -false positives -false negatives
question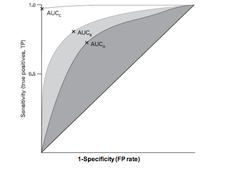
ROC curves

answer
summarize sensitivity and specificity over different cutoffs allows you to visually examine tradeoffs between true and false positives and to compare performance of different tests by comparing the area under the ROC For tests with continuous results, we choose the cut-off below which we will consider normal and above which we will consider abnormal (or vice versa). In doing so, there is always a trade-off. If we change our cutoff to increase sensitivity then specificity goes down. If we change our cutoff to increase specificity then sensitivity goes down. Such tradeoffs are easily shown in Receiver Operating Characteristic Curves, which graph 1-specificity on the x axis and sensitivity on the y axis. We can compare different tests by graphing them together and showing their relative areas-under-the-curve (AUCs). An ROC curve is a plot of the true positive rate (sensitivity) against the false positive rate (1-specificity; recall that specificity reflects true negatives) for the possible cutpoints of a diagnostic test. The closer the curve follows the left-hand border and the top border of the ROC space (passes through the upper left hand corner), the more accurate the test. Such a test has both high sensitivity and high specificity. The closer the curve comes to the 45- degree diagonal line the less accurate the test
question
Likelihood ratios

answer
another way to assess balance btwn sensitvity and specificity (other than ROC) while also comparing proability of disease at different cut-odds and probability of disease with sequential testing LR= probability of result in ppl w dz/ probability of result in ppl wo dz pretest odds x LR = posttest odds of dz the probability of a given result in a person with the disease divided by the probability of that result in people without the disease. Likelihood ratios combine sensitivity and specificity, are independent of the prevalence of disease, facilitate combining tests, and allow comparisons of information from different levels of the same test. As with anything, estimates from studies of sensitivity, specificity, and LRs can be affected by chance (confidence intervals can be calculated) or bias.
question
Threshold probability
answer
The probability above or below which you will take action (e.g. order an additional test, prescribe a treatment). Varies with the clinical condition and the potential benefits of treatment and harms of undertreating, overtreating, or doing further testing.
question
Sensitivity
answer
Among patients with the disease, how often is the test correct? = Correct tests among patients who have disease = True positives ÷ (true positives + false negatives) A perfectly sensitive test never misses disease. Sensitivity and specificity are attributes of a test. However, clinicians are more concerned about the probability of their patient having the disease in question- the post test probability of disease.
question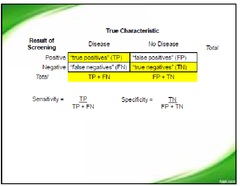
Specificity

answer
Among patients without the disease, how often is the test correct? = Correct tests among patients who do not have the disease = True negatives ÷ (true negatives + false positives) A perfectly specific test never classifies a well person as sick. Sensitivity and specificity are attributes of a test. However, clinicians are more concerned about the probability of their patient having the disease in question- the post test probability of disease.
question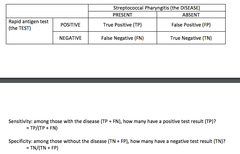
Pretest probability

answer
The chance that the patient has the disease before you have the test results. This is simply the prevalence of disease among patients with the same characteristics. Determined by a combination of descriptive epidemiology and clinical gestalt
question
Post test probability
answer
The chance that the patient has the disease after you have the test results. This is also called the predictive value of the test. It depends on the test's sensitivity & specificity, and on the pre-test probability of disease.
question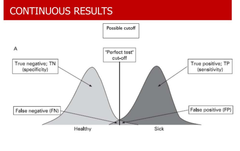
cutoff

answer
We often talk about diagnostic tests as "positive or negative." Even in these cases, there is often an underlying value of a continuous variable that has been chosen as the cutoff for "positive" vs. "negative." Choosing an appropriate cutoff depends on how we weigh the risks of false positive and false negative errors.
question
Positive predictive value
answer
(PPV) = TP/(TP +FP) Is the chance that a positive test result accurately signifies the presence of the disease (also called Predictive Value Positive or Post-test Probability of disease given a positive test). All post-test probabilities are dependent on the test characteristics, but also on the pre-test probability of disease. For example, a positive test result (even for a test with reasonable sensitivity and specificity) in a patient with a very low pre-test probability may still not indicate a high probability of a disease. This is critical in interpreting diagnostic test information.
question
Negative predictive Value
answer
(NPV) = TN/(TN +FN) Is the chance that a negative test result accurately signifies the absence of the disease (it is the Post-test Probability of not having disease given a negative test). All post-test probabilities are dependent on the test characteristics, but also on the pre-test probability of disease. For example, a positive test result (even for a test with reasonable sensitivity and specificity) in a patient with a very low pre-test probability may still not indicate a high probability of a disease. This is critical in interpreting diagnostic test information.
question
Post test probability negative
answer
Note that the Post-test Probability of disease given a negative test = (1-NPV). This is the chance that a patient has the disease after a negative test result.
question
What type of study is the Mortality Results from a Randomized Prostate-Cancer Screening Trial?
answer
rct From 1993 through 2001, we randomly assigned 76,693 men at 10 U.S. study centers to receive either annual screening (38,343 subjects) or usual care as the control (38,350 subjects).
question
What was the study question and why is it important?
answer
What is the effect of screening with prostate-specific-antigen testing and digital rectal exmination on teh rate of death from prostate cancer; to determine the effect of screening on prostate cancer mortality -usefulness of screen on mortality is unknown There has been no comprehensive assessment of the trade-offs between benefits and risks. Despite these uncertainties, PSA screening has been adopted by many patients and physicians in the United States and other countries. The effect of screening with prostate-specific-antigen (PSA) testing and digital rectal examination on the rate of death from prostate cancer is unknown. This is the first report from the Prostate, Lung, Colorectal, and Ovarian (PLCO) Cancer Screening Trial on prostate-cancer mortality.
question
What was the study population
answer
men between the ages of 55 and 74 years were enrolled at 10 study centers across the United States
question
What was the primary outcome and how was it measured?
answer
Cause-specific mortality for each of the PLCO cancers was the primary end point. In addition, data on PLCO cancer incidence, staging, and survival were collected and monitored as secondary end points
question
What was the exposure and how was it measured?
answer
screening for prostate cancer 1.annual PSA testing for 6 years and 2. annual digital rectal examination for 4 years. PSA tests were analyzed with the Tandem-R PSA assay until January 1, 2004, and with the Access Hybritech PSA after that date (both assays were manufactured by Beckman Coulter). All tests were performed at a single laboratory
question
What type of threats to internal validity might this study be vulnerable to? (Think generally about this type of study and specifically about this particular study)
answer
1. confounding of age and center/geography: blocks stratified according to center, age, and sex 2. Fourth, and potentially most important, improvement in therapy for prostate cancer during the course of the trial probably resulted in fewer prostate-cancer deaths in the two study groups, which blunted any potential benefits of screening.19,20 It is important to note that our policy of not mandating specific therapies after cancer detection on screening resulted in substantial similarities in treatment according to tumor stage between the two study groups. 3. information bias (different ways of gathering information): This active follow-up was supplemented by periodic linkage to the National Death Index to enhance completeness of end-point ascertainment.
question
What about external validity?
answer
specific to men in that age group? loss to follow-up: Subjects who did not return the questionnaire were contacted by repeat mailing or telephone.
question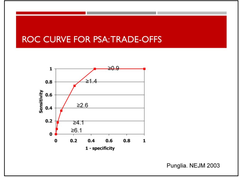
What is the takeaway message you take from the study? (Think about benefits and harms at the individual level and population level. Are they different? Why or why not?)

answer
In November 2008, the board unanimously recommended that the current results on prostate-cancer mortality be reported, after notification of study investigators and subjects, on the basis of data showing a continuing lack of a significant difference in the death rate between the two study groups at 10 years (with complete follow-up at 7 years) and information suggesting harm from screening more cancers were being diagnosed but they were dying at the same rates across the two groups
question
why use odds and LR?
answer
combines sensitivity and specificity independence of prevalence (unlike PPV/NPV) Helps us maximize the information from an individual's test results combine tests compare tests differing levels of the same test degrees of abnormality
question
correlation
answer
simple way to assess the relationship between two CONTINUOUS variables Plot the values of the two variables on a graph
question
Pearson Correlation Coefficient (R)
answer
a statistical method for quantifying the correlation between two variables R comes out as a value between -1 and +1. The sign (+) or (-) indicates positive or negative slope. The closer that R is to 1 (either sign) the stronger the correlation
question
Why multivariable analysis?
answer
like stratified analysis, allows us to find the relationship between 2 variables while holding all others constant In stratified analysis, we stratify by a variable that we suspect might be a confounder (e.g. age), and look at the exposure-outcome relationship for different age strata. But what if we are interested in considering mulitple variables Stratified analyses become unwieldy, so we instead turn to multivariable analysis, which can be thought of as multiple, simultaneous stratified analyses.
question
regression models
answer
fit a mathematical equation to predict the value of an outcome (y) based on values of predictor variables (x1, x2, x3...). We fit the best equation we can to the data we have and then can use it to predict the outcome of y for new values of x we might encounter
question
how to pick your multivariable model?
answer
depends on outcome variable Linear - continuous (interval) logistic - dichotomous (yes/no) proportional hazards - length of time until outcome
question
if we are trying to use linear regression, and our data do not perfectly fit the line, what do we have?
answer
We have residual error in our prediction that we'd like to reduce. So, the equation is actually y = intercept + ?x + residual error
question
how do we decrease our resideula error in our linear regression model?
answer
adding a third variable (axis) to the graph If BMI is a useful predictor (in addition to age), the data points will be closer to the line (less residual error) - a more accurate prediction. y = intercept + ?1 x1 + ?2x2 + residual error (where x1 is age and x2 is BMI). conceptually one is simply adding more and more axes to the graph in order to enable us to fit the observed data as closely as possible to an equation
question
what is Beta?
answer
parameter estimate In linear regression, for a given change in x1 we multiply it by ?1 to get the change in y, accounting for all of the other variables in the model for this individual. In this example the units of ? are (mm Hg of BP/year of age)
question
Is teh relationship between a predictor and an outcome always a straight line?
answer
no! there are other assumptions plus, we can make CATEGORICAL predictors (eg. gender) by assigning them a value (0,1)
question
if our outcome is dichotomous, what kind of multivariable model would we use?

answer
Fitting a straight line won't work. Instead, we fit an equation to predict the odds of an individual having the outcome (Recall that odds are the ratio of the probability of an event happening over it not happening, or: p/1-p) ln(p/1-p) = intercept + ?1 x1 + ?2x2 + residual error As in linear regression, make a best fit line (this time logistic) to minimize residual error and use the line to come up with a parameter estimate for each predictor so that with new values of x we can calculate the odds of the outcome • The predictor variables may be categorical (e.g. e? would be the odds of ratio for being male in developing lung cancer) or an interval variable (e? would be the odds for each additional kilo of body fat for getting lung cancer)
question
in logistic regression, what are the units of Beta?
answer
? has no units, but e^? is the odds ratio associated with each predictor variable, in predicting the odds of the outcome.
question
what does it mean if an odds ratio is 1?
answer
• As always, if an odds ratio is 1.0 there is no effect, ; 1 a positive association, ;1 a negative association with the outcome
question
what do you do if you have several odds ratios from different predictors?
answer
mulitplication! • And, if you have several odds ratios from independent predictors, they can be multiplied to provide an overall estimate of the odds of the outcome
question
what do you use when the outcome is time to event
answer
Proportional Hazards Models (Cox Regression) (like death, or relapse). It is analogous to logistic regression, but the outcome is the probability of the event (e.g. dying) during a particular time interval, given that a subject has survived until that time it yields co-efficients for predictor variables that are exponentiated to odds ratios (like logistic regression). Models can include several predictor variables at once, so control the effects of all of the others, just like the models above. We can generally think of the "hazard ratio" from these models as the relative risk of the event, associated with the predictor variable.
question
explanatory vs predictive multivariate models
answer
explanatory: we seek information about potential causes of an outcome predictive: we just want to use available data to most accurately predict an outcome variable for a new individual - we may be less concerned about whether the predictors are causes or associations
question
how many oservations do we need per predictor?
answer
As in all statistical tests, we are making inferences from a sample. If we have observed too few in our sample we will be less confident about the conclusions we draw. We need enough observations (at least 10-20 per predictor variable included).
question
What variables do we want to include in a multivariant model?
answer
o we know from other research to be important o others that add to the ability of the model to explain or predict the outcome o predictor variables whose inclusion changes the parameter estimates of other predictors substantially (some say by more than 10%), since this suggests confounding between these
question
How to find effect modification in regression models?
answer
Effect modification won't be apparent from a regression model unless you look for it. The simplest way is to stratify the data on the potential effect modifier, run the same model on each stratum, and see if the effect estimates for predictor variables of interest differ. You would report the stratum specific results. There are other methods for addressing "interactions" between variables that are beyond the level of this course.
question
cutoff
answer
We often talk about diagnostic tests as "positive or negative."Even in these cases, there is often an underlying value of a continuous variable that has been chosen as the cutoff for "positive" vs. "negative." Choosing an appropriate cutoff depends on how we weigh the risks of false positive and false negative errors a perfect test would completely separate normal from abnormal but those test don't exist so for tests with continuous results, WE choose the cut-off below which we will consider normal (or vice versa) and there is ALWAYS a trade-off with sensitivity and specificity if we change out cutoff to increase sensitivity then specificty goes down and vice versa
question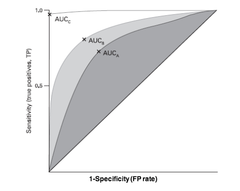
How does changing the cutoff affect the sensitivity/specificity?

answer
If we change our cutoff to increase sensitivity then specificity goes down. If we change our cutoff to increase specificity then sensitivity goes down. Such trade-offs are easily shown in Receiver Operating Characteristic Curves, which graph 1-specificity on the x axis and sensitivity on the y axis. We can compare different tests by graphing them together and showing their relative areas-under-the-curve (AUCs)
question
threshold probability
answer
the probability above or below which you will take action (eg. order an additional test, prescribe a treatment) varies with the clinical condition (severity) and the potential benefits of treatment and harms of undertreating, overtreating, or doing further testing
question
ROC

answer
Receiver Operating Curve a plot of the true positive rate (sensitivity) against the false positive rate (1-specificity; recall that specificity reflects true negatives) for the possible cut points of a diagnostic test. The closer the curve follows the left-hand border and the top border of the ROC space (passes through the upper left handcorner), the more accurate the test. Such a test has both high sensitivity and high specificity. The closer the curve comes to the 45-degree diagonal line the less accurate the test.
question
sensitivity
answer
test characteristic among pts with teh disease, how often is the test correct =correct test among patients who have the disease = true positives / (true positives + false negatives) a perfectly sensitive test never misses teh dz among thosewith the disease (TP + FN), how many have a positive test result (TP)?= TP/(TP + FN)
question
specificity
answer
among pts w/o the dz, how often is the test correct? =correct tests among pts who do not have the dz =true negatives/ (true negatices + false positives) a perfectly specific test never classifies a well person as sick among thosewithout the disease (TN + FP), how many have a negative test result (TN)?= TN/(TN + FP)
question
screening
answer
the use of a test to identify a disease before any clinical signs or symptoms manifest methods may include asking questions, physical exam (Ex. skin exam for stypical moles), blood test (eg. cholesterol or PSA level), or imaging studies typically prevalence of the condition is lower than in clinical diagnosis situations, in which patients present with symptoms (so prevalence is lower in pre-screening situations than with symptoms)
question
considerations for which conditions to screen for
answer
1.whether it is detectable before symptoms emerge 2.whether early treatment confers benefit 3. whether benefits to those with a positive screening test result outweigh the harms of screening (including the harms of false positive results)
question
biases of screening tests
answer
lead time bias, length time bias
question
lead time bias
answer
people with teh dz who get screened and then get treatment survive longer than ppl with the dz who do not get screened mistakenly conclude that screening + treatment cause improved survival, when what is really going on is that pts diagnosed earlier (before they showed symptoms) have more time to survive, even if treatment isn't helpful and their actual life expectancy is no different
question
length time bias
answer
cases of a particular condition (eg. cancer) that are progressing more slowly will be more prevalent in a screened population screening can only happen if you don't already know the patient has the dz, so if some dz types cause the pt to "have it without being sick from it," they are the ones you'll find by screening VS. pts with rapid dz progression spend less time "having it w/o being sick from it" therefore, pts with positive screening test appear to have better outcomes, but it is not bc screening + treatment is better, instead it's bc the dz in pts detected by screening is different from that in pts who present with symptoms
question
pretest probability
answer
the chance that hte pt has the dz before you have teh test results =prevalence of the dz among pts with the same characteristics determined by a combination of descriptive epidemiology and clinical gestalt
question
posttest probability
answer
the chance the patient has the disease after you have the test results Sensitivity and specificity are attributes of a test. However, clinicians are more concerned about the probability of their patient having the disease in question-the post test probability of disease. AKA PREDICTIVE VALUE of the test depends on the 1) test's sensitivity and 2) specificity, and on 3) the pre-test probability of dz - an application of Bayes Theorem
question
positive predictive value
answer
the chance that a positive test result accurately signifies the presence of the dz AKA post-test probability of DISEASE given a positive test PPV = TP/(TP + FP) dependent on test characteristics AND o pre-test probability of dz (Bayes application) For example, a positive test result (even for a test with reasonable sensitivity and specificity) in a patient with a very low pre-test probability may still not indicate a high probabilityof a disease
question
negative predictive value
answer
the chance that a negative test result accurately signifies the absence of the disease AKA th epost-test probability of NOT HAVING DISEASE given a negative test NPV = TN/(TN + FN) dependent on test characteristics AND o pre-test probability of dz (Bayes application)
question
post test probability negative
answer
post test probability of disease given negative test result = 1-NPV dependent on test characteristics AND o pre-test probability of dz (Bayes application)
question
likelihood ratios

answer
the probability of a given result in a person with the disease divided by the probability of that result in people without the disease combine sensitivty and specificity, are independent of the prevalence of dz, facilitate combining tests, and allow comparisons of info from different levels of the same test confidence intervals can be calculated bc, like anything, LRs can be affected by chance or bias
question
how do you calculate the posttest odds?

answer
multiply the pre-test odds by the likelihood ratio you can convert probability into odds
question
What are the steps toward evidence based medicine?
answer
1. create an answerable question, based on YOUR patient (or population of patients) 2. efficiently find the best evidence with which to answer it -> literature search 3. critically appraise published evidence (including summaries and guidelines) for validity and usefulness 4. Communicate results to your pt, and together determine a course of action 5. evaluate your performance
question
what is a systematic review?
answer
seeks to collate all evidence that fits pre-specified criteria in order to answer a specific research question aim is to minimize bias by using explicit methods for review key characteristics: 1. clearly stated set of objectives 2. pre-defined eligibility criteria for studies 3. explicit, reproducible methodology 4. systematic search attempting to identify all studies meeting eligibility criteria 6. assessment of validity of findings of the included studies 7. systematic presentation, and synthesis, of the characteristics and findings of hte included studies
question
meta-analysis
answer
pools data from mulitple prior studies issues to consider: 1. publication bias - authors are less likely to submit, journals are less likely to accept, pharmacy company studies more likely to suppress negative data 2. language and location bias: non-English language papers are less likely to be utilized 3. citation bias - positive studies more often cited and therefore easier to find 4. inclusion bias- patients may have particular characteristics that limit generalizability (eg. BMI > 50 kg/m2; diabetes w/o hypertension) 5. limitations of small studies - less rigorous, wider variability, less reliable, larger effects 6. heterogeneity of studies: can be variability in participants, interventions, outcomes, or methods
question
when is a meta-analysis most useful?
answer
1) when several small studies were done with unclear results (type 2 error)? 2) studies have conflicting results
question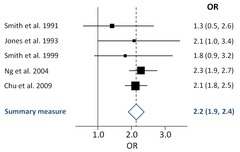
What is a forrest plot?

answer
graphic representation of each study showing directionality (eg. if an intervention was protective or harmful) size or weight of each study is reflected by the size of the square; the lines around each box represent the confidence intervals for each study; the larger diamond represents the overall point estimate with extreme edges representing the 95% confidence interval
question
how to evaluate heterogeneity in meta-analysis
answer
clinical heterogenity methodological heterogeneity statistical heterogeneity
question
clinical heterogeneity in meta-analysis
answer
variability in the participants, interventions, and outcomes studied
question
methodological heterogeneity in meta-analysis
answer
variability in study design
question
statistical heterogeneity in meta-analysis
answer
variability in the intervention effects
question
advantages and disadvantages of a meta-analysis
answer
Advantages: 1. allows estimation of a single point estimate 2. explicit methods limit bias in identifying and rejecting studies 3. conclusions from these studies may be more reliable and accurate bc of increased power by combining studies 4. large amonts of info can be assimilated quickly be healthcare providers, researchers, and policy makers 5. delay btwn research discoveries nad implementation of effective diagnostic and therapeutic strategies may be reduced 6. results of different studies can be formally compared to establish generalizability of findings and consistency (lack of heterogeneity) of results Disadvantages 1.findings not always consistent with those of large-scale high quality trials 2. synthesis of data from many studies may disguise or oversimplify important distinctions btwn primary studies with regard to inclusion/exclusion criteria or the nature of an intervention 3. reviews of similar topics may appear to reach different conclusions depending on the studies included/ excluded and methods used 4. biases may influence results of a meta-analysis
question
What are guidelines?
answer
typically developed by specialty organizations or "neutral" parties. Most now perform structured review of available evidence and provide explicitly report, for each recommendation: -quliaty of availbale evidence -strength of the recommendation guidelines from varying sources can make significantly diff recommendations. Must consider: 1. perspective of the sponsoring organization and individuals on the panel 2. transparency of their search strategy and approach to data analysis 3. populations on which teh studies are based, whether they are similar or different than the patient you are caring for 4. the extent to which the guideline recommendations account for differences among important patient subgroups 5. if there are other important patient factors (eg. medical factors, patient preferences) that make deviation from the guideline recommendations in teh best interest of your patient
question
Digoxin is a commonly used med for control of heart rate in chronic atrial fib. You do a case-control study examining the relationship btwn digoxin use and death from AF pts who died from AF compared to age, sex matched controls with AF who did not die. Which is unlikely to be a confounder of the measure of effect you calculate for this study: age hx of MI taking other heart meds smoking hx
answer
age
question
you are developing a new blood test for a fatal condition for which there is a widely available cure with virtually no side effects or other risks. In choosing a cut off, you would aim for which of the point on teh curve above
answer
D
question
In diagnosis of appendicitis, the likelihood ratio associated with having involuntary guarding on exam is 4. There is also a blood test for appendicitis that has a likelihood ratio of 5 when it returns positive. If the pretest odds of appendicitis before either test are 1:4, what is the post-test odds of dz after boht tests if both are positive, and assuming they are independent
answer
5:1 1/4 (4) + 1/4 (5) = 2.25
question
You are evaluating a new screening test for prostate cancer. In a prospective study you screen one group of randomly selected individuals and find they live longer (from the point of screening) lead time bias recall bias selection bias access to better medical care in the screened group
answer
lead time bias
question
You are interested in how exercise influences HbA1c levels, a marker of glucose control, among pts with diabetes who aren't yet taking meds. Hb A1c is a continuous, normally distributed variable. You are given access to only the baseline data of a cohort study with 5000 pts with diabetes. The mean A1c level is 7.5%. You also have data on whether subjects exercised ;60 min per week or ;60 min. What type of regression model would you use to determine independent associations of predictors with A1c? linear logistic Cox cannot decide based on the information
answer
linear
question
You are interested in how exercise influences HbA1c levels, a marker of glucose control, among pts with diabetes who aren't yet taking meds. Hb A1c is a continuous, normally distributed variable. You are given access to only the baseline data of a cohort study with 5000 pts with diabetes. The mean A1c level is 7.5%. You also have data on whether subjects exercised >60 min per week or <60 min. A regression model for A1c including only exercise as a predictor has a parameter estimate of 1.0 (for exercise). You think that age and gender could be confounders of the relationship between exercise and A1c. A multivariable regression including age and gender in the model produces the following. Based on the results of the adjusted model, which of the following is true of the original (unadjusted) relationship btwn exercise and A1c? a) confounding is present bc the p value for exercise in the model is 0.06 b) confounding is present bc age is a significant predictor of A1c in the model c) confounding is present bc the parameter estimate for exercise is 25% less than in the unadjusted model d) There is evidence in the model of effect modification according to gender
60 min per week or 60 min per week or
answer
confounding is present bc the parameter estimate for exercise is 25% less than in the unadjusted model
question
You are planning a double-blind randomized controlled trial of a new medicine for children under 5 with a diagnosis of ADHD.A prior study in 100 volunteers showed approximately 15% had mild side effects (weight loss) but none had serious side effects requiring hospitalization.The primary outcome measure in your study will be an ADHD symptom scale (a continuous measure) that is filled out by parents and teachers.All of the following are true about the power for your study, EXCEPT: A. It will depend on the clinically important difference in the outcome you wish to detect B. It will depend on the pre-specified level of Type I error you will accept C. It is influenced by the variability in your outcome measure D. By convention, most trials are designed to have a risk of Type II error of <5%
answer
By convention, most trials are designed to have a risk of Type II error of <5%
question
You are planning a double-blind randomized controlled trial of a new medicine for children under 5 with a diagnosis of ADHD.A prior study in 100 volunteers showed approximately 15% had mild side effects (weight loss) but none had serious side effects requiring hospitalization.The primary outcome measure in your study will be an ADHD symptom scale (a continuous measure) that is filled out by parents and teachers. You would likely need to address all of the following in your plan for this trial, EXCEPT A. Complex analyses to control for potential confounders B. A data safety monitoring board C. Clear eligibility criteria for participation D. Informed consent from parents or guardians of the participants
answer
Complex analyses to control for potential confounders bc with RCT, you won't have as many confounders
question
You are planning a double-blind randomized controlled trial of a new medicine for children under 5 with a diagnosis of ADHD.A prior study in 100 volunteers showed approximately 15%had mild side effects (weight loss) but none had serious side effects requiring hospitalization.The primary outcome measure in your study will be an ADHD symptom scale (a continuous measure) that is filled out by parents and teachers.The greatest potential weakness of this study is likely to be: A. bias B. confounding C. generalizability D. inability to assert that the drug is the cause of differences observed
answer
generalizability (external validity)
question
A new test has been developed for non-invasive maternal plasma DNA sequencing for fetal trisomy 21. Both the plasma sequencing and full karyotyping (the gold standard) were done on 753women, 86 of whom had a fetus with trisomy 21.None of the women whose fetus had trisomy 21 had a negative test. Of the women whose fetus did nothave trisomy 21, 14 had a positive test and 653 had a negative test.Make a 2 x 2 table and calculate sensitivity and specificity for the test
answer
sens =100 spec = 97.9
question
Overall rates of trisomy 21 in the general population are 1 in 800 live births. Using either the likelihood ratio method or a hypothetical population with this rate of disease, calculate the post-test probability of disease given a positive test (also known as the positive predictive value).
answer
100/ (100-97.9) = 47.6 (1/799) * 47.6 = 0.059 post test odds probability = .059/(1+.059) = 5.6
question
You are planning a large randomized trial of a new medication that could represent a major advance in treating colon cancer. Which of the following (holding other things constant) would decrease the power to detect a positive effect in the outcome of cancer remission at the end of the study period. a.Decreasing misclassification of who is in remission and who is not. b.Changing your pre-defined threshold for making a Type I error from .05 to .01 c.Increasing the sample sized. d. Using a one-tailed test of significance
answer
Changing your pre-defined threshold for making a Type I error from .05 to .01
question
Your patient has been diagnosed with Hepatitis C and is worried about her risk of progression to liver fibrosis. You read the following in a paper about progression to liver fibrosis in which women with Hepatitis C were all followed for 5 years, and designated at the end of that period as progressing or not progressing. From a table of unadjusted results alcohol of ;2 drinks per day was associated with progression (at the end of 5 years) to fibrosis (OR = 3.0). Then, they conclude "In multivariable models (that predict progression at the 5 year follow-up time point) stratified by menopausual status, the OR for >2 drinks per day was 1.2among premenopausal women, and 4.8 in post-menopausal women."a.What type of multivariable modeling is this?b.The direct output of the model was the parameter estimate (?) for alcohol use ;2 drinks/day. How did the investigators calculate the odds ratio from this ??
answer
a. logistic - finding an odds ratio! b. exponentially odds = e^Beta
question
Which of the following is often a weakness of even well-conducted randomized trials?a.They are subject to confounding more than other designs.b.There is no way to estimate the required sample size before the study is begun.c.The sample studied may be different from the overall population of patients with the condition. d.The level of alpha error is not set at the beginning
answer
The sample studied may be different from the overall population of patients with the condition.
question
The figure below represents a distribution of sample means if the null were true (on the left) and under a specific alternative hypothesis (on the right) a.What does line A represent? b.What does area B represent?
answer
a) the threshold for type 1 error (alpha) we will allow (p-value ok) b) the power of the study
question
You conduct a survey of adults to assess the relationship between body mass index (BMI) and two behaviors -smoking and alcohol consumption. The study includes 1000 adults between the ages of 35 and 65. You decide to conduct your analysis using multivariable regression. Smoking status is coded as 0 for non-smokers and 1 for smokers. The variable alcohol consumption represents the number of daily alcohol beverages consumed (range 0 to 20). You get the following regression equation as your result:BMI =27.0 -3.0(smoker) + 0.2(alcohol consumption) a. What type of regression is this?a.Linearb.Logisticc.Poissond.Negative binomial b. How different is the BMI between smokers and non-smokers, and which group has a higher BMI?c. What is the effect of the number of alcohol drinks consumed daily on BMI?
answer
A) linear B) non-smokers have higher BMI ; smokers have 3.0 kg/m2 lower BMI on average than non-smokers C) for every one unit of alcohol, BMI increases by .2


