Public Health 6003/week 3 – Flashcards
Unlock all answers in this set
Unlock answersquestion
Artifactual Reasons for Differences in Rates or Trends, Continued
answer
. Diagnostic inaccuracy leading to misclassification . Technological changes leading to new, more sensitive diagnostic tests (e.g., PSA test) * Differences in quality of/access to health care * More complete ascertainment of cases * Changes in definition or classification of a disease *Errors in enumerating the population (affects the denominator)
question
Mortality and Fatal Cases
answer
Death certificate: most commonly used form in assessing mortality and fatal cases Mortality: most commonly used data for calculation of rates
question
Death Certificates
answer
Registration of all deaths required by law in most developed countries. Cause-of-death information normally comes from the physician in attendance Suspicion of foul play or suicide? or death was accidental?- autopsy is required.
question
Standard Death Certificate
answer
Items 32a-32d on death certificate list cause-of-death information. Information is recorded in a hierarchy from: immediate to underlying cause. The underlying cause is coded and used for compiling mortality statistics. Receives ICD code
question
Confidential Component of the Birth Certificate
answer
Contains important public health information: Parents' race, ethnicity, education level Pregnancy history Baby's birth weight, duration of labor, gestational age, etc. whether mother smoked etc APGAR scores
question
Usefulness of Birth Certificates
answer
Can be of mixed utility More useful for measuring easily observable or obvious birth defects
question
National Notifiable Disease Surveillance System (NNDSS)
answer
Cosponsored by the CDC and state health departments. EVERY STATE Over 50 infectious diseases selected for reporting. Consensus case definitions for each reportable disease developed. Reporting system is passive- requires healthcare provider to provide info - Leads to underreporting of less severe diseases.
question
NNDSS
answer
Hospital/Practitioner/Labs --> Local Health Dept --> state health department --> CDC (no identifiers)
question
Registries
answer
Compile and monitor data on specific conditions Gather data from multiple sources on individual cases of disease Some are hospital- or clinic-based: Surveillance Epidemiology and End Results (SEER) cancer registry
question
Administrative/Insurance Records
answer
Generated as byproduct of clinical care (i.e., health insurance claims records) Available electronically Well documented and standardized Prone to both systematic and random errors
question
The International Classification of Disease (ICD) Coding System
answer
All reported mortality statistics rely on the ICD coding system Allows for systematic comparison of deaths between countries Originated in the late 19th century Designed to standardize the international reporting of causes of death Currently in the 10th revision (ICD-10) Utilized by trained professionals know as nosologists
question
Comparability Ratios
answer
How would the number of cases of cause of death compare across ICD revisions? National Center for Health Statistics calculates comparability ratios whenever there's an ICD revision.
question
The Population Census
answer
In order to calculate rates, we need an estimate of the population. In the United States, a census has been conducted every 10 years since 1790. In 1902, the U.S. Census Bureau became a government agency. In 1976, Congress passed a bill authorizing a census to be taken midpoint between the regular 10-year census. The census has historically suffered from underenumeration of certain racial and ethnic minorities. In 1980, ethnic identity was expanded to include 15 ethnic and racial categories.
question
Clinical Records
answer
Widely used for research HIPAA/patient confidentiality regulations have limited access over last 10 to 15 years
question
Outbreak investigation
answer
applies science, technology, and common sense to describing and unraveling an epidemic. It is a classic example of the use of descriptive epidemiology.
question
Purpose of Outbreak Investigation
answer
To determine what is causing the disease To prevent spread of disease
question
Steps in an Outbreak Investigation
answer
*Establish the existence of the epidemic. *Confirm the diagnosis. * Develop a case definition. *Identify/count cases to determine who is at risk. *Describe the cases by time, place, person. *Develop a hypothesis and evaluate against established facts. *Plan/conduct an analytic study. *Implement control and prevention efforts. *Prepare and disseminate a report
question
The Epidemic Curve
answer
A histogram or bar chart plotting the number of cases of disease versus calendar time A primary tool of outbreak investigation Provides clues about source of outbreak and incubation period Uses an appropriate time interval so that you can "see" the development of the epidemic
question
An epi curve can provide information on the following characteristics of an outbreak:
answer
Pattern of spread Magnitude Outliers Time trend Exposure and/or disease incubation period
question
The overall shape of the epi curve can reveal the type of outbreak:
answer
Common source Point source Propagated, or person to person Mixed
question
Outbreak Pattern of Spread: Common Source curve

answer
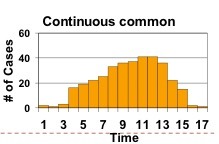
People are exposed either continuously or intermittently to a harmful source. Period of exposure may be brief or long. . smooth broad shoulder curve as the increase and then
question
Continuous exposure

answer
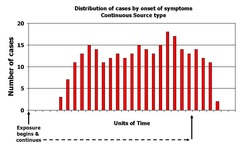
will often cause cases to rise gradually (and possibly to plateau, rather than to peak). exposure is prolonged as infection is persistent- occurs *over more than 1 incubation period*. Downward slope is very sharp (if source removed) or gradual if infection exhausts itself
question
Intermittent exposure source curve

answer
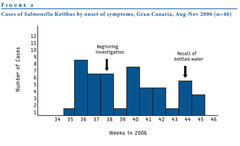
often results in an epi curve with irregular peaks that reflect the timing and the extent of exposure
question
Outbreak Pattern of Spread: Point Source curve

answer
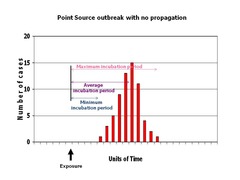
It typically shows a sharp upward slope and a gradual downward slope. A point source is a common source outbreak in which the period of exposure is brief, and all cases occur within one incubation period. ex contaminated food or an infected food handler, and all the exposures tend to occur in a relatively brief period.
question
Outbreak Pattern of Spread: Propagated (person to person)

answer
A propagated outbreak is spread from person to person or can be vector-borne. It can last longer than common source outbreaks. It may have multiple waves if secondary and tertiary cases occur. The classic epi curve for a propagated outbreak has *progressively taller peaks each an incubation period apart*. first waves- primary cases expose secondary 'wave' of cases
question
Propagated (person to person) vs Intermittent
answer
successive increase in the amplitude. no wide gaps between cases
question
Period of Exposure/Incubation Period for the Outbreak
answer
The time between the exposure and the peak of the epi curve represents the median incubation period All known infectious agents have characteristic or typic al epi curves. If the timing of the exposure is known, epi curves can be used to estimate the incubation period of the disease.
question
Incubation Period
answer
During the incubation period, you feel well and show no signs of disease. For some diseases, you are able to transmit the disease to others during the incubation period. Calculate incubation period as difference between time of exposure and time of onset of symptoms.
question
How Do I Make an Epi Curve?
answer
Use software such as Epi Infor or SAS. Plot the time or date of illness onset on the x-axis. Plot the number of cases of disease reported during an outbreak on the y-axis.
question
Technical Tips for Making an Epi Curve
answer
Choice of time unit for the x-axis depends upon the incubation period. Usually the day of illness onset is the best unit for the x-axis. If the incubation period is very short, hour of onset may be more appropriate. If the incubation period is very long, week or month may be more appropriate. The x- and y-axes should start at time equals zero, which is typically time of exposure. Epi curves are histograms: there should not be any space between the x-axis categories. Label each axis. Provide a descriptive title. Include the preepidemic and postepidemic period to show the baseline number of cases.
question
What's an Attack Rate?
answer
is the proportion of people in an exposed or unexposed group who became ill. This proportion is often expressed as a percent.
question
An epi curve is
answer
a graphic depiction of the number of outbreak cases by date of illness onset. It is useful because it can provide information on the out- break's (1): • Pattern of spread • Magnitude • Outliers • Time trend • Exposure and/or disease incubation period
question
"outliers."
answer
Cases at the very beginning or end that do not appear to be related to the oubreak may be unrelated to the outbreak, may be the source of the epidemic (such as an infected food handler) or a person who was exposed early. Late cases may also be unrelated, but they may also be secondary cases or persons exposed later than most.
question
Index case:
answer
The first case patient in a family or other defined group to come to the attention of the investigator.
question
Stratifying:
answer
The process of separating a sample into several sub-samples according to specific criteria, such as age groups or gender.
question
median incubation period.
answer
time between the exposure and the peak of the epi curve. given median incubation- subtract from the MEDIAN (middle #) of the curve.
question
Outbreak
answer
the sudden occurrence of a disease, in unexpected numbers in a limited area, w/c then subsides
question
descriptive epidemiology
answer
essential for characterizing the pattern and distribution of the outbreak- also for generating testable hypotheses about the source and mode of transmission and risk factors fr the disease
question
case definition
answer
A decision making toolset of standard criteria for deciding whether a person has a particular disease or health-related condition, by specifying clinical criteria and limitations on time, place, and person.
question
specific case
answer
Used to correct for factors that may influence the make-up of pop and in turn influence crude rates. Specific rates refer to a particular subgroup of the pop (race, age, or sex, etc). Ex. Age-specific rate
question
sensitive case
answer
is broad or "loose," in the hope of capturing most or all of the true cases
question
Epidemiology food as a suspected source?
answer
use of the difference in the attack rates for different (exposures and risk ratios for those exposed and non exposed
question
using incubation of an epidemic curve to determine onset
answer
median incubation given? subtract from the MEDIAN # of cases also if MIINIMUM incubation given- subtract from the time of onset
question
spot maps
answer
Each case or outbreak in a geographic region is entered by placing a dot at the appropriate location NOT used to display rates
question
area maps
answer
used to display incidence and prevalence rates
question
hypotheses generated
answer
subject matter knowledge- reviewing literature; talking to experts reviewing overall patter and utliers from descriptive epidemiology speaking with case patients or local authrities
question
key features of an analytic epidemiologic study
answer
presence of a comparison group single case reports and case series do NOT have comparison groups- thus NOT an analytic study
question
cluster
answer
an aggregation of cases in a given area over a particular time period- SEEMS suspicious or unusual but often the usual or expected # of cases is not known
question
Tips on Interpreting Epidemic Curves
answer
1) Consider the overall shape of the epidemic curve. The shape will be determined by the incubation period and whether it is a common source versus propagated epidemic. 2) Find the peak of the outbreak and count back on the time axis one incubation period. Also identify the earliest case in the outbreak and count back the minimum incubation period. If these dates are at all close, they may identify the time period during which the cases became exposed. 3) In a point source epidemic with a known disease, you can use the epidemic curve to calculate a likely period of exposure. This provides two advantages: a) You can identify the likely period of exposure, and this will help with directing questions to the cases about possible exposures. b) It may point to the index case. 4) If the causative organism has not yet been identified, the epidemic curve may help by enabling you to calculate the incubation period.


