Epidemiology case studies etc – Flashcards
Unlock all answers in this set
Unlock answersquestion
Learning Objectives of Epidemiology and Public Health

answer
Learning Objectives You should be able to: 1- Define epidemiology & Public Health 2- Compare medicine practised on individuals in a clinical setting to that practised at a population level 3- Understand the strengths & limitations of the population perspective 4- Know what a "rate" is in general terms
question
Epidemiology
answer
the study of the distribution and determinants of diseases in human populations. It seeks to understand the background of a disease and identify its causes, so making possible its prevention
question
Public Health Epidemiology
answer
The study of DISEASE INCIDENCE
question
Clinical Epidemiology
answer
The study of DISEASE PROGNOSIS
question
Public Health
answer
the science and art of prolonging life, preventing disease and promoting health by the organised efforts of society
question
Clinical medicine
answer
is concerned with people who already have the disease, it seeks to understand how the disease progresses what its effects are, and how it can be treated
question
Essence of Epidemiology
answer
lies in comparing incidence or prevalence rates between populations or between groups within a population.
question
Epidemiology conclusions
answer
Because epidemiologists deal in terms of rates, their conclusions relate to GROUPS, rather than individuals. They seek to explain why one population e.g. country or group e.g. poorer families has more illness than another
question
Epidemiological "rates"
answer
"Rate" = Number of cases* / divided by Population at risk eg Number of people in Llandovery with flu / the number of people in Llandovery * Incidence rates (new cases) and mortality rates (fatal cases) also specify a time period Prevalence rates (existing cases only) = number of people with flu NOW # Sometimes called "catchment population"
question
Prevalence
answer
the number of existing cases of the disease / divided by total number of patients in catchment eg number of people with flu NOW in llandovery / number of people in Llandovery ALSO defined as incidence x duration
question
Incidence (note: not incidence rate!)
answer
number of new cases of diseases / number in catchment population
question
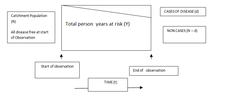
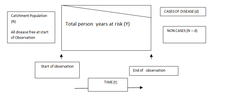
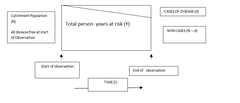
Cumulative incidence (look at sheet) NOTE NOT INCIDENCE RATE, In some ways, the cumulative word is unecessary

answer
= d/N where d = the number of cases of disease and N is the catchment population
question
Incidence rate (look at sheet)

answer
= d/Y where d is the cases of disease and Y is the catchment population multiplied by the number of years looked at
question
Odds of disease (see sheet)

answer
= d/(N-d) where d = the number of cases of disease and N is the catchment population so N-d is the number in the population that have not developed the disease
question
Cumulative incidence
answer
number of persons who become diseased during a defined follow up period (d) / divided by number of persons in the population at the start of the follow up period (N)
question
Incidence rate
answer
number of persons who become diseased during a defined period (d) / divided by total person time at risk during the follow up period (Y)
question
Cross sectional study
answer
A study in which a representative cross section of the population is tested or surveyed at one specific time
question
CROSS SECTIONAL STUDY
answer
Do persons with the characteristic HAVE THE DISEASE more frequently than those who do not have the characteristic? i.e= do people who smoke HAVE the disease more frequently than those who DO NOT smoke?
question
Advantages of Cross sectional survey
answer
Suited to study common diseases Relatively quick and easy to carry out Can give estimates of the prevalence of a disease eg so you can tell how many people have the diseases NOW
question
Disadvantages of Cross sectional study
answer
Not suited to study rare conditions as large number of people would need to be sampled to obtain a good estimate of the prevalence Care needs to be taken with the selection of the sample to ensure it is representative of the population No estimates of the incidence of a disease
question
Cohort
answer
A group of people who share a common characteristic (eg smokers) or experience within a defined period (e.g., are born, are exposed to a drug or vaccine or pollutant, or undergo a certain medical procedure). The comparison group may be the general population from which the cohort is drawn, or it may be another cohort of persons thought to have had little or no exposure to the substance under investigation, but otherwise similar. In a cohort study, healthy subjects are defined according to their exposure status and followed over time to determine the incidence of symptoms, disease, or death. The common characteristic for grouping subjects is their exposure level. Usually two groups are compared, an "exposed" and "unexposed" group. The unexposed group is called comparison group
question
COHORT STUDY
answer
Do persons with the characteristic DEVELOP THE DISEASE more frequently than those who do not have the characteristic So we are really looking at two cohorts, i.e. the one exposed to the characteristic and the other cohort that has not been exposed to the characteristic eg = are people who have been exposed to asbestos have lung cancer (mesothelioma) more commonly than those who have never been exposed?
question
Cohort study
answer
A form of longitudinal study (a type of observational study) used in medicine. It is an analysis of risk factors and follows a group of people who do not have the disease, and uses correlations to determine the absolute risk of people catching the disease
question
Definition of a case control study
answer
A case - control study starts with the identification of a group of CASES (individuals with a particular illness or condition) and a group of CONTROLS (individuals without a particular illness or condition). The prevalence of a particular EXPOSURE is then measured in the two groups and compared. If the exposure is more common among the cases than controls, it may be a RISK FACTOR for the disease. If it is less common, it may be a PROTECTIVE FACTOR CASE CONTROLS ARE QUICK TO CARRY OUT
question
CASE CONTROL STUDY
answer
Do persons with the disease HAVE A CHARACTERISTIC more frequently than those without the disease Those who have the disease are termed cases, and those who do not have the disease are termed controls. The exposure histories of cases and controls are then obtained and compared.
question
Endemic

answer
when a disease persist for a long period within a community
question
Epidemic

answer
when the occurrence of disease episodes increase substantially for a limited period of time
question
Definition of disease outbreak can be defined in two ways
answer
1 An incident affecting two or more people within a given period of time /place with a common exposure to a potential source and experiencing a similar or proven illness OR a rate of infection greater than the expected rate for that place and time, where spread is occurring through cross infection, or person to person
question
A Point Source Outbreak suggests
answer
an introduction of an infection to a group of people at ONE POINT in time
question
A SECONDARY (person to person) spread suggests
answer
infection spread from one person to another person, rather than the initial point source outbreak
question
Risk ratio = (must look at image on questions 12,13,and 14 above)
answer
Cumulative incidence in exposed group / cumulative incidence in non-exposed group d/N (of exposed group) divided by d*/N* (of non exposed group)
question
rate ratio = (must look at image on questions 12,13,and 14 above)
answer
incidence rate in exposed group / incidence rate in non-exposed group d/Y (of exposed group) divided by d*/Y* (of non exposed group)
question
Odds ratio = (must look at image on questions 12,13,and 14 above)
answer
Odds of disease in exposed group / Odds of disease in unexposed group d/(N-d) (of exposed group) divided by d*/N-d*)* (of non exposed group)
question
Rate ratios, risk ratios and Odds ratios are examples of
answer
Relative Risk
question
Relative Risk = ( see example on separate sheet word document Relative and Absolute excess GOOD EXAMPLES)
answer
A measure of the STRENGTH of an association. It has NO units e.g.
question
A relative risk of 1.0
answer
This implies NO EFFECT to an exposure of a disease occurring
question
The most helpful measure to establish causation is
answer
Relative Risk
question
Null hypothesis
answer
A general or default position is that there is no relationship between two measured phenomena, (e.g. that a potential medical treatment has no effect
question
If the NULL HYPOTHESIS IS TRUE, the odds ratio (i.e. relative risk) will be
answer
1 (ONE)
question
p-value
answer
the probability of obtaining a test statistic at least as extreme as the one that was actually observed, assuming that the null hypothesis is true
question
Confidence Interval
answer
CI around a result obtained from a study sample indicates the range of values within which there is a specific level of certainty (usually 95%) that the true population value for that result lies A confidence interval gives an estimated range of values which is likely to include an unknown population parameter, the estimated range being calculated from a given set of sample data.
question
"Attributable risk" and "Population Attributable risk" are examples of ( see example on separate sheet word document Relative and Absolute excess GOOD EXAMPLES)
answer
Absolute risk
question
The most helpful measure for Policy Making is
answer
Absolute Risk
question
Explaining Confounding
answer
In an ideal laboratory experiment the investigator alters only one variable at a time, so that any effect he observes can only be due to that variable. Most epidemiological studies are observational, not experimental, and compare people who differ in all kinds of ways, known and unknown. If such differences determine risk of disease independently of the exposure under investigation, they are said to confoundits association with the disease. ("Confoundits complicate the results, and this can be either negatively or positively") For example, several studies have indicated high rates of lung cancer in cooks. Though this could be a consequence of their work (perhaps caused by carcinogens in fumes from frying), it may be simply because professional cooks smoke more than the average. In other words, smoking might confound the association with cooking. Confounding determines the extent to which observed associations are causal. It may give rise to spurious associations when in fact there is no causal relation, or at the other extreme, it may obscure the effects of a true cause. Two common confounding factors are age and sex. Crude mortality from all causes in males over a five year period was higher in Bournemouth than in Southampton. However, this difference disappeared when death rates were compared for specific age groups. It occurred not because Bournemouth is a less healthy place than Southampton but because, being a town to which people retire, it has a more elderly population.
question
variance
answer
is a measure of the spread of observations around a mean. It is the square of the standard deviation.
question
memory bias / recall bias
answer
A cognitive bias that either enhances or impairs the recall of a memory , or that alters the content of a reported memory.
question
Chi-square
answer
Is a statistical test commonly used to compare observed data with data we would expect to obtain according to a specific hypothesis. For example, if, according to Mendel's laws, you expected 10 of 20 offspring from a cross to be male and the actual observed number was 8 males, then you might want to know about the "goodness to fit" between the observed and expected. Were the deviations (differences between observed and expected) the result of chance, or were they due to other factors. How much deviation can occur before you, the investigator, must conclude that something other than chance is at work, causing the observed to differ from the expected. The chi-square test is always testing what scientists call the null hypothesis, which states that there is no significant difference between the expected and observed result.
question
bias
answer
a partiality that prevents objective consideration of an issue or situation i.e. a lack of pure objectivity e.g. selection bias or recall/memory bias
question
Risk Factor
answer
A risk factor is anything which DISTINGUISHES groups at highet or lower risk of disease. It need not be CAUSAL
question
Examples of FIXED RISK FACTORS include
answer
age, sex, family history and genes
question
Examples of potentially MODIFIABLE RISK FACTORS (e.g. in heart disease) include
answer
Obesity, smoking, blood pressure, plasma cholesterol.
question
A plasma cholesterol of 6.5 is regarded a upper limit of normal. What criteria might have been used to define "upper level of normal"
answer
NORMALITY and ABNORMALITY may be defined as i STATISTICALLY (e.g. a certain % of the population exceed the cut off (above 2 Standard Deviations) ii with reference to SYMPTOMS (not relevant to cholesterol) iii with reference to future COMPLICATIONS iv with reference to the BENEFITS OF TREATMENT In case of cholesterol i and iv are used
question
CLASSIFICATION OF PREVENTION
answer
Primary, secondary, tertiary prevention
question
How do we define these and distinguish between classifications of prevention?
answer
On the basis of the stage of disease
question
No disease developed =
answer
Primary Prevention e.g. immunization, or stopping smoking before Lung cancer develops
question
Early disease =
answer
Secondary Prevention e.g. treating patients with early atheroma for high BP or high cholesterol to stop heart attacks or strokes occurring
question
Late disease =
answer
Tertiary prevention - putting a stent into a patient who has had a heart attack to try and prevent another MI occurring
question
STRENGTHS OF HIGH RISK STRATEGY
answer
Can offer intervention appropriate to individual because subject at high risk, intervention could be:- Effective Cost effective Motivation of subject and doctor usually high Approach fits within medical model Avoids interference with low risk population
question
WEAKNESSES OF HIGH RISK STRATEGY
answer
Process involves risk factor SCREENING which provides imperfect prediction of those at risk has costs has risks offers imperfect prediction of those at high risk - * Some high risk subjects will have developed disease (secondary not primary prevention) No attempt to interfere with the incidence of disease - this is a palliative strategy for prevention, not a radical one Represents medicalization of health and prevention Often socially or behaviourally inappropriate - singling out a small subset of the population who have to behave differently
question
STRENGTHS OF POPULATION STRATEGY
answer
Radical, aiming to reduce disease incidence Large potential benefits especially where risk is widespread in population Often behaviourally appropriate - no need for some individuals to behave differently Does not require screening/identification of high risk group Does not depend on medical care services, which tend to be expensive
question
WEAKNESSES OF POPULATION STRATEGY
answer
Usually depends on a sense of public purpose and/or political will - individuals and health professionals are poorly motivated Measures needed may be complex (see next) Though benefit for the population can be large, benefit for individuals (even high risk individuals) is small - `prevention paradox' If the population strategy involves adding a new factor with potential adverse effects (e.g. fluoride into drinking water) balance of benefit and harm may be narrow
question
95% central reference range
answer
The SD is a measure of the spread of values in individual people about a mean. The 95% reference range is where 95% of the values fall as is given bu the mnean +/-2 x SD.
question
Blinding
answer
...


